Uploads by EXT-Z-Konstantinou
This special page shows all uploaded files.
| Date | Name | Thumbnail | Size | Description | Versions |
|---|---|---|---|---|---|
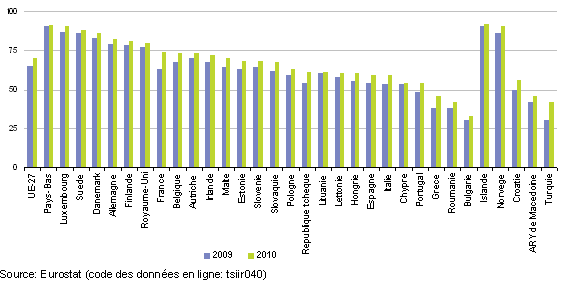
| 16:57, 18 October 2012 | Internet access of households, 2009-2010 (% of all households)-fr.png (file) | -fr.png) |
10 KB | Graphique 1: Accès des ménages à l’internet, 2009-2010<br />(en % de l’ensemble des ménages) - Source: Eurostat {{Stable link|title=|code=tsiir040}} | 2 |
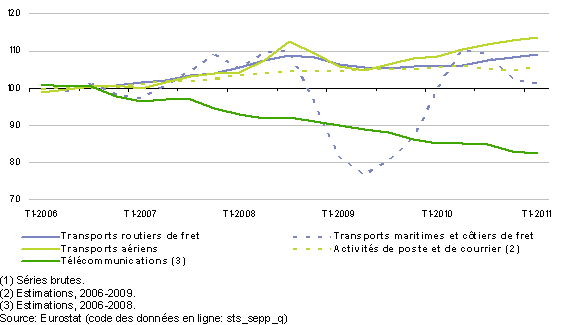
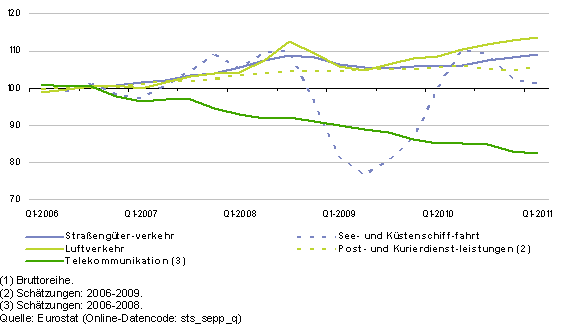
| 16:13, 18 October 2012 | Output price indices, selected service activities, EU-27, 2006-2011 (1) (2006=100) partA-fr.png (file) | _(2006%3D100)_partA-fr.png) |
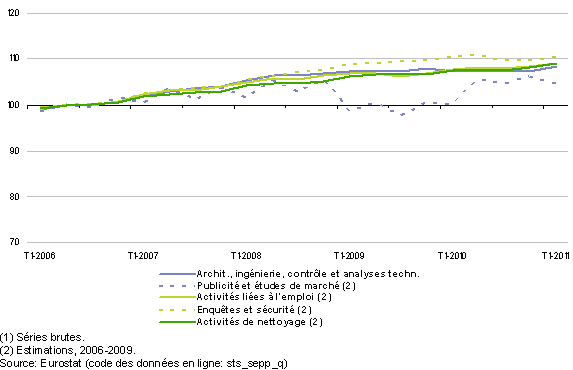
9 KB | Graphique 3a: Indices des prix à la production, sélection d’activités de services, UE-27, 2006-2011 (1)<br>(2006=100) - Source: Eurostat {{Stable link|title=|code=sts_sepp_q}} | 3 |
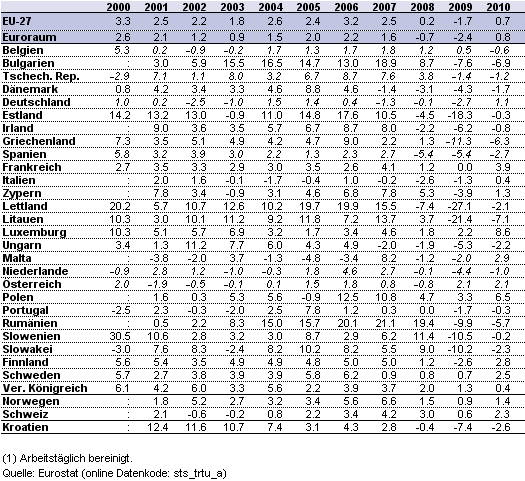
| 16:06, 18 October 2012 | Annual growth rates for the volume of sales index, retail trade, 2000-2010 (1) (%)-de.png (file) | _(%25)-de.png) |
26 KB | Tabelle 2: Jährliche Wachstumsraten für den Umsatzvolumenindex, Einzelhandel, 2000-2010 (1)<br>(in %) – Quelle: Eurostat{{Stable link|title=|code=sts_trtu_a}} | 1 |
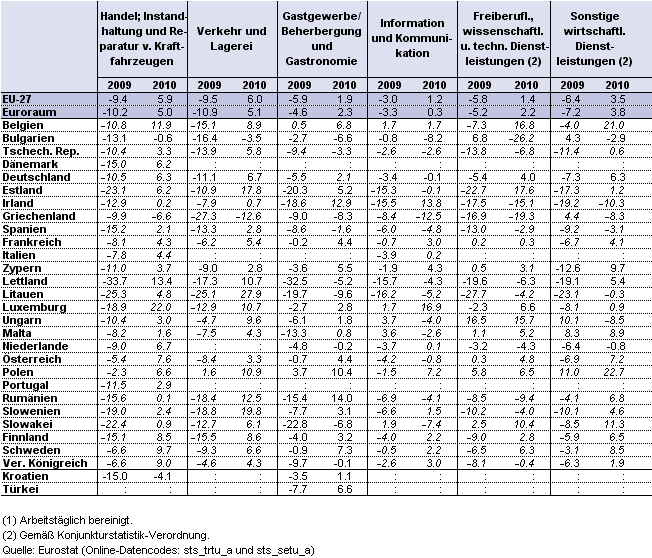
| 16:05, 18 October 2012 | Annual growth rates for the index of turnover, selected services, 2009-2010 (1) (%)-de.png (file) | _(%25)-de.png) |
40 KB | Tabelle 1: Jährliche Wachstumsrate für den Umsatzindex, ausgewählte Dienstleistungsbranchen, 2009-2010 (1)<br>(in %) – Quelle: Eurostat {{Stable link|title=|code=sts_trtu_a}} und {{Stable link|title=|code=sts_setu_a}} | 1 |
| 16:03, 18 October 2012 | Output price indices, selected service activities, EU-27, 2006-2011 (1) (2006=100) partA-de.png (file) | _(2006%3D100)_partA-de.png) |
9 KB | Abbildung 3a: Erzeugerpreisindizes, ausgewählte Dienstleistungsbranchen, EU-27, 2006-2011 (1)<br>(2006=100) – Quelle: Eurostat{{Stable link|title=|code=sts_sepp_q}} | 1 |
| 16:01, 18 October 2012 | Output price indices, selected service activities, EU-27, 2006-2011 (1) (2006=100) partB-de.png (file) | _(2006%3D100)_partB-de.png) |
12 KB | Abbildung 3b: Erzeugerpreisindizes, ausgewählte Dienstleistungsbranchen, EU-27, 2006-2011 (1)<br>(2006=100) – Quelle: Eurostat{{Stable link|title=|code=sts_sepp_q}} | 1 |
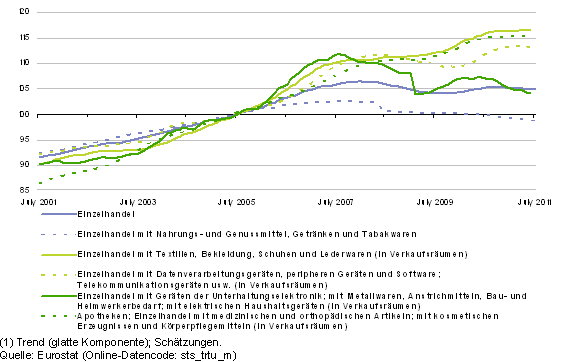
| 15:59, 18 October 2012 | Volume of sales index, selected retail trade activities, EU-27, 2001-2011 (1) (2005=100)-de.png (file) | _(2005%3D100)-de.png) |
16 KB | Abbildung 2: Umsatzvolumenindex, ausgewählte Einzelhandelsbranchen, EU-27, 2001-2011 (1)<br>(2005=100) – Quelle: Eurostat{{Stable link|title=|code=sts_trtu_m}} | 1 |
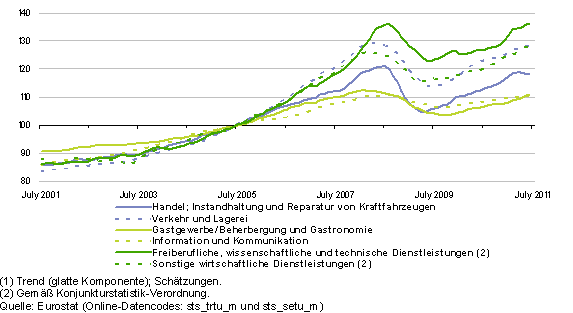
| 15:58, 18 October 2012 | Index of turnover, selected service activities, EU-27, 2001-2011 (1) (2005=100)-de.png (file) | _(2005%3D100)-de.png) |
12 KB | Abbildung 1: Umsatzindex, ausgewählte Dienstleistungsbranchen, EU-27, 2001-2011 (1)<br>(2005=100) – Quelle: Eurostat {{Stable link|title=|code=sts_trtu_m}} und {{Stable link|title=|code=sts_setu_m}} | 1 |
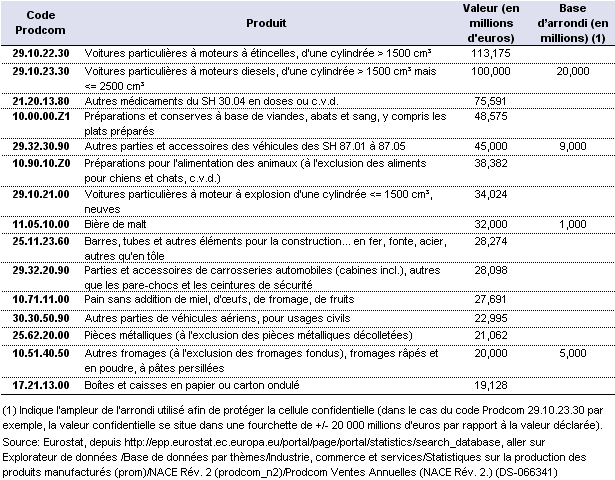
| 15:52, 18 October 2012 | Quantity of production sold, selected products, EU-27, 2010-fr.png (file) |  |
21 KB | Tableau 2: Production vendue, en quantité, pour une sélection de produits, UE-27, 2010 | 2 |
| 15:46, 18 October 2012 | Production sold in value terms, selected products, EU-27, 2010-fr.png (file) |  |
29 KB | Tableau 1: Production vendue, en valeur, pour une sélection de produits, UE-27, 2010 | 2 |
| 15:06, 18 October 2012 | Output price indices, selected service activities, EU-27, 2006-2011 (1) (2006=100) partB-fr.png (file) | _(2006%3D100)_partB-fr.png) |
9 KB | Graphique 3b: Indices des prix à la production, sélection d’activités de services, UE-27, 2006-2011 (1)<br>(2006=100) - Source: Eurostat {{Stable link|title=|code=sts_sepp_q}} | 1 |
| 15:04, 18 October 2012 | Annual growth rates for the volume of sales index, retail trade, 2000-2010 (1) (%)-fr.png (file) | _(%25)-fr.png) |
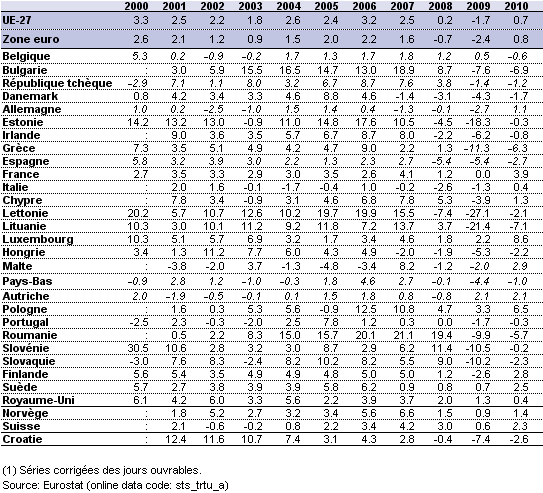
27 KB | Tableau 2: Taux de croissance annuels de l’indice du volume des ventes, commerce de détail, 2000-2010 (1)<br>(en %) - Source: Eurostat {{Stable link|title=|code=sts_trtu_a}} | 1 |
| 15:03, 18 October 2012 | Annual growth rates for the index of turnover, selected services, 2009-2010 (1) (%)-fr.png (file) | _(%25)-fr.png) |
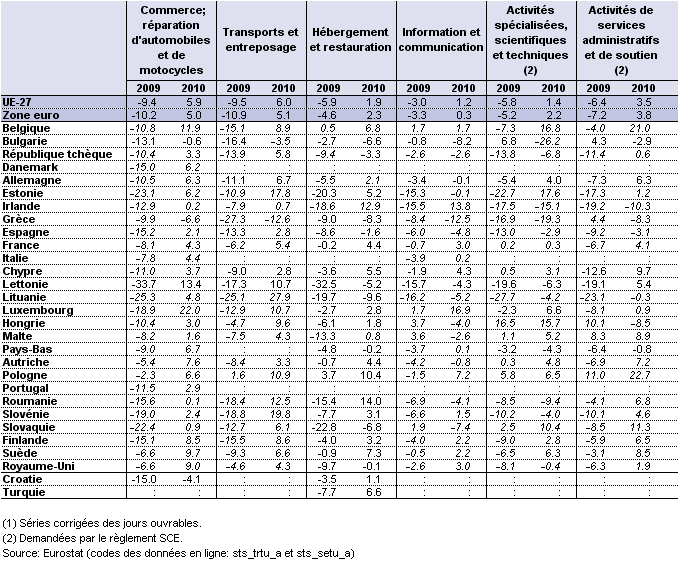
40 KB | Tableau 1: Taux de croissance annuel du chiffre d’affaires, sélection d’activités de services, 2009-2010 (1)<br>(en %) - Source: Eurostat {{Stable link|title=|code=sts_trtu_a}} et {{Stable link|title=|code=sts_setu_a}} | 1 |
| 15:00, 18 October 2012 | Volume of sales index, selected retail trade activities, EU-27, 2001-2011 (1) (2005=100)-fr.png (file) | _(2005%3D100)-fr.png) |
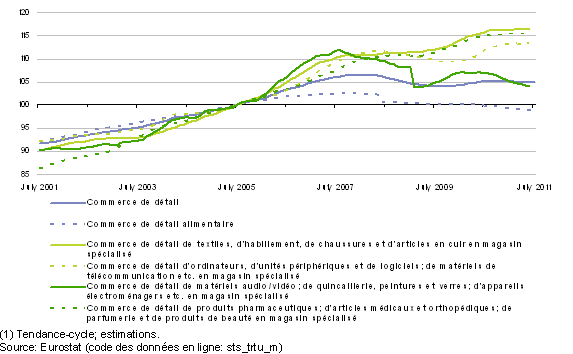
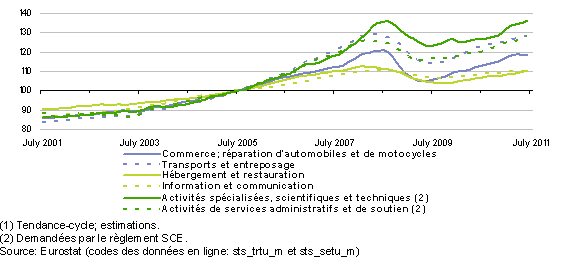
15 KB | Graphique 2: Indice du volume de ventes, sélection d’activités du commerce de détail, UE-27, 2001-2011 (1)<br>(2005=100) - Source: Eurostat {{Stable link|title=|code=sts_trtu_m}} | 1 |
| 14:59, 18 October 2012 | Index of turnover, selected service activities, EU-27, 2001-2011 (1) (2005=100)-fr.png (file) | _(2005%3D100)-fr.png) |
10 KB | Graphique 1: Indice du chiffre d’affaires, sélection d’activités de services, UE-27, 2001-2011 (1)<br>(2005=100) - Source: Eurostat {{Stable link|title=|code=sts_trtu_m}} et {{Stable link|title=|code=sts_setu_m}} | 1 |
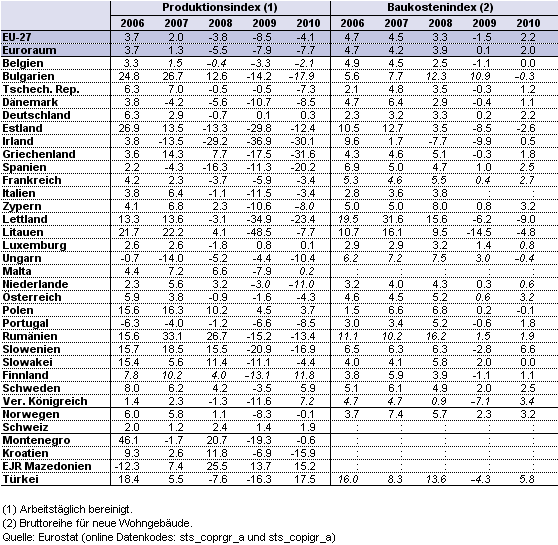
| 10:32, 18 October 2012 | Annual growth rates for construction, 2006-2010 (%)-fr.png (file) | -fr.png) |
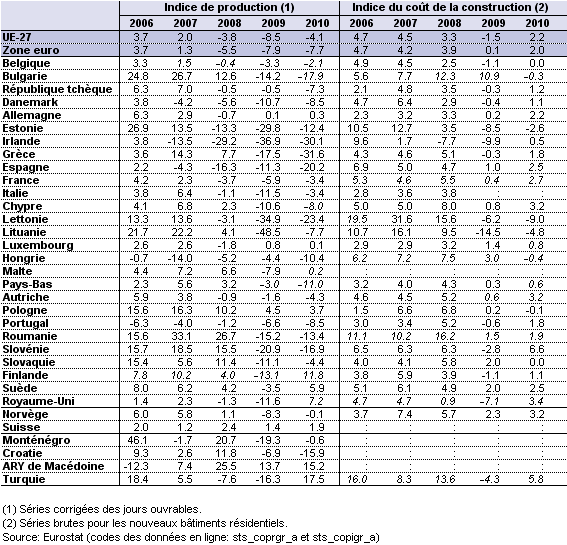
34 KB | Tableau 2: Taux de croissance annuels pour la construction, 2006-2010<br>(en %) - Source: Eurostat {{Stable link|title=|code=sts_coprgr_a}} et {{Stable link|title=|code=sts_copigr_a}} | 1 |
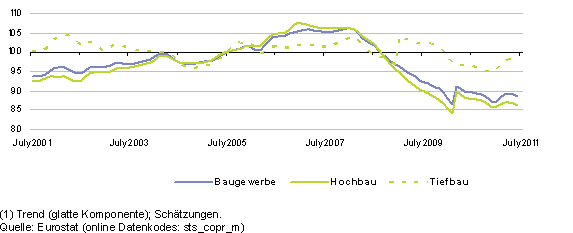
| 10:30, 18 October 2012 | Index of production, construction, EU-27, 2001-2011 (1) (2005=100)-fr.png (file) | _(2005%3D100)-fr.png) |
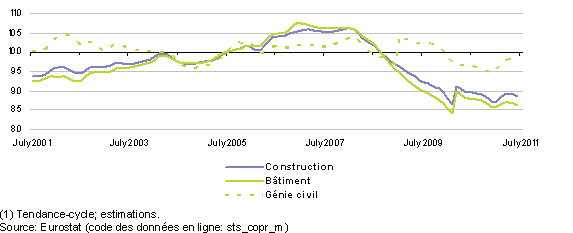
7 KB | Graphique 4: Indice de production, secteur de la construction, UE-27, 2001-2011 (1)<br>(2005=100) - Source: Eurostat {{Stable link|title=|code=sts_copr_m}} | 1 |
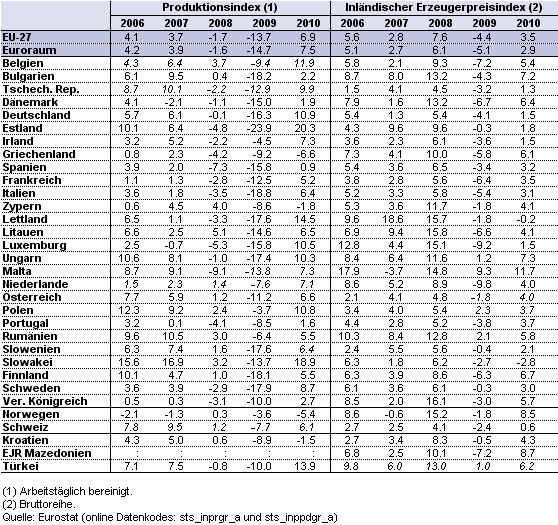
| 10:27, 18 October 2012 | Annual growth rates for industry (excluding construction), 2006-2010 (%)-fr.png (file) | ,_2006-2010_(%25)-fr.png) |
34 KB | Tableau 1: Taux de croissance annuels pour l’industrie (hors construction), 2006-2010<br>(en %) - Source: Eurostat {{Stable link|title=|code=sts_inprgr_a}} et {{Stable link|title=|code=sts_inppdgr_a}} | 1 |
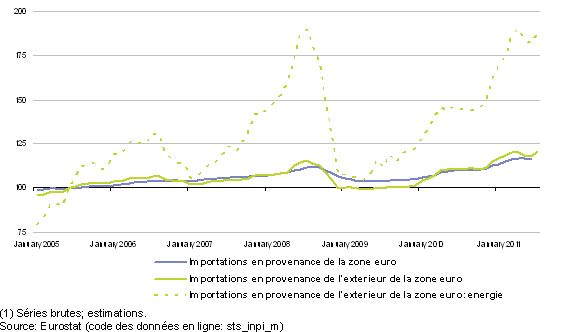
| 10:26, 18 October 2012 | Industrial import price index, euro area, 2005-2011 (1) (2005=100)-fr.png (file) | _(2005%3D100)-fr.png) |
9 KB | Graphique 2: Indice des prix industriels à l’importation, zone euro, 2005-2011 (1)<br>(2005=100) - Source: Eurostat {{Stable link|title=|code=sts_inpi_m}} | 2 |
| 10:23, 18 October 2012 | Production and domestic output price indices for industry (excluding construction), EU-27, 2001-2011 (2005=100)-fr.png (file) | ,_EU-27,_2001-2011_(2005%3D100)-fr.png) |
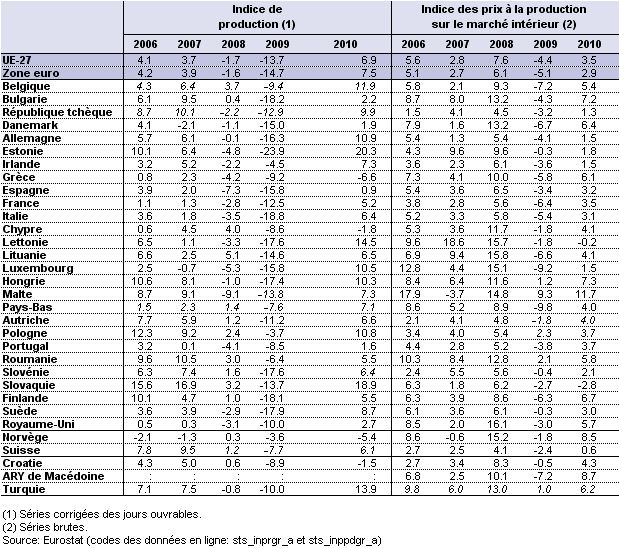
8 KB | Graphique 1: Indice de production et indice des prix à la production sur le marché intérieur, industrie (hors construction), UE-27, 2001-2011<br>(2005=100) - Source: Eurostat {{Stable link|title=|code=sts_inppd_m}} et {{Stable link|title=|code=sts_inpr | 1 |
| 10:19, 18 October 2012 | Annual growth rates for construction, 2006-2010 (%)-de.png (file) | -de.png) |
33 KB | Tabelle 2: Jährliche Wachstumsraten für das Baugewerbe, 2006-2010<br>(in %) – Quelle: Eurostat {{Stable link|title=|code=sts_coprgr_a}} und {{Stable link|title=|code=sts_copigr_a}} | 1 |
| 10:18, 18 October 2012 | Index of production, construction, EU-27, 2001-2011 (1) (2005=100)-de.png (file) | _(2005%3D100)-de.png) |
7 KB | Abbildung 4: Produktionsindex für das Baugewerbe, EU-27, 2001-2011 (1)<br>(2005=100) – Quelle: Eurostat{{Stable link|title=|code=sts_copr_m}} | 1 |
| 10:16, 18 October 2012 | Annual growth rates for industry (excluding construction), 2006-2010 (%)-de.png (file) | ,_2006-2010_(%25)-de.png) |
32 KB | Tabelle 1: Jährliche Wachstumsraten für die Industrie (ohne Baugewerbe), 2006-2010<br>(in %) – Quelle: Eurostat {{Stable link|title=|code=sts_inprgr_a}}und {{Stable link|title=|code=sts_inppdgr_a}} | 1 |
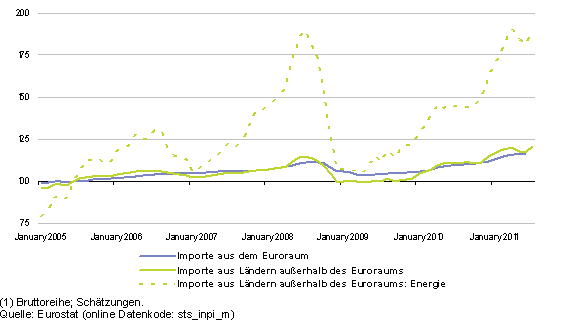
| 10:15, 18 October 2012 | Industrial import price index, euro area, 2005-2011 (1) (2005=100)-de.png (file) | _(2005%3D100)-de.png) |
9 KB | Abbildung 2: Index der industriellen Einfuhrpreise, Euroraum, 2005-2011 (1)<br>(2005=100) – Quelle: Eurostat{{Stable link|title=|code=sts_inpi_m}} | 1 |
| 10:14, 18 October 2012 | Production and domestic output price indices for industry (excluding construction), EU-27, 2001-2011 (2005=100)-de.png (file) | ,_EU-27,_2001-2011_(2005%3D100)-de.png) |
8 KB | Abbildung 1: Indizes der Produktion und der inländischen Erzeugerpreise der Industrie (ohne Baugewerbe), EU-27, 2001-2011<br>(2005 = 100) – Quelle: Eurostat {{Stable link|title=|code=sts_inppd_m}} und {{Stable link|title=|code=sts_inpr_m}} | 1 |
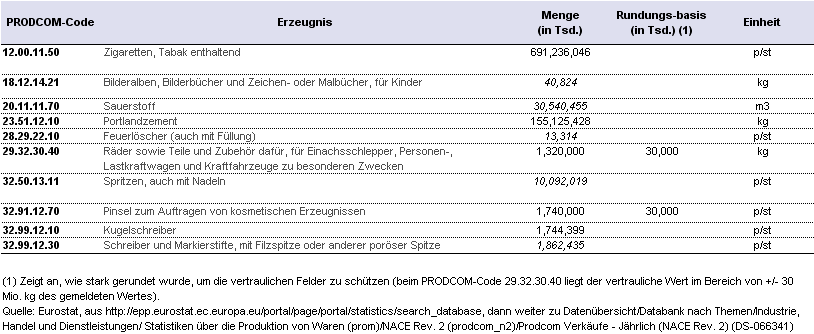
| 12:21, 17 October 2012 | Quantity of production sold, selected products, EU-27, 2010-de.png (file) |  |
22 KB | Tabelle 2: Menge der verkauften Produkte, ausgewählte Erzeugnisse, EU-27, 2010 | 1 |
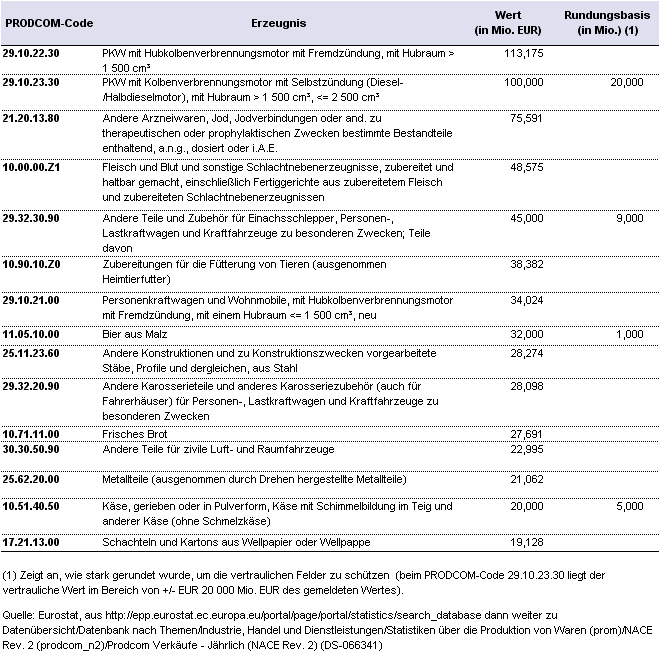
| 12:18, 17 October 2012 | Production sold in value terms, selected products, EU-27, 2010-de.png (file) |  |
35 KB | Tabelle 1: Wert der verkauften Produkte, ausgewählte Erzeugnisse, EU-27, 2010 | 1 |
| 11:02, 17 October 2012 | Enterprise demography, business economy, 2008 (1)-fr.png (file) | -fr.png) |
21 KB | Tableau 10: Démographie des entreprises, économie marchande, 2008 (1) - Source: Eurostat {{Stable link|title=|code=bd_9a_l_form_r2}} | 1 |
| 11:01, 17 October 2012 | Share of value added and employment accounted for by foreign controlled enterprises, non-financial business economy, 2008 (1) (%)-fr.png (file) | _(%25)-fr.png) |
11 KB | Graphique 7: Part de la valeur ajoutée et de l’emploi des entreprises sous contrôle étranger, économie marchande non financière, 2008)<br>(en %) - Source: Eurostat {{Stable link|title=|code=fats_g1a_08}} | 1 |
| 11:01, 17 October 2012 | Value added by enterprise size-class, professional, scientific and technical activities and administrative and support services, 2008 (% share of size class in total sectoral value added)-fr.png (file) | -fr.png) |
34 KB | Tableau 9: Valeur ajoutée par classe de taille d’entreprise, activités spécialisées, scientifiques et techniques et activités de services administratifs et de soutien, 2008<br>(part de la classe de taille dans la valeur ajoutée totale du secteur, | 1 |
| 11:00, 17 October 2012 | Value added by enterprise size-class, information and communication and real estate activities, 2008 (% share of size class in total sectoral value added)-fr.png (file) | -fr.png) |
33 KB | Tableau 8: Valeur ajoutée par classe de taille d’entreprise, information et communication et activités immobilières, 2008<br>(part de la classe de taille dans la valeur ajoutée totale du secteur, en %) - Source: Eurostat {{Stable link|title=|code=sb | 1 |
| 10:59, 17 October 2012 | Value added by enterprise size-class, transport and storage and accomodation and food services, 2008 (% share of size class in total sectoral value added)-fr.png (file) | -fr.png) |
33 KB | Tableau 7: Valeur ajoutée par classe de taille d’entreprise, transports et entreposage et hébergement et restauration, 2008<br>(part de la classe de taille dans la valeur ajoutée totale du secteur, en %) - Source: Eurostat {{Stable link|title=|code=s | 1 |
| 10:58, 17 October 2012 | Value added by enterprise size-class, construction and distributive trades, 2008 (1) (% share of size class in total sectoral value added)-fr.png (file) | _(%25_share_of_size_class_in_total_sectoral_value_added)-fr.png) |
32 KB | Tableau 6: Valeur ajoutée par classe de taille d’entreprise, construction et commerce, 2008 (1)<br>(part de la classe de taille dans la valeur ajoutée totale du secteur, en %) - Source: Eurostat {{Stable link|title=|code=sbs_sc_con_r2}} et {{Stable li | 1 |
| 10:57, 17 October 2012 | Value added by enterprise size-class, electricity, gas, steam and air conditioning supply and water supply, waste and remediation, 2008 (1) (% share of size class in total sectoral value added)-fr.png (file) | _(%25_share_of_size_class_in_total_sectoral_value_added)-fr.png) |
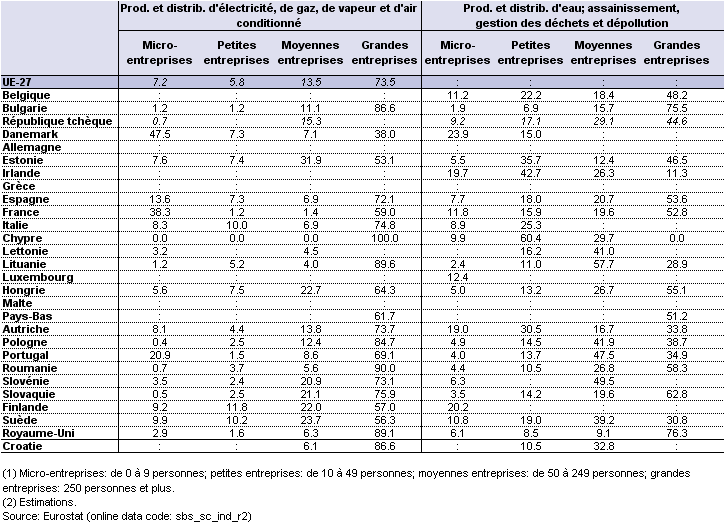
30 KB | Tableau 5: Valeur ajoutée par classe de taille d’entreprise, production et distribution d’électricité, de gaz, de vapeur et d’air conditionné et production et distribution d’eau, assainissement, gestion des déchets et dépollution, 2008 (1)<b | 1 |
| 10:55, 17 October 2012 | Value added by enterprise size class, mining and quarrying and manufacturing, 2008 (1) (% share of size class in total sectoral value added)-fr.png (file) | _(%25_share_of_size_class_in_total_sectoral_value_added)-fr.png) |
31 KB | Tableau 4: Valeur ajoutée par classe de taille d’entreprise, industries extractives et industrie manufacturière, 2008 (1)<br>(part de la classe de taille dans la valeur ajoutée totale du secteur, en %) - Source: Eurostat {{Stable link|title=|code=sbs | 1 |
| 10:53, 17 October 2012 | Employment breakdown by enterprise size class, EU-27, 2008 (1) (% of sectoral total)-fr.png (file) | _(%25_of_sectoral_total)-fr.png) |
15 KB | Graphique 6: Emploi par classe de taille d’entreprise, UE-27, 2008 (1)<br>(en % du total du secteur) - Source: Eurostat {{Stable link|title=|code=sbs_sc_2d_mi02}}, {{Stable link|title=|code=sbs_sc_ind_r2}}, {{Stable link|title=|code=sbs_sc_con_r2}}, {{S | 1 |
| 10:49, 17 October 2012 | Value added breakdown by enterprise size class, EU-27, 2008 (1) (% of sectoral total)-fr.png (file) | _(%25_of_sectoral_total)-fr.png) |
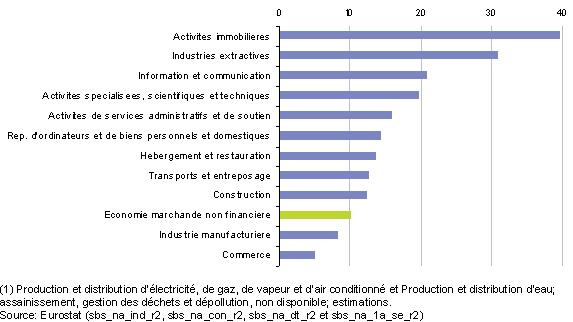
17 KB | Graphique 5: Valeur ajoutée par classe de taille d’entreprise, UE-27, 2008 (1)<br>(en % du total du secteur) - Source: Eurostat {{Stable link|title=|code=sbs_sc_2d_mi02}}, {{Stable link|title=|code=sbs_sc_ind_r2}}, {{Stable link|title=|code=sbs_sc_con_ | 1 |
| 10:48, 17 October 2012 | Gross operating rate within the non-financial business economy, EU-27, 2008 (1) (%)-fr.png (file) | _(%25)-fr.png) |
12 KB | Graphique 4: Taux brut d’exploitation dans l’économie marchande non financière, UE-27, 2008 (1)<br>(en %) - Source: Eurostat {{Stable link|title=|code=sbs_na_ind_r2}}, {{Stable link|title=|code=sbs_na_con_r2}}, {{Stable link|title=|code=sbs_na_dt_r2 | 1 |
| 10:45, 17 October 2012 | Wage adjusted labour productivity within the non-financial business economy, EU-27, 2008 (1) (%)-fr.png (file) | _(%25)-fr.png) |
14 KB | Graphique 3: Taux de productivité de la main-d’œuvre ajustée par les salaires dans l´économie marchande non financière, UE-27, 2008 (1)<br>(en %) - Source: Eurostat {{Stable link|title=|code=sbs_na_ind_r2}}, {{Stable link|title=|code=sbs_na_con_r2 | 1 |
| 10:43, 17 October 2012 | Average personnel costs, 2008 (EUR 1 000 per employee)-fr.png (file) | -fr.png) |
40 KB | Tableau 3: Coût moyen de la main-d’œuvre, 2008<br>(en milliers d’euros par salarié) - Source: Eurostat {{Stable link|title=|code=sbs_na_ind_r2}}, {{Stable link|title=|code=sbs_na_con_r2}}, {{Stable link|title=|code=sbs_na_dt_r2}}et {{St | 1 |
| 10:42, 17 October 2012 | Breakdown of non-financial business economy value added and employment, EU-27, 2008 (1) (% of non-financial business economy value added and employment)-fr.png (file) | _(%25_of_non-financial_business_economy_value_added_and_employment)-fr.png) |
12 KB | Graphique 2: Ventilation de la valeur ajoutée et de l’emploi dans l’économie marchande non financière, UE-27, 2008 (1)<br>(en % de la valeur ajoutée et de l’emploi dans l´économie marchande non financière) - Source: Eurostat {{Stable link|tit | 1 |
| 10:40, 17 October 2012 | Number of persons employed, 2008 (1 000)-fr.png (file) | -fr.png) |
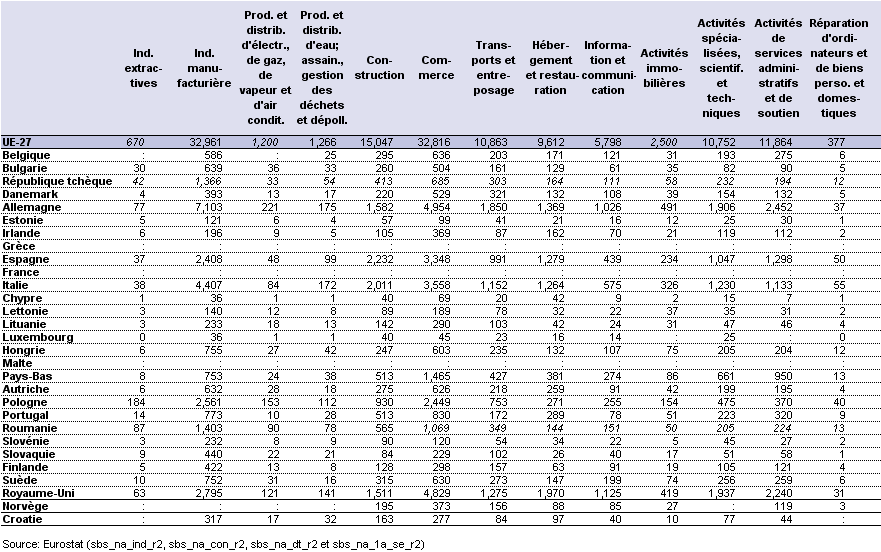
40 KB | Tableau 2: Nombre de personnes occupées, 2008<br>(en milliers) - Source: Eurostat {{Stable link|title=|code=sbs_na_ind_r2}}, {{Stable link|title=|code=sbs_na_con_r2}}, {{Stable link|title=|code=sbs_na_dt_r2}} et {{Stable link|title=|code=sbs_na_1a_ | 1 |
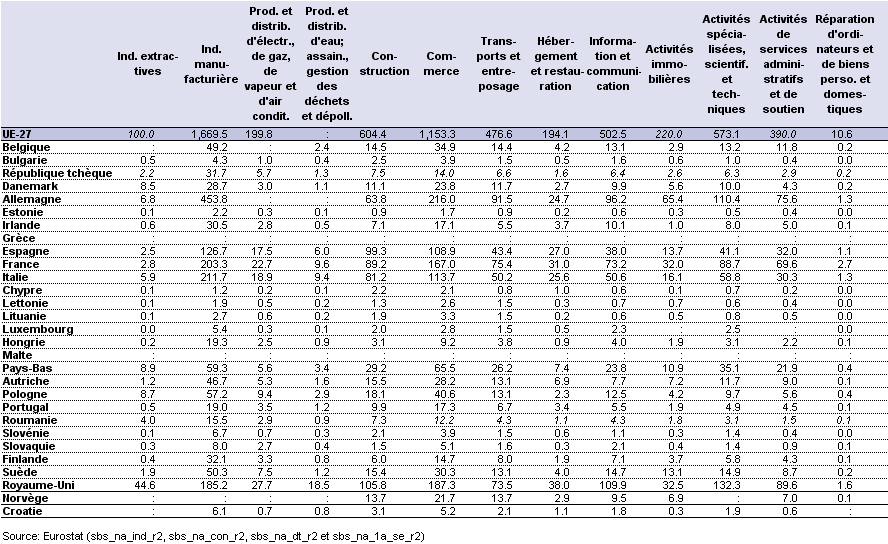
| 10:39, 17 October 2012 | Value added, 2008 (EUR 1 000 million)-fr.png (file) | -fr.png) |
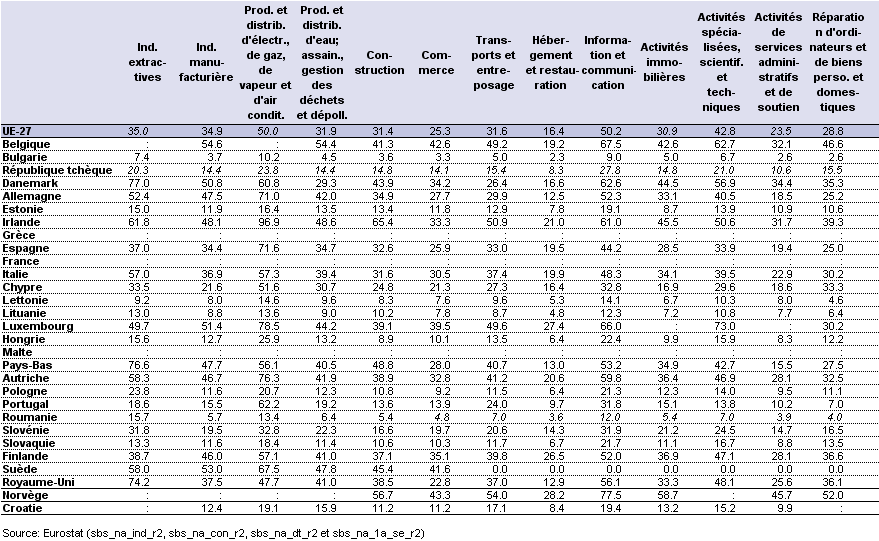
39 KB | Tableau 1: Valeur ajoutée, 2008<br>(en milliards d’euros) - Source: Eurostat {{Stable link|title=|code=sbs_na_ind_r2}}, {{Stable link|title=|code=sbs_na_con_r2}}, {{Stable link|title=|code=sbs_na_dt_r2}} et {{Stable link|title=|code=sbs_na_ | 1 |
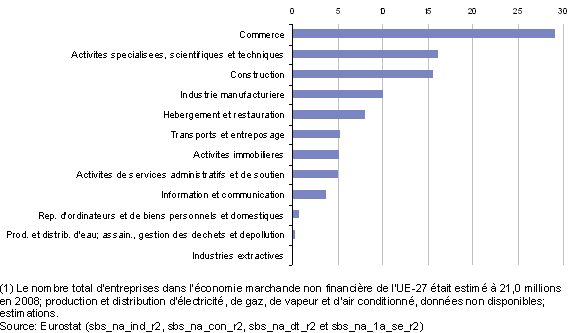
| 10:38, 17 October 2012 | Breakdown of number of enterprises within the non-financial business economy, EU-27, 2008 (1) (%)-fr.png (file) | _(%25)-fr.png) |
12 KB | Graphique 1: Ventilation du nombre d´entreprises dans l’économie marchande non financière, UE-27, 2008 (1)<br>(en %) - Source: Eurostat {{Stable link|title=|code=sbs_na_ind_r2}}, {{Stable link|title=|code=sbs_na_con_r2}}, {{Stable link|title=|code=sb | 1 |
| 10:31, 17 October 2012 | Average personnel costs, 2008 (EUR 1 000 per employee)-de.png (file) | -de.png) |
39 KB | Tabelle 3: Durchschnittliche Personalkosten, 2008<br>(EUR 1 000 je Beschäftigten) – Quelle: Eurostat {{Stable link|title=|code=sbs_na_ind_r2}}, {{Stable link|title=|code=sbs_na_con_r2}}, {{Stable link|title=|code=sbs_na_dt_r2}}und {{Stable li | 1 |
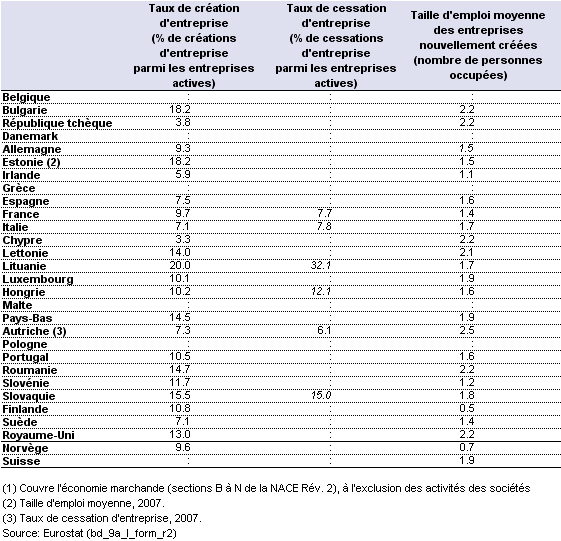
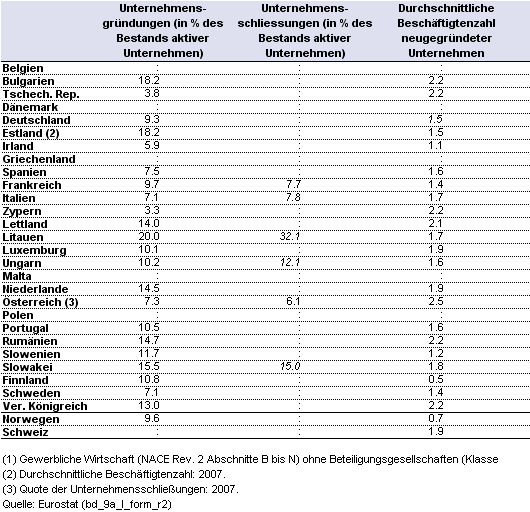
| 10:28, 17 October 2012 | Enterprise demography, business economy, 2008 (1)-de.png (file) | -de.png) |
20 KB | Tabelle 10: Unternehmensdemografie, gewerbliche Wirtschaft, 2008 (1) – Quelle: Eurostat{{Stable link|title=|code=bd_9a_l_form_r2}} | 1 |
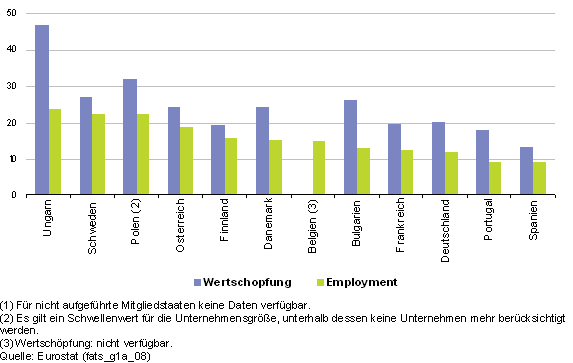
| 10:26, 17 October 2012 | Share of value added and employment accounted for by foreign controlled enterprises, non-financial business economy, 2008 (1) (%)-de.png (file) | _(%25)-de.png) |
11 KB | Abbildung 7: Anteil an Wertschöpfung und Beschäftigung der Unternehmen unter ausländischer Kontrolle im nichtfinanziellen Bereich der gewerblichen Wirtschaft, 2008 (1)<br>(in %) – Quelle: Eurostat{{Stable link|title=|code=fats_g1a_08}} | 1 |
| 10:26, 17 October 2012 | Value added by enterprise size-class, professional, scientific and technical activities and administrative and support services, 2008 (% share of size class in total sectoral value added)-de.png (file) | -de.png) |
30 KB | Tabelle 9: Wertschöpfung nach Größenklassen der Unternehmen, Erbringung von freiberuflichen, wissenschaftlichen und technischen Dienstleistungen sowie Erbringung von sonstigen wirtschaftlichen Dienstleistungen, 2008<br>(in %; Anteil der Größenklasse | 1 |
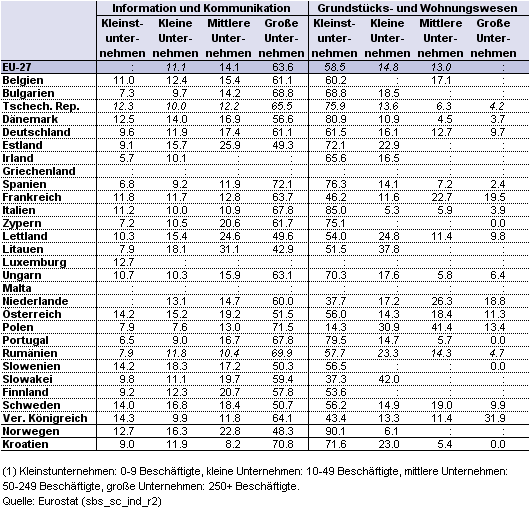
| 10:25, 17 October 2012 | Value added by enterprise size-class, information and communication and real estate activities, 2008 (% share of size class in total sectoral value added)-de.png (file) | -de.png) |
28 KB | Tabelle 8: Wertschöpfung nach Größenklassen der Unternehmen, Information und Kommunikation sowie Grundstücks- und Wohnungswesen, 2008<br>(in %; Anteil der Größenklasse am Gesamtwert der Wertschöpfung des Sektors) – Quelle: Eurostat {{Stable link| | 1 |
| 10:24, 17 October 2012 | Value added by enterprise size-class, transport and storage and accomodation and food services, 2008 (% share of size class in total sectoral value added)-de.png (file) | -de.png) |
29 KB | Tabelle 7: Wertschöpfung nach Größenklassen der Unternehmen, Verkehr und Lagerei sowie Gastgewerbe/Beherbergung und Gastronomie, 2008<br>(in %; Anteil der Größenklasse am Gesamtwert der Wertschöpfung des Sektors) – Quelle: Eurostat {{Stable link|t | 1 |