Uploads by EXT-H-McCormack
This special page shows all uploaded files.
| Date | Name | Thumbnail | Size | Description | Versions |
|---|---|---|---|---|---|
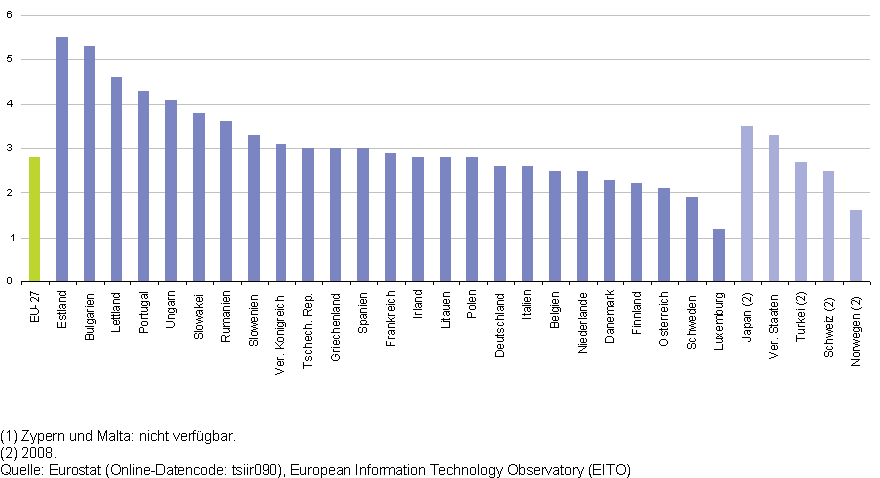
| 17:09, 22 October 2012 | Communications expenditure, 2010 (1) (% of GDP)-de.png (file) | _(%25_of_GDP)-de.png) |
20 KB | Abbildung 1: Ausgaben für Kommunikation, 2010 (1) (in % des BIP) - Quelle: Eurostat {{Stable link|title=|code=tsiir090}}, European Information Technology Observatory (EITO) | 2 |
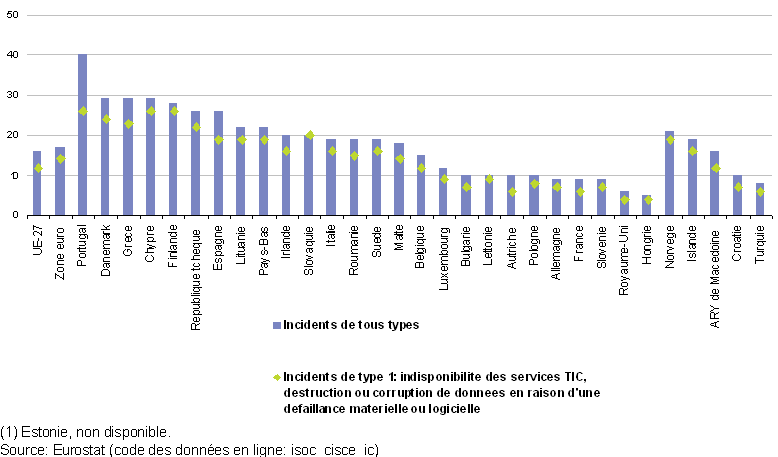
| 12:54, 22 October 2012 | ICT security incidents affecting the ICT systems of enterprises , 2009 (1) (% of enterprises)-fr.png (file) | _(%25_of_enterprises)-fr.png) |
20 KB | Graphique 16: Incidents de sécurité liés aux TIC ayant touché les systèmes de TIC des entreprises, 2009 (1)<br />(en % des entreprises) - Source: Eurostat {{Stable link|title=|code=isoc_cisce_ic}} | 2 |
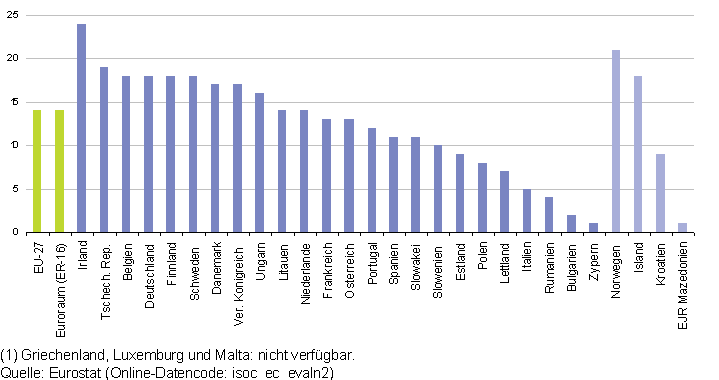
| 12:43, 22 October 2012 | Enterprise turnover from e-commerce, 2009 (1) (% of total turnover)-de.png (file) | _(%25_of_total_turnover)-de.png) |
14 KB | Abbildung 9: Umsatz der Unternehmen aus elektronischem Geschäftsverkehr (E-Commerce), 2009 (1) (in % des Gesamtumsatzes) - Quelle: Eurostat{{Stable link|title=|code=isoc_ec_evaln2}} | 3 |
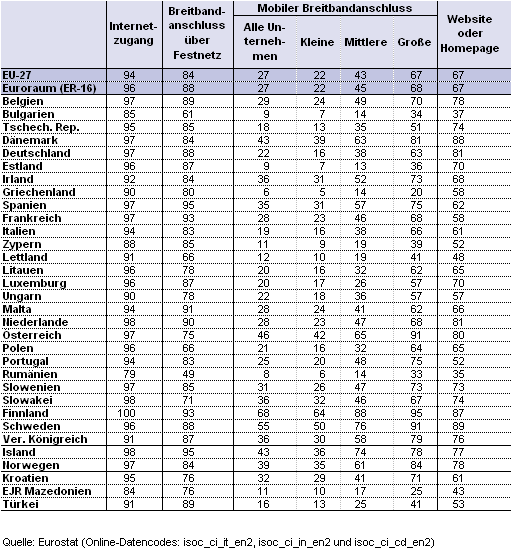
| 12:36, 22 October 2012 | Enterprise use of information technology, January 2010 (% of enterprises)-de.png (file) | -de.png) |
33 KB | Tabelle 3: Nutzung von Informationstechnologie durch Unternehmen, Januar 2010<br />(in % der Unternehmen) - Quelle: Eurostat {{Stable link|title=|code=isoc_ec_evaln2}} | 4 |
| 11:40, 22 October 2012 | Annual growth rate for the industrial index of production, EU-27, 2010 (1) (%)-fr.png (file) | _(%25)-fr.png) |
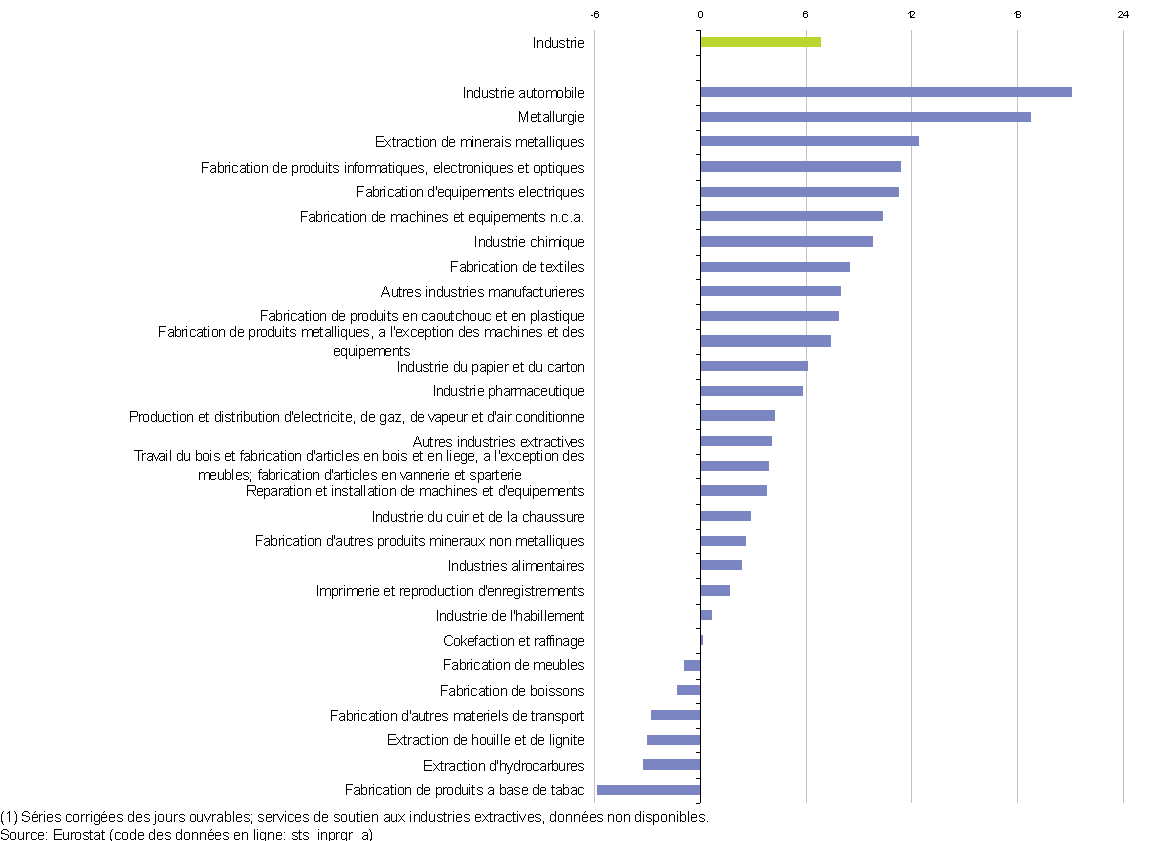
50 KB | Graphique 3: Taux de croissance annuel de l’indice de la production industrielle, UE-27, 2010 (1)<br>(en %) - Source: Eurostat {{Stable link|title=|code=sts_inprgr_a}} | 2 |
| 11:39, 22 October 2012 | Annual growth rate for the industrial index of production, EU-27, 2010 (1) (%)-de.png (file) | _(%25)-de.png) |
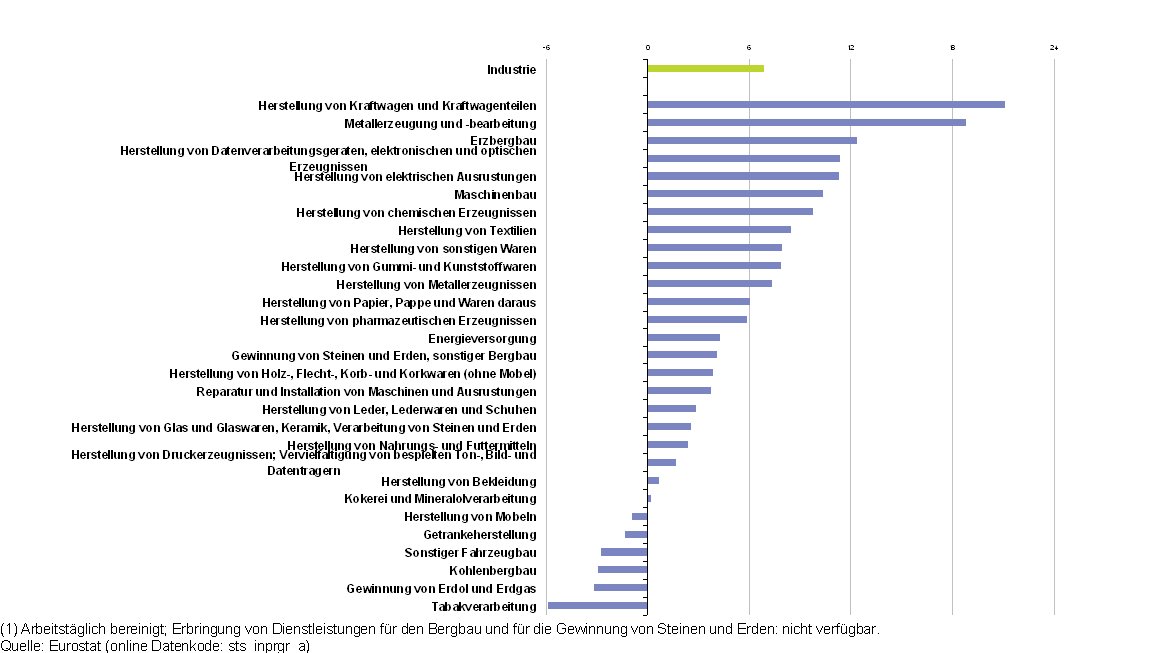
51 KB | Abbildung 3: Jährliche Wachstumsrate für den Produktionsindex der Industrie, EU-27, 2010 (1)<br>(in %) – Quelle: Eurostat{{Stable link|title=|code=sts_inprgr_a}} | 2 |
| 10:51, 18 October 2012 | Pollution taxes by economic activity, 2008 (1) (% of pollution tax revenue)-de.png (file) | _(%25_of_pollution_tax_revenue)-de.png) |
28 KB | Abbildung 7: Steuern auf Umweltverschmutzung nach Wirtschaftstätigkeit, 2008 (1)<br />(in % des Aufkommens bei Steuern auf Umweltverschmutzung) – Quelle: Eurostat{{Stable link|title=|code=env_ac_taxind}} | 2 |
| 16:23, 17 October 2012 | Non-mineral waste generation, 2004-2008 (kg per inhabitant)-fr.png (file) | -fr.png) |
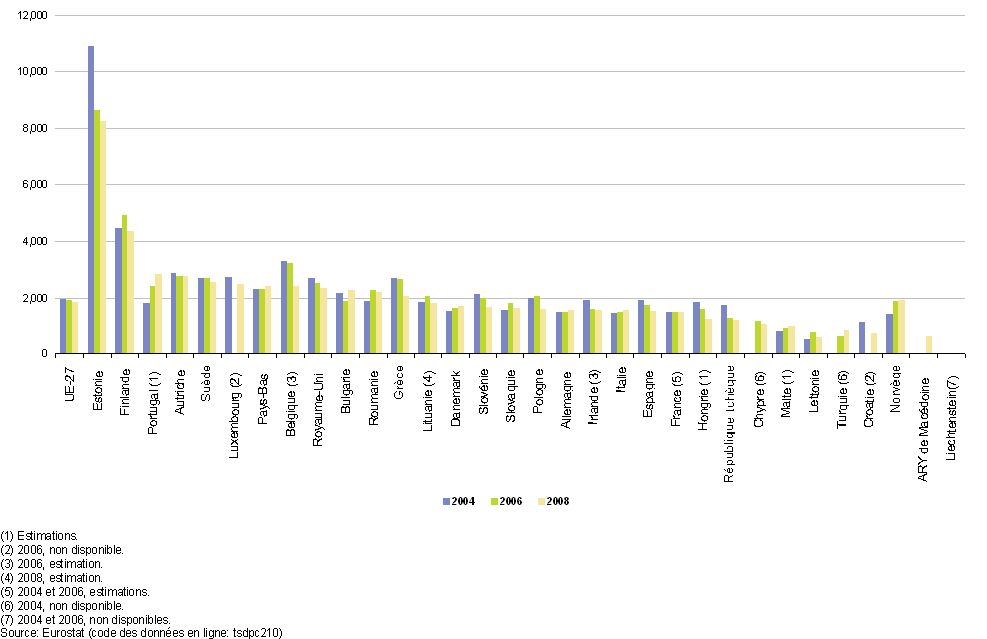
24 KB | Graphique 3: Production de déchets non minéraux, 2004-2008<br />(en kg par habitant) - Source: Eurostat{{Stable link|title=|code=tsdpc210}} | 2 |
| 16:04, 17 October 2012 | Non-mineral waste generation, EU-27, 2004-2008 (1) (million tonnes)-de.png (file) | _(million_tonnes)-de.png) |
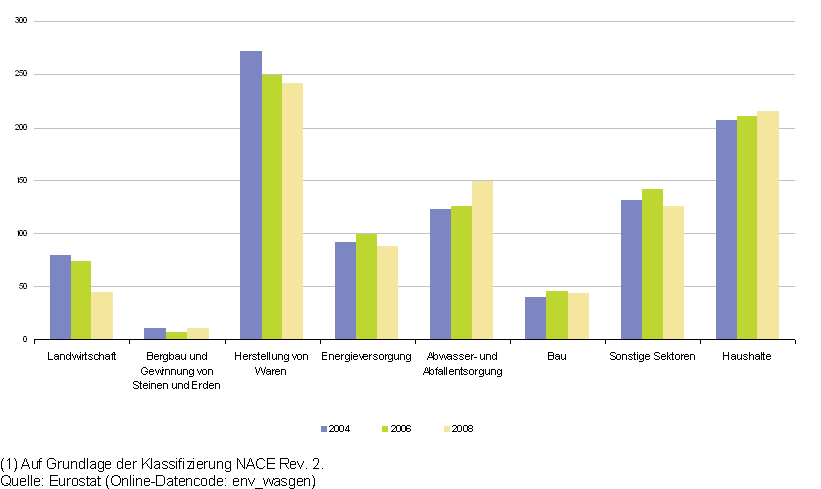
16 KB | Abbildung 4: Aufkommen nicht-mineralischer Abfälle, EU-27, 2004-2008 (1)<br />(in Mio. Tonnen) – Quelle: Eurostat {{Stable link|title=|code=env_wasgen}} | 3 |
| 15:58, 17 October 2012 | Landfilled waste, EU-27, 2008 (%)-de.png (file) | -de.png) |
13 KB | Abbildung 8: Deponierte Abfälle, EU-27, 2008<br />(in %) – Quelle: Eurostat{{Stable link|title=|code=env_wastrt}} | 2 |
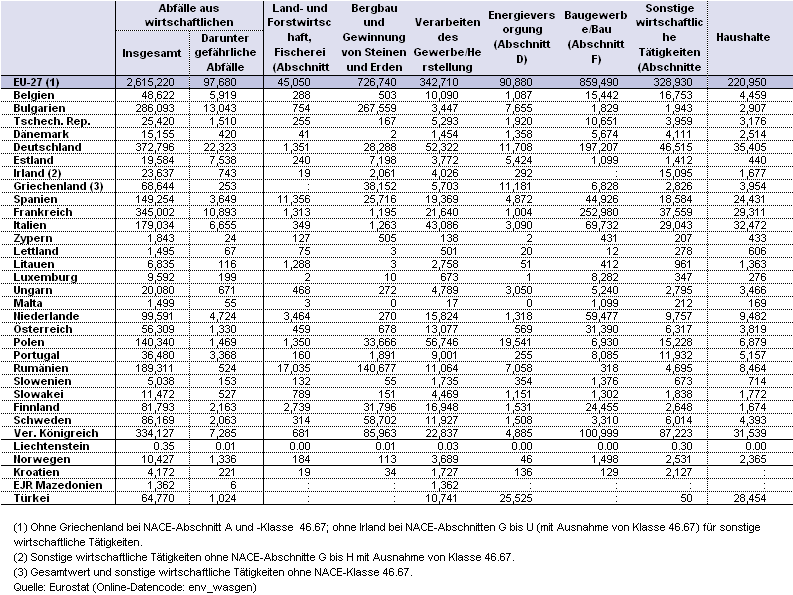
| 15:54, 17 October 2012 | Waste generation, 2008 (1 000 tonnes)-de.png (file) | -de.png) |
51 KB | Tabelle 1: Abfallaufkommen, 2008<br />(in Tsd. Tonnen) – Quelle: Eurostat{{Stable link|title=|code=env_wasgen}} | 2 |
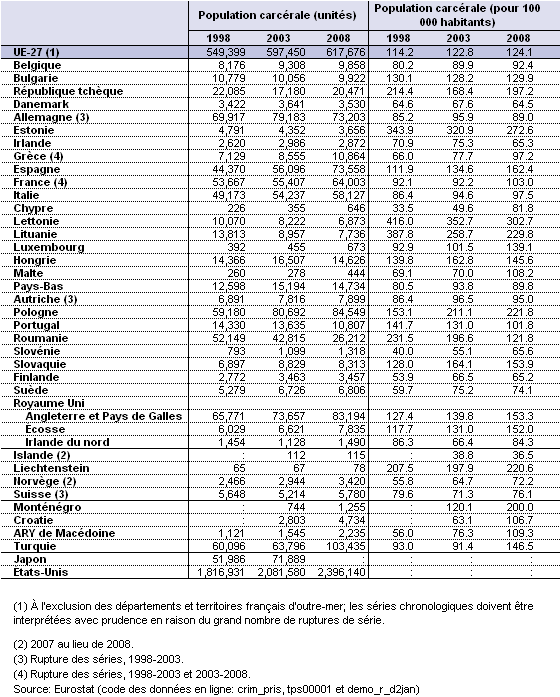
| 17:34, 8 October 2012 | Prison population, 1998-2008-fr.png (file) |  |
42 KB | Tableau 3: Population carcérale, 1998-2008 - Source Eurostat {{Stable link|title=|code=crim_pris}}, {{Stable link|title=|code=tps00001}} et {{Stable link|title=|code=demo_r_d2jan}} | 3 |
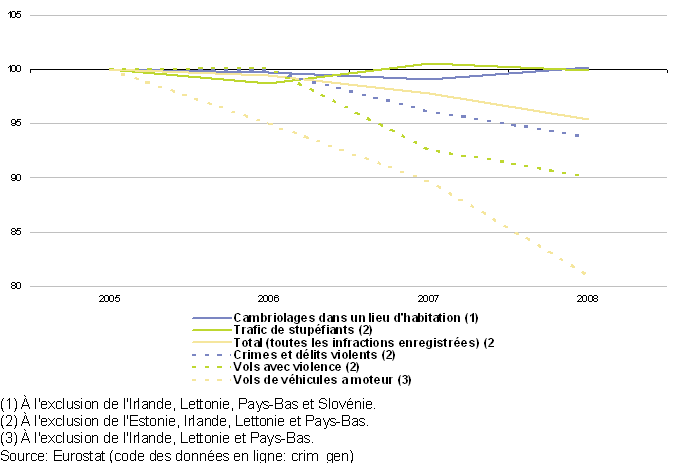
| 17:30, 8 October 2012 | Offences recorded by the police, EU-27, 2005-2008 (2005=100)-fr.png (file) | -fr.png) |
16 KB | Graphique 1: Infractions enregistrées par la police, UE-27, 2005-2008<br />(2005=100) - Source: Eurostat {{Stable link|title=|code=crim_gen}} | 2 |
| 17:30, 8 October 2012 | Crimes recorded by the police, 1998-2008 (1 000)-fr.png (file) | -fr.png) |
42 KB | Tableau 2: Infractions enregistrées par la police, 1998-2008<br />(en milliers) - Source: Eurostat {{Stable link|title=|code=crim_gen}} | 2 |
| 17:29, 8 October 2012 | Police officers, 1998-2008-fr.png (file) |  |
43 KB | Tableau 1: Officiers de police, 1998-2008 - Source Eurostat {{Stable link|title=|code=crim_plce}}, {{Stable link|title=|code=tps00001}} et {{Stable link|title=|code=demo_r_d2jan}} | 2 |
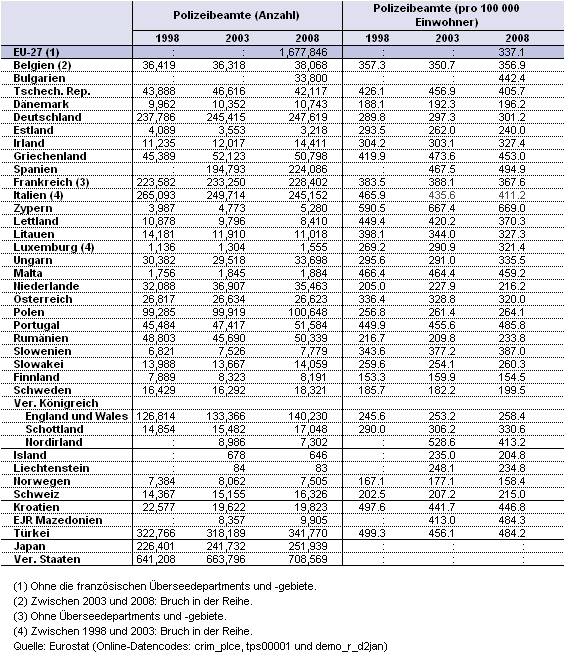
| 17:04, 8 October 2012 | Police officers, 1998-2008-de.png (file) |  |
41 KB | Tabelle 1: Polizeibeamte, 1998-2008 - Quelle: Eurostat {{Stable link|title=|code=crim_plce}}, {{Stable link|title=|code=tps00001}} und {{Stable link|title=|code=demo_r_d2jan}} | 3 |
| 16:22, 8 October 2012 | Expenditure on social protection per inhabitant, 2008 (PPS)-fr.png (file) | -fr.png) |
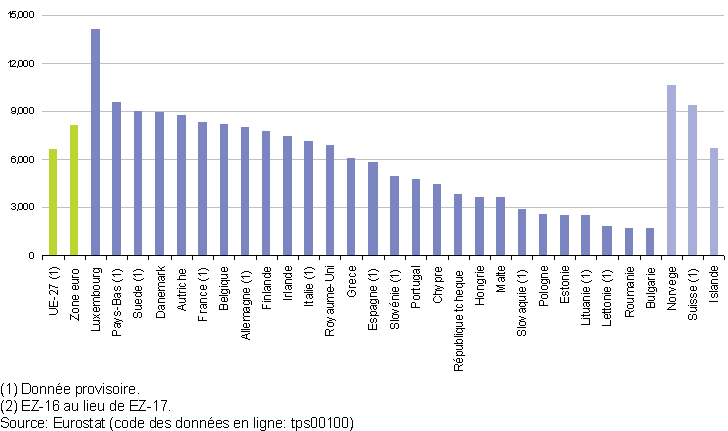
16 KB | Graphique 1: Dépenses de protection sociale par habitant, 2008<br> (en SPA) - Source: Eurostat {{Stable link|title=|code=tps00100}} | 4 |
| 16:24, 3 October 2012 | Headline sustainable development indicators and progress being made within the EU-fr.png (file) |  |
45 KB | Tableau 2: Indicateurs clés de développement durable et progrès réalisés dans l’UE | 1 |
| 16:23, 3 October 2012 | Framework for sustainable development indicators-fr.png (file) |  |
25 KB | Tableau 1: Cadre de référence pour les indicateurs de développement durable | 1 |
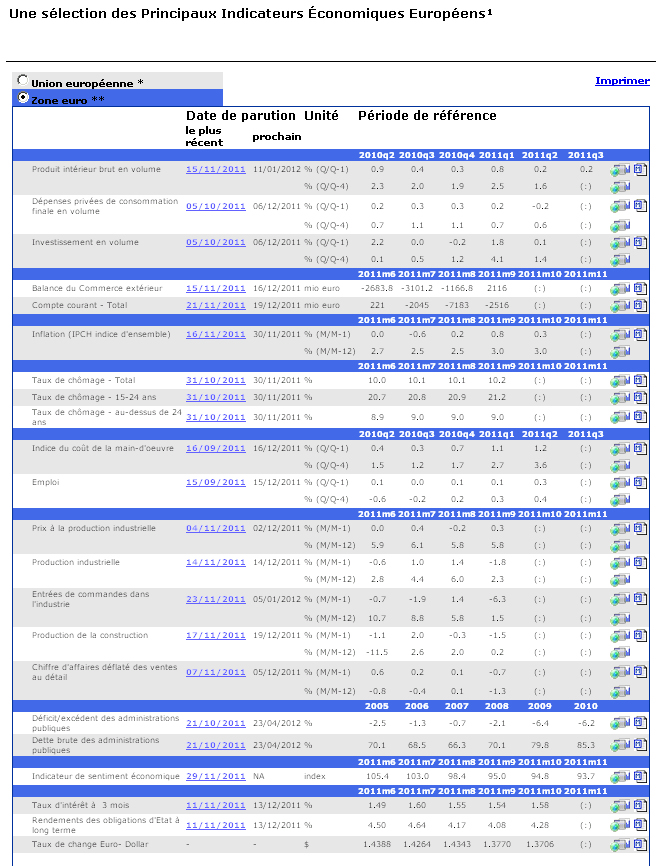
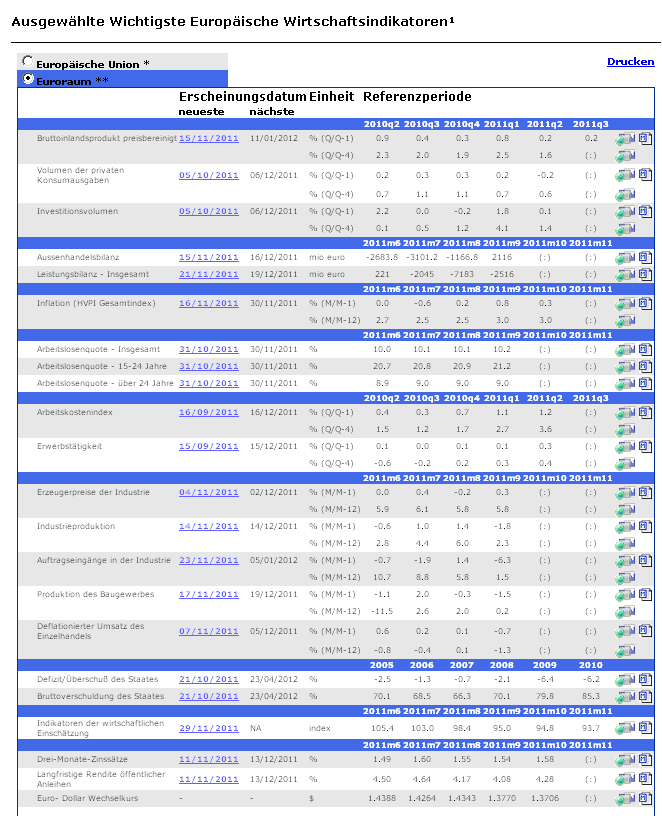
| 16:15, 3 October 2012 | PEEI FR.jpg (file) |  |
416 KB | 1 | |
| 15:43, 3 October 2012 | Headline sustainable development indicators and progress being made within the EU-de.png (file) |  |
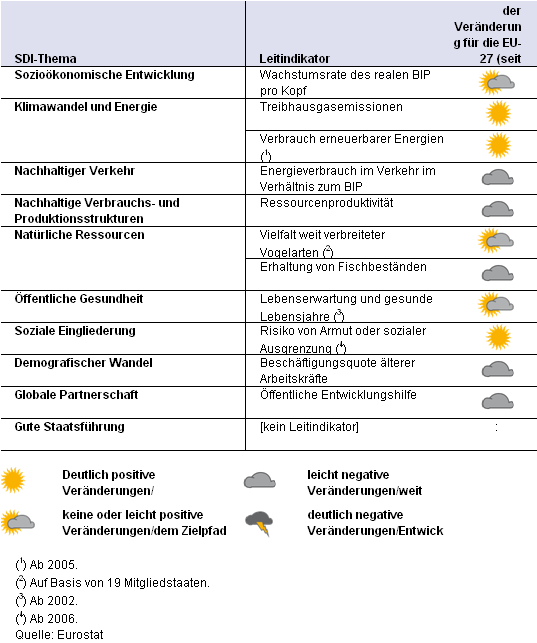
43 KB | Tabelle 2: Leitindikatoren für nachhaltige Entwicklung und Fortschritte in der EU | 1 |
| 15:42, 3 October 2012 | Framework for sustainable development indicators-de.png (file) |  |
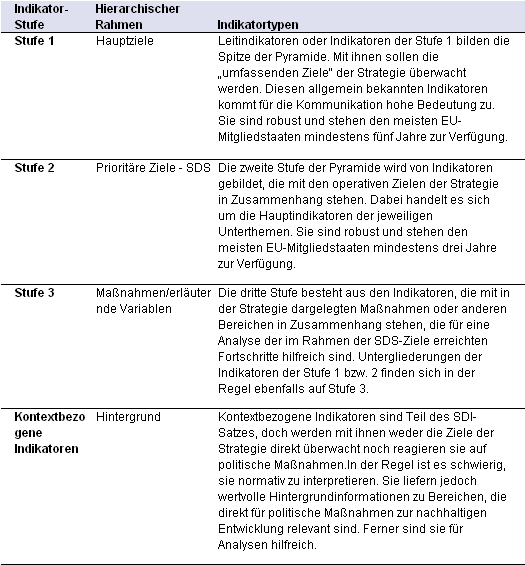
26 KB | Tabelle 1: Indikatoren für nachhaltige Entwicklung – Rahmen | 2 |
| 15:36, 3 October 2012 | PEEI DE.jpg (file) |  |
425 KB | 1 | |
| 14:37, 3 October 2012 | SEARCH FR.JPG (file) | 2 KB | 1 | ||
| 14:20, 3 October 2012 | SEARCH DE.JPG (file) | 2 KB | 1 | ||
| 14:18, 3 October 2012 | 0.7 SEARCH DE.JPG (file) | 2 KB | 1 | ||
| 16:10, 2 October 2012 | Trade in services, EU-27, 2009 (% share of extra EU-27 transactions)-fr.png (file) | -fr.png) |
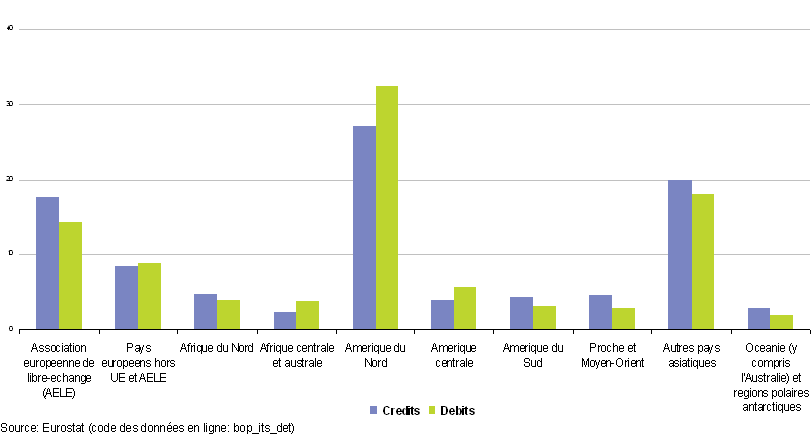
15 KB | Graphique 1: Commerce de services, UE-27, 2009<br>(en % des crédits et des débits extra-UE-27) - Source: Eurostat {{Stable link|title=|code=bop_its_det}} | 2 |
| 15:52, 2 October 2012 | Trade in services, EU-27, 2009 (% share of extra EU-27 transactions)-de.png (file) | -de.png) |
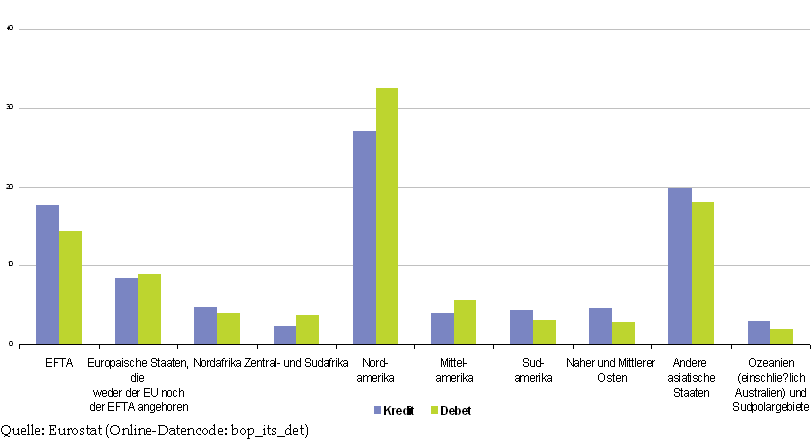
15 KB | Abbildung 1: Dienstleistungsverkehr, EU-27, 2009<br>(Anteil an den Extra-EU-27-Transaktionen in %) – Quelle: Eurostat {{Stable link|title=|code=bop_its_det}} | 3 |
| 15:23, 2 October 2012 | Main imports, EU-27, 2005 and 2010 (% share of extra EU-27 imports)-de.png (file) | -de.png) |
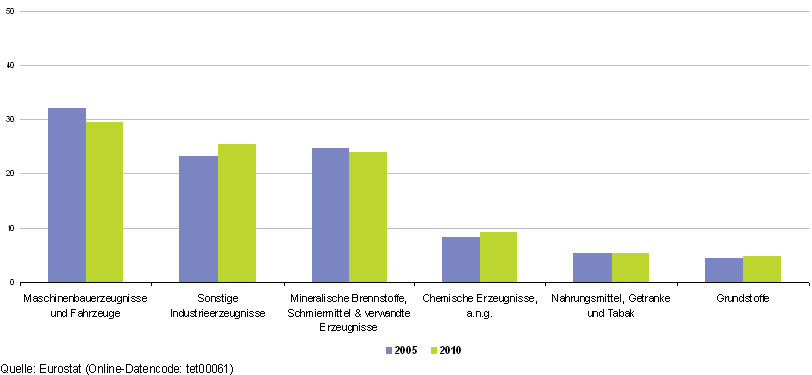
11 KB | Abbildung 9: Wichtigste Einfuhrwaren, EU-27, 2005 und 2010<br />(Anteil an den Extra-EU-27-Einfuhren in %) – Quelle: Eurostat {{Stable link|title=|code=tet00061}} | 3 |
| 15:23, 2 October 2012 | Main exports, EU-27, 2005 and 2010 (% share of extra EU-27 exports)-de.png (file) | -de.png) |
12 KB | Abbildung 8: Wichtigste Ausfuhren, EU-27, 2005 und 2010<br />(Anteil an den Extra-EU-27-Ausfuhren in %) – Quelle: Eurostat {{Stable link|title=|code=tet00061}} | 3 |
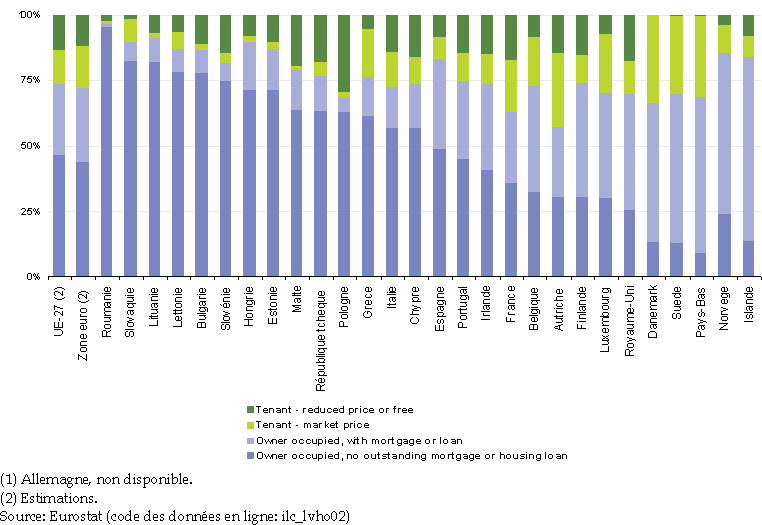
| 14:39, 2 October 2012 | Population by tenure status, 2009 (1) (% of population)-fr.png (file) | _(%25_of_population)-fr.png) |
26 KB | Reverted to version as of 11:44, 2 October 2012 | 3 |
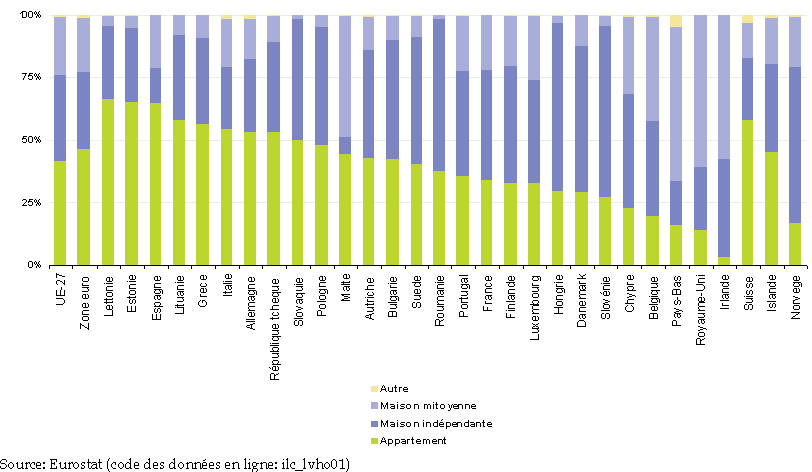
| 14:38, 2 October 2012 | Distribution of population by dwelling type, 2009 (% of population)-fr.png (file) | -fr.png) |
25 KB | Graphique 1: Répartition de la population par type de logement, 2009<br> (en % de la population) - Source: Eurostat {{Stable link|title=|code=ilc_lvho01}} | 3 |
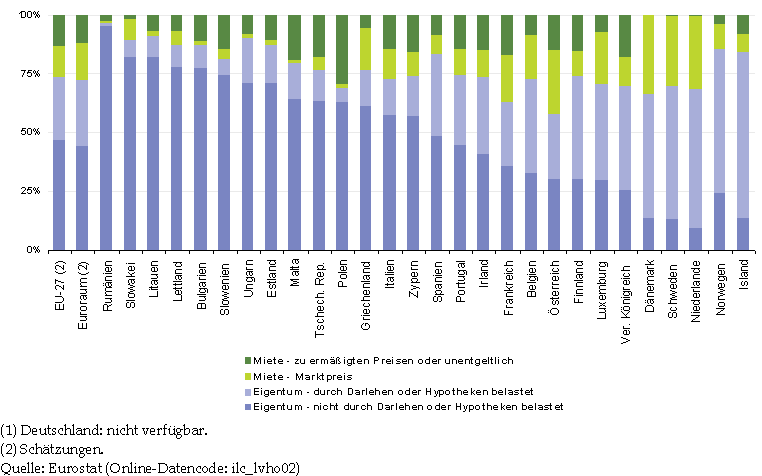
| 13:45, 2 October 2012 | Population by tenure status, 2009 (1) (% of population)-de.png (file) | _(%25_of_population)-de.png) |
26 KB | Abbildung 2: Bevölkerung nach Wohnbesitzverhältnissen, 2009 (1)<br>(in % der Bevölkerung) - Quelle: Eurostat {{Stable link|title=|code=ilc_lvho02}} | 1 |
| 12:11, 2 October 2012 | Material deprivation rate - proportion of persons who cannot afford to pay for selected items, 2009 (1) (%)-de.png (file) | _(%25)-de.png) |
18 KB | Abbildung 4: Quote der materiellen Entbehrung – Anteil von Personen, die sich bestimmte Waren nicht leisten können, 2009 (1)<BR>(in %) - Quelle: Eurostat {{Stable link|title=|code=ilc_sip8}} | 2 |
| 16:54, 18 September 2012 | Gross domestic expenditure on R&D by sector, 2004 and 2009 (% share of GDP)-fr.png (file) | -fr.png) |
35 KB | Tableau 2: Dépenses intérieures brutes de R & D par secteur, 2004 et 2009<br>(en % du PIB) - Source: Eurostat, {{Stable link|title=|code=tsc00001}}, OCDE | 2 |
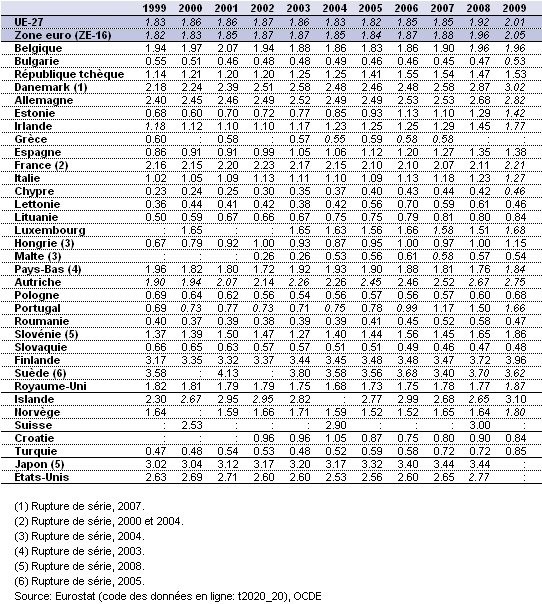
| 16:53, 18 September 2012 | Gross domestic expenditure on R&D, 1999-2009 (% share of GDP)-fr.png (file) | -fr.png) |
34 KB | Tableau 1: Dépenses intérieures brutes de R & D, 1999-2009<br>(en % du PIB) - Source: Eurostat, {{Stable link|title=|code=t2020_20}}, OCDE | 2 |
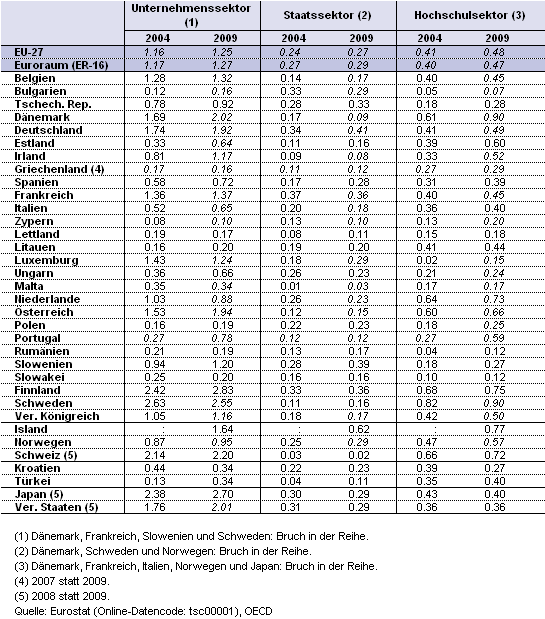
| 16:52, 18 September 2012 | Gross domestic expenditure on R&D by sector, 2004 and 2009 (% share of GDP)-de.png (file) | -de.png) |
35 KB | Tabelle 2: Bruttoinlandsaufwendungen für FuE nach Sektoren, 2004 und 2009<br>(in % des BIP) – Quelle: Eurostat {{Stable link|title=|code=t2020_20}}, OECD | 2 |
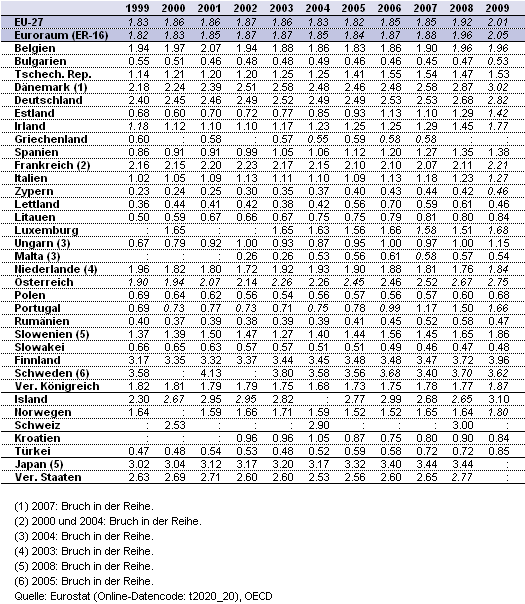
| 16:51, 18 September 2012 | Gross domestic expenditure on R&D, 1999-2009 (% share of GDP)-de.png (file) | -de.png) |
34 KB | Tabelle 1: Bruttoinlandsaufwendungen für FuE, 1999-2009<br>(in % des BIP) – Quelle: Eurostat {{Stable link|title=|code=t2020_20}}, OECD | 2 |
| 12:43, 12 September 2012 | EU patent citations (EPO), 1997-2007 (number)-fr.png (file) | ,_1997-2007_(number)-fr.png) |
15 KB | Graphique 3: Citations des brevets UE (OEB) en fonction du pays de résidence des inventeurs, 1997-2007<br>(en nombre) - Source: Eurostat {{Stable link|title=|code=pat_ep_cti}} | 1 |
| 12:42, 12 September 2012 | Co-patenting at the EPO according to inventors' country of residence, 2008 (1) (% of total)-fr.png (file) | _(%25_of_total)-fr.png) |
15 KB | Graphique 2: Coopération en matière de brevets déposés auprès de l’OEB en fonction du pays de résidence des inventeurs, 2008 (1)<br>(en % du total) - Source: Eurostat {{Stable link|title=|code=pat_ep_cpi}} | 1 |
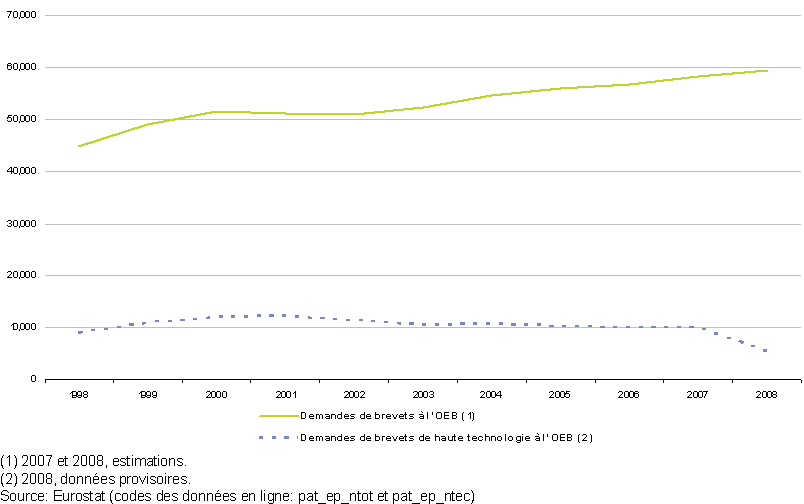
| 12:42, 12 September 2012 | Patent applications to the EPO, EU-27, 1998-2008 (number of patent applications)-fr.png (file) | -fr.png) |
12 KB | Graphique 1: Demandes de brevets déposées à l’OEB, UE-27, 1998-2008<br>(nombre de demandes) - Source: Eurostat {{Stable link|title=|code=pat_ep_ntot}} et {{Stable link|title=|code=pat_ep_ntec}} | 1 |
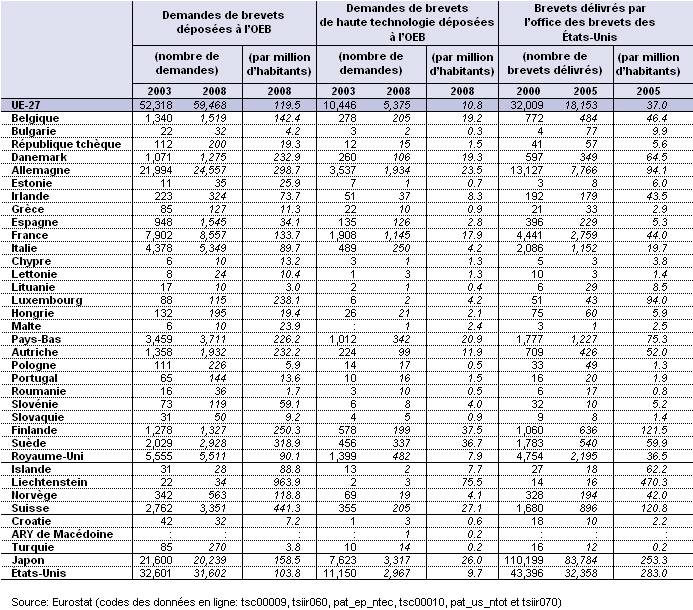
| 12:41, 12 September 2012 | Patent applications to the EPO and patents granted by the USPTO, 2000-2008-fr.png (file) |  |
47 KB | Tableau 1: Demandes de brevets déposées à l’OEB et brevets délivrés par l’USPTO, 2000-2008 - Source: Eurostat {{Stable link|title=|code=tsc00009}}, {{Stable link|title=|code=tsiir060}}, {{Stable link|title=|code=pat_ep_ntec}}, {{Stable link|title | 1 |
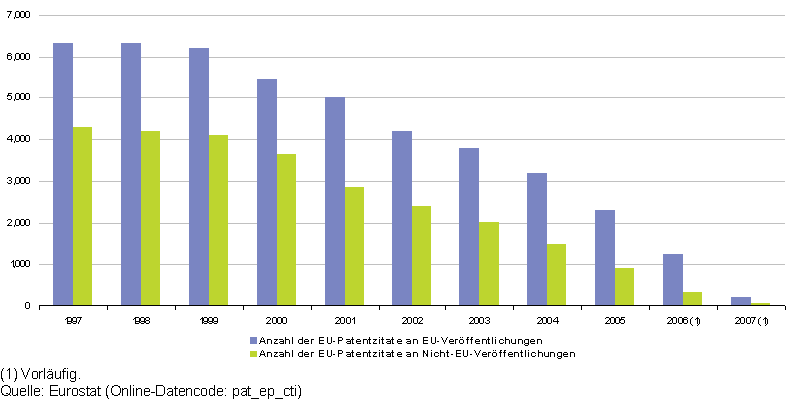
| 12:39, 12 September 2012 | EU patent citations (EPO), 1997-2007 (number)-de.png (file) | ,_1997-2007_(number)-de.png) |
14 KB | Abbildung 3: EU-Patentzitate (EPA), 1997-2007<br>(Anzahl) – Quelle: Eurostat {{Stable link|title=|code=pat_ep_cti}} | 1 |
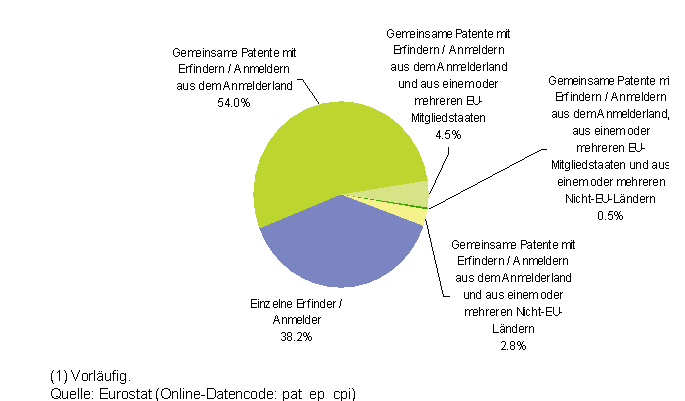
| 12:38, 12 September 2012 | Co-patenting at the EPO according to inventors' country of residence, 2008 (1) (% of total)-de.png (file) | _(%25_of_total)-de.png) |
16 KB | Abbildung 2: Zusammenarbeit an beim EPA angemeldeten Patenten nach Wohnsitzland der Erfinder, 2008 (1)<br>(in % der Patentanmeldungen insgesamt) – Quelle: Eurostat {{Stable link|title=|code=pat_ep_cpi}} | 1 |
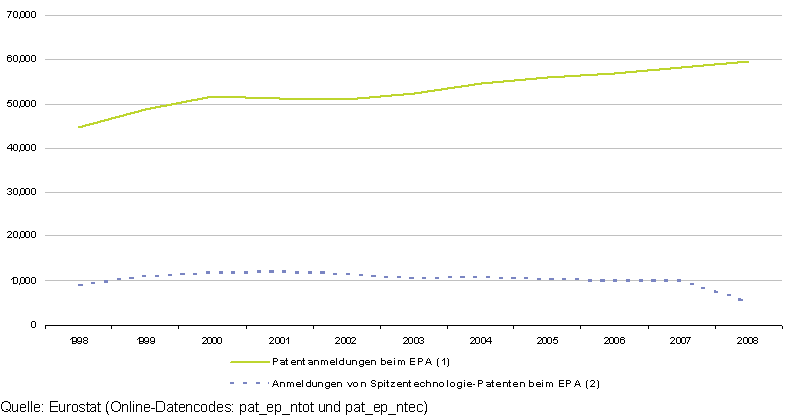
| 12:38, 12 September 2012 | Patent applications to the EPO, EU-27, 1998-2008 (number of patent applications)-de.png (file) | -de.png) |
10 KB | Abbildung 1: Patentanmeldungen beim EPA, EU-27, 1998-2008<br>(Zahl der Patentanmeldungen) – Quelle: Eurostat {{Stable link|title=|code=pat_ep_ntot}} und {{Stable link|title=|code=pat_ep_ntec}} | 1 |
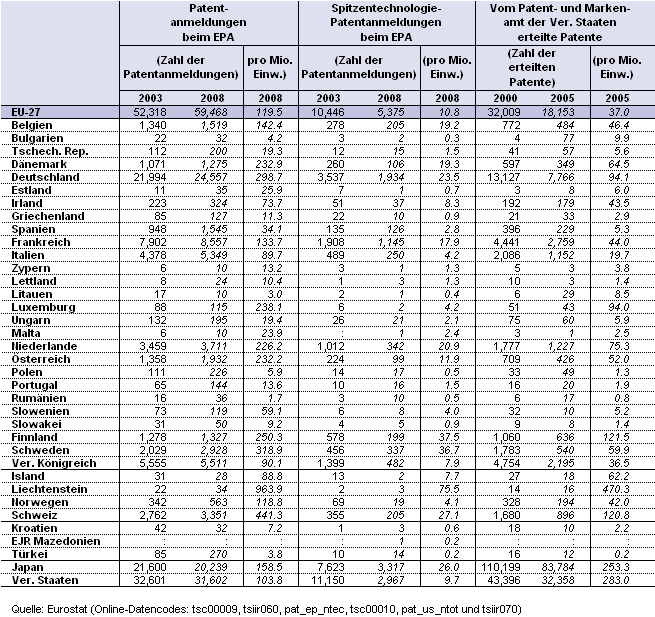
| 12:37, 12 September 2012 | Patent applications to the EPO and patents granted by the USPTO, 2000-2008-de.png (file) |  |
47 KB | Tabelle 1: Patentanmeldungen beim EPA und vom USPTO erteilte Patente, 2000-2008 – Quelle: Eurostat {{Stable link|title=|code=tsc00009}}, {{Stable link|title=|code=tsiir060}}, {{Stable link|title=|code=pat_ep_ntec}}, {{Stable link|title=|code=tsc00010}}, | 1 |
| 09:28, 12 September 2012 | Motivation to introduce environmental innovations – proportion of innovative enterprises reporting specified motivations, 2008 (% of innovative enterprises)-fr.png (file) | -fr.png) |
27 KB | Tableau 4: Motivation pour introduire des innovations environnementales - proportion d’entreprises innovantes ayant indiqué des motivations particulières, 2008<br>(en % du nombre d’entreprises innovantes) - Source: Eurostat {{Stable link|title=|code | 1 |
| 09:27, 12 September 2012 | Proportion of innovative enterprises introducing innovations with reduced energy use, 2008 (% of innovative enterprises)-fr.png (file) | -fr.png) |
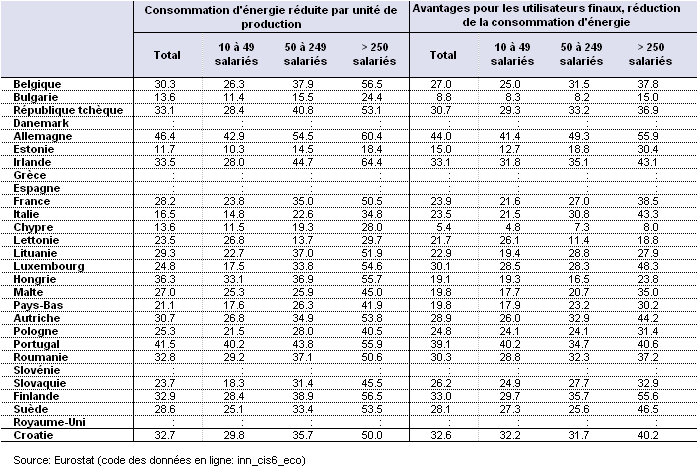
29 KB | Tableau 3: Proportion d’entreprises innovantes qui ont introduit des innovations permettant une réduction de la consommation d’énergie, 2008<br>(en % du nombre d’entreprises innovantes) - Source: Eurostat {{Stable link|title=|code=inn_cis6_eco}} | 1 |
| 09:27, 12 September 2012 | Innovations with environmental benefits – proportion of innovative enterprises introducing innovations with specified benefits, 2008 (% of innovative enterprises)-fr.png (file) | -fr.png) |
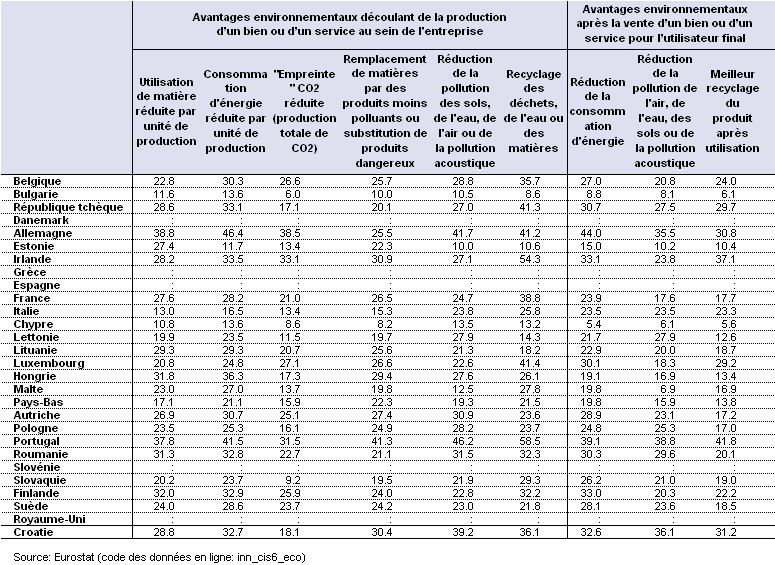
39 KB | Tableau 2: Innovations présentant des avantages pour l’environnement – proportion d’entreprises innovantes qui ont introduit des innovations présentant des avantages particuliers, 2008<br>(en % du nombre d’entreprises innovantes) - Source: Euros | 1 |
| 09:26, 12 September 2012 | Proportion of innovative enterprises which introduced products new to the market or own-developed process innovations, 2008 (% of enterprises within size class or total)-fr.png (file) | -fr.png) |
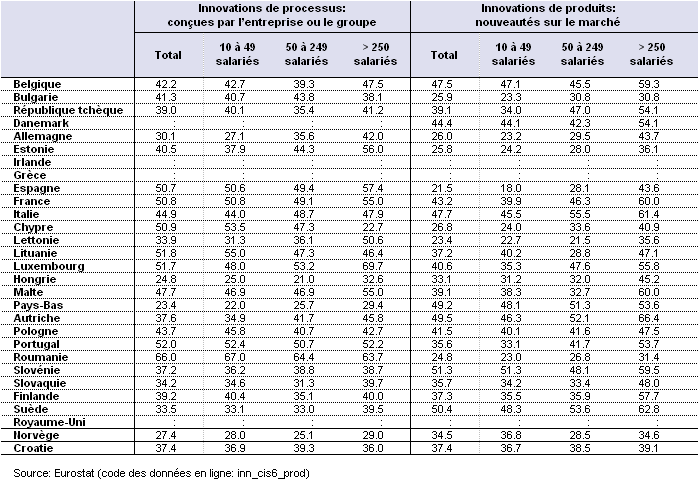
31 KB | Tableau 1: Proportion d’entreprises innovantes qui ont commercialisé des produits inédits ou adopté des processus innovants qu’elles ont elles-mêmes développés, 2008<br>(en % des entreprises innovantes de la classe de taille ou du total) - Sourc | 1 |