Tutorials
Log in
Statistics Explained
menu
search
search
Navigation
Main page
Statistical themes
Glossary
Categories
Statistics 4 beginners
Tutorials
Help
Eurostat home
Education corner
Online publications
Regional yearbook
Sustainable development
Full list
Tools
User contributions
Logs
View user groups
Special pages
search
Navigation
Main page
Statistical themes
Glossary
Categories
Statistics 4 beginners
Tutorials
Help
Eurostat home
Education corner
Online publications
Regional yearbook
Sustainable development
Full list
Tools
User contributions
Logs
View user groups
Special pages
Navigation
Main page
Statistical themes
Glossary
Categories
Statistics 4 beginners
Tutorials
Help
Eurostat home
Education corner
Online publications
Regional yearbook
Sustainable development
Full list
Tools
User contributions
Logs
View user groups
Special pages
Uploads by EXT-A-Desurmont
This special page shows all uploaded files.
File list
Items per page:
20
50
100
250
500
Search for media name:
Username:
Include old versions of files
Go
First page
Previous page
Next page
Last page
Date
Name
Thumbnail
Size
Description
Versions
13:50, 10 April 2015
Relation between outward mob rate and diversity of countries 2011 2012.PNG
(
file
)
38 KB
4
13:50, 10 April 2015
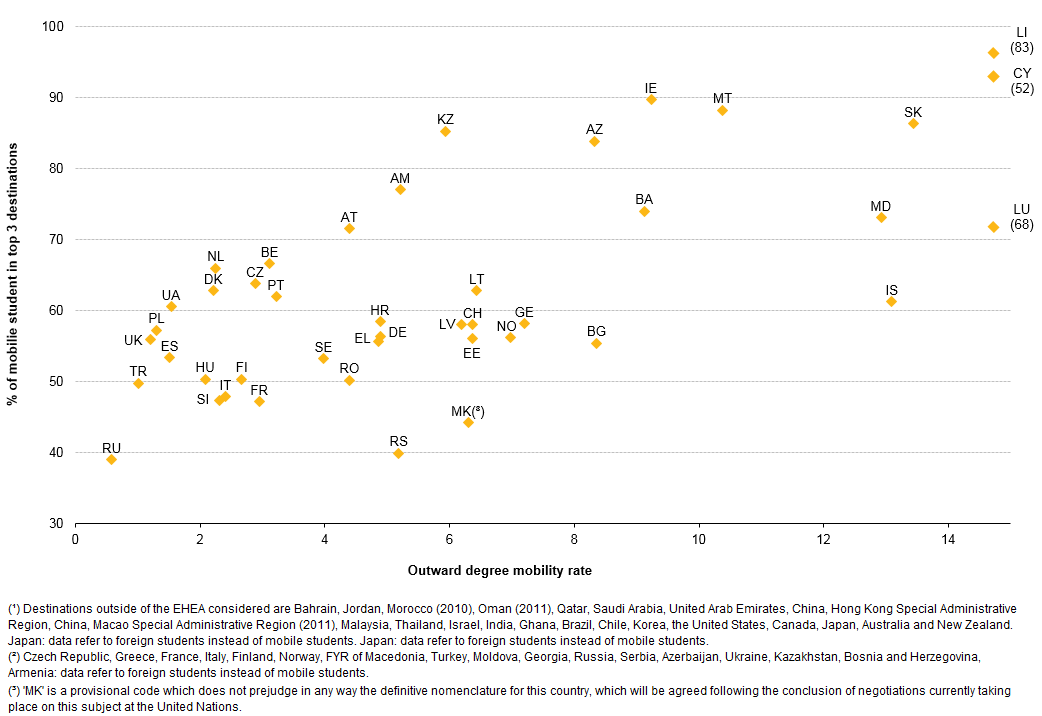
Top three countries of destination (outward)(¹)(²), 2011 12.PNG
(
file
)
26 KB
4
13:49, 10 April 2015
Top three countries of origin (inward)(¹), 2011 12.PNG
(
file
)
27 KB
5
13:48, 10 April 2015
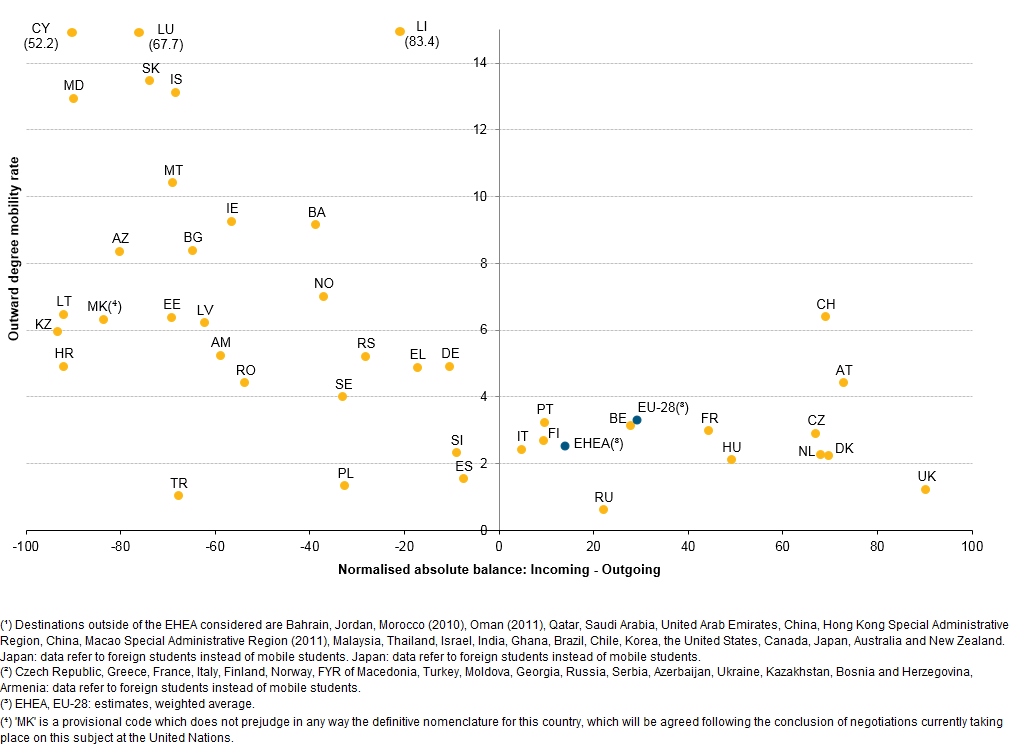
Mob balance versus outward degree mob rate.PNG
(
file
)
43 KB
5
13:47, 10 April 2015
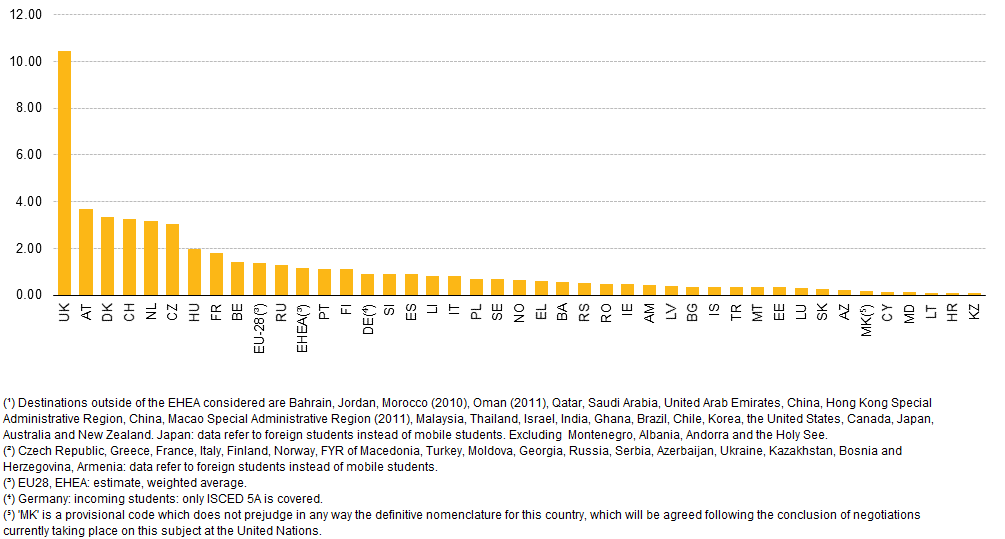
Mob balance incoming outgoing tertiary students ratio within and outside the EHEA(¹)(²), 2011 12.PNG
(
file
)
27 KB
4
13:47, 10 April 2015
Mob balance incoming outgoing tertiary students ratio within the EHEA(¹), 2011 12.PNG
(
file
)
20 KB
5
13:29, 10 April 2015
Outward degree mobility rate by destination 2011 2012.PNG
(
file
)
48 KB
5
13:28, 10 April 2015
Number of outward degree tertiary education mobile EHEA students within the EHEA, by country of destination(¹), 2011 12.PNG
(
file
)
21 KB
3
13:28, 10 April 2015
Number of incoming degree tertiary education mobile students from the EHEA, by country of destination(¹), 2011 12.PNG
(
file
)
23 KB
3
13:27, 10 April 2015
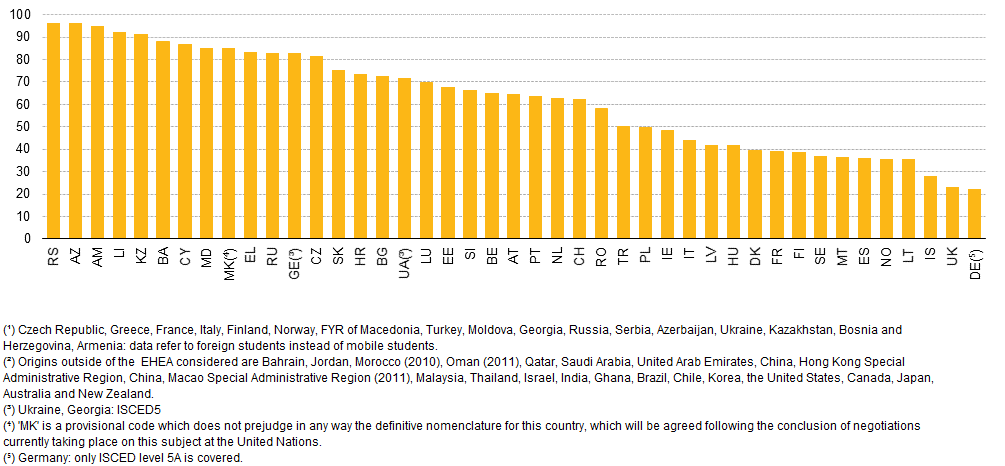
Incoming degree mobility rate mobile students from the EHEA in the country as pct of the total number of students enrolled(¹), 2011 12.PNG
(
file
)
20 KB
3
13:07, 10 April 2015
Number of outward degree tertiary education mobile students studying outside the EHEA(¹), 2011 12.PNG
(
file
)
22 KB
6
13:06, 10 April 2015
Outward degree mobility rate students outside the EHEA as a pct of the students of the same country of origin, 2011 12.PNG
(
file
)
29 KB
2
13:05, 10 April 2015
Number of incoming degree tertiary education mobile students from outside the EHEA by country of destination(¹), 2011 12.PNG
(
file
)
22 KB
4
13:04, 10 April 2015
Mobile students from outside the EHEA as a pct of the total number of students enrolled, by country of destination(¹), 2011 12.PNG
(
file
)
24 KB
4
11:31, 10 April 2015
Students enrolled in tertiary education, total and by sex, 30 or more years old, 2011 12.PNG
(
file
)
70 KB
2
11:30, 10 April 2015
Students studying part-time in tertiary education, by country and by age, 2011 12.PNG
(
file
)
19 KB
2
11:07, 10 April 2015
Unemployment ratio of tertiary education graduates aged 20-34, by the number of years since graduation (¹) and sex.PNG
(
file
)
57 KB
2
11:06, 10 April 2015
Unemployment ratio of tertiary education graduates aged 20-34, by the number of years since graduation (¹), 2013.PNG
(
file
)
26 KB
2
10:56, 10 April 2015
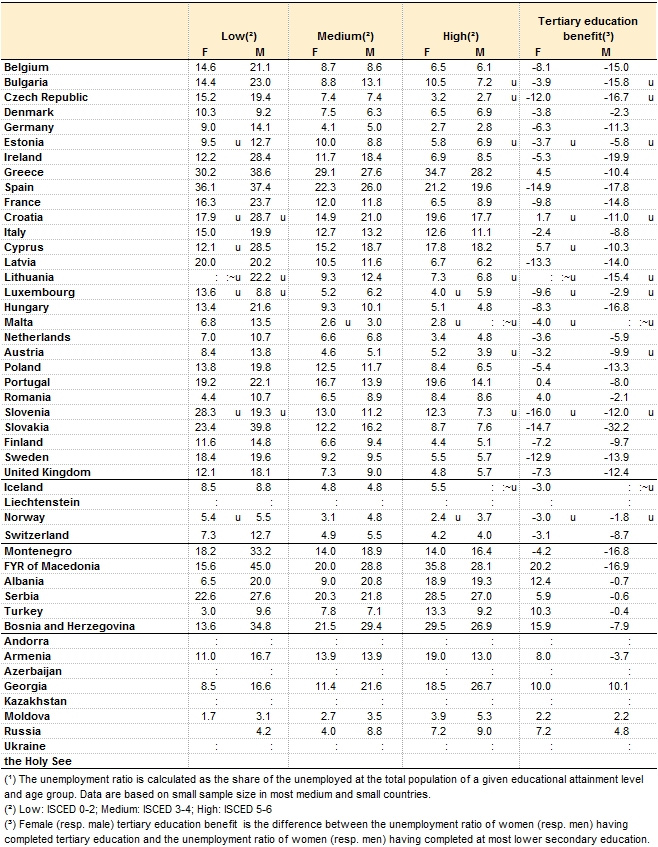
Unemployment ratio by educational attainment level and sex.PNG
(
file
)
57 KB
2
10:54, 10 April 2015
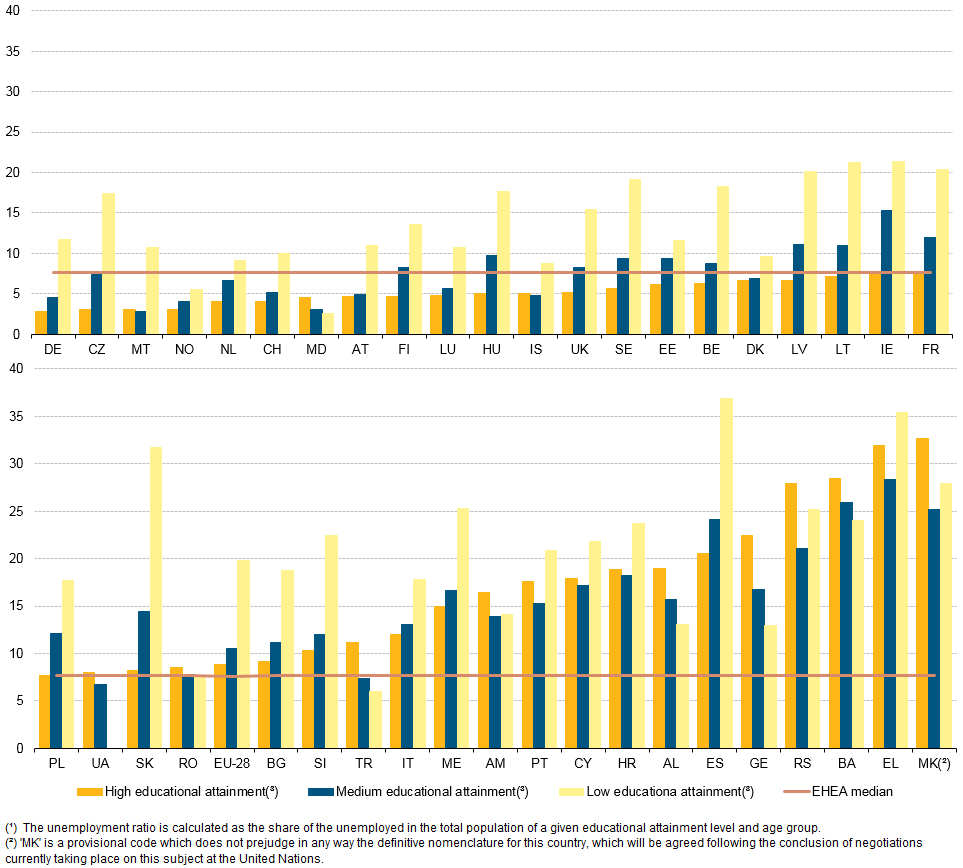
Unemployment ratio by educational attainment level 2013.PNG
(
file
)
70 KB
2
10:39, 10 April 2015
Net entry rate and net graduation rate, tertiary type B programmes, 2011 12.PNG
(
file
)
32 KB
2
10:38, 10 April 2015
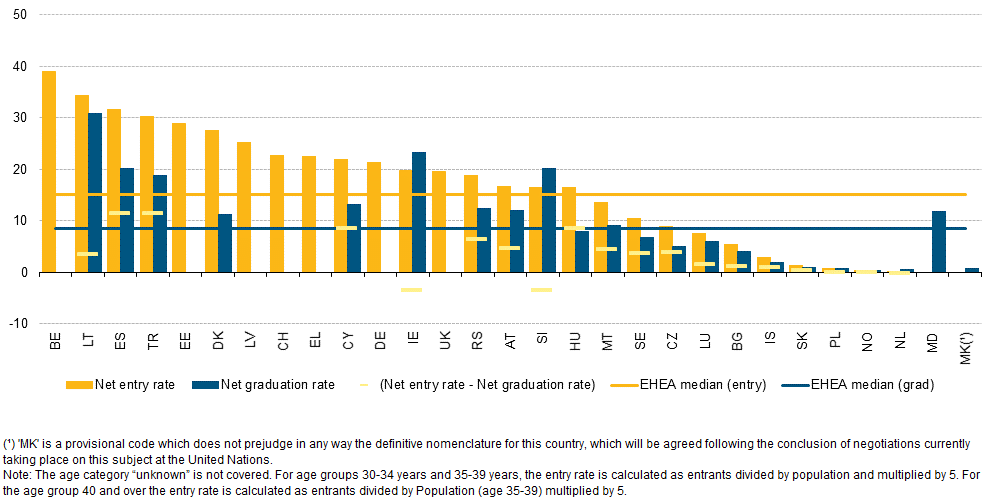
Net entry rate and net graduation rate, tertiary type A programmes, 2011 12.PNG
(
file
)
68 KB
3
10:28, 10 April 2015
Successful attainment of tertiary education by country of birth odds ratio, 2013.PNG
(
file
)
13 KB
3
10:26, 10 April 2015
Early leavers from education and training as percentage of the population born abroad, native born and the total population, 2013.PNG
(
file
)
45 KB
3
10:22, 10 April 2015
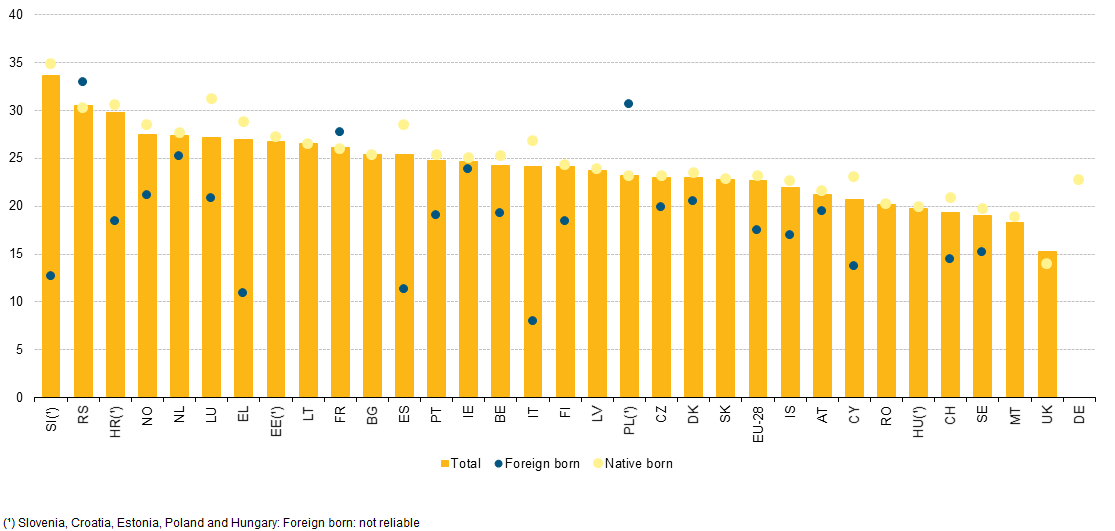
Participation rates in tertiary education among the population born abroad, native and total population, 2013.PNG
(
file
)
58 KB
2
10:01, 10 April 2015
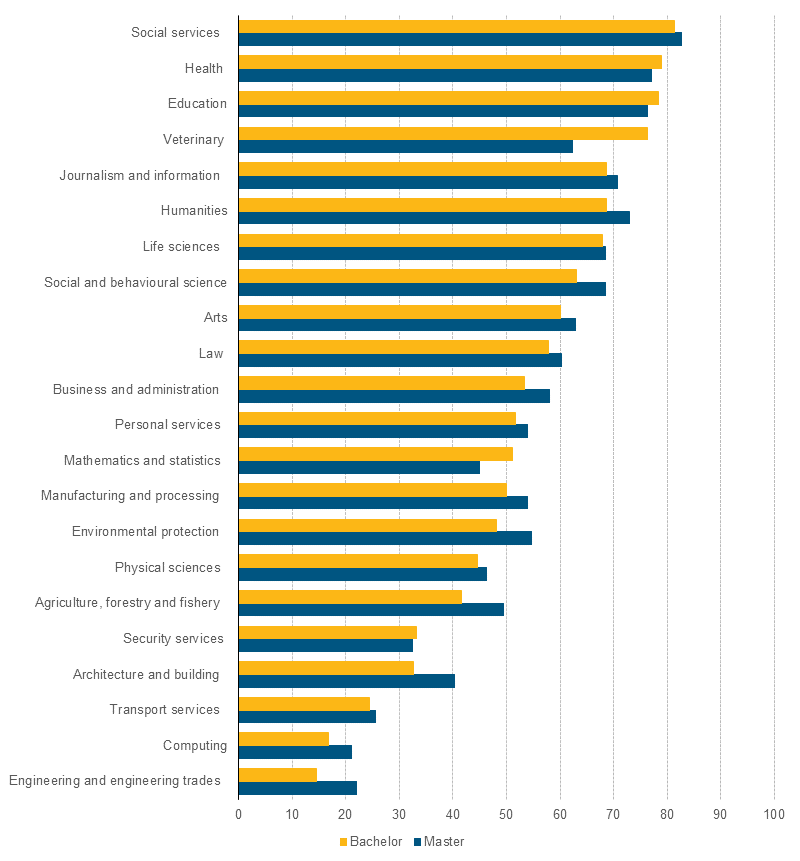
Median percentage of women in enrolled students by field of study and level of Bologna structure-(BA and MA), 2011 12.PNG
(
file
)
23 KB
1
09:56, 10 April 2015
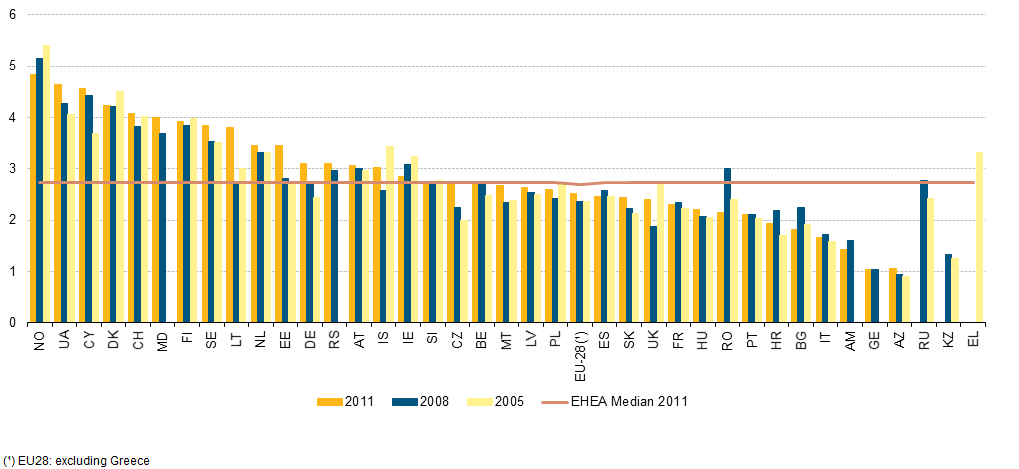
Annual expenditure on public and private education institutions per full-time equivalent student in PPS relative to the GDP per capita in PPS, 2005 2008, 2011.PNG
(
file
)
15 KB
1
09:55, 10 April 2015
Annual expenditure on public and private education institutions per full-time equivalent student, 2005, 2008 and 2011 - PPS.PNG
(
file
)
17 KB
1
09:46, 10 April 2015
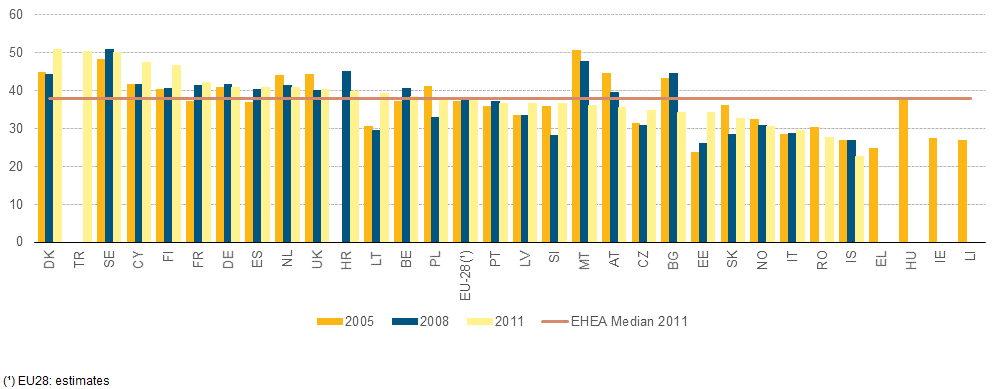
Annual public expenditure on tertiary education, 2005, 2008 and 2011.PNG
(
file
)
57 KB
2
09:30, 10 April 2015
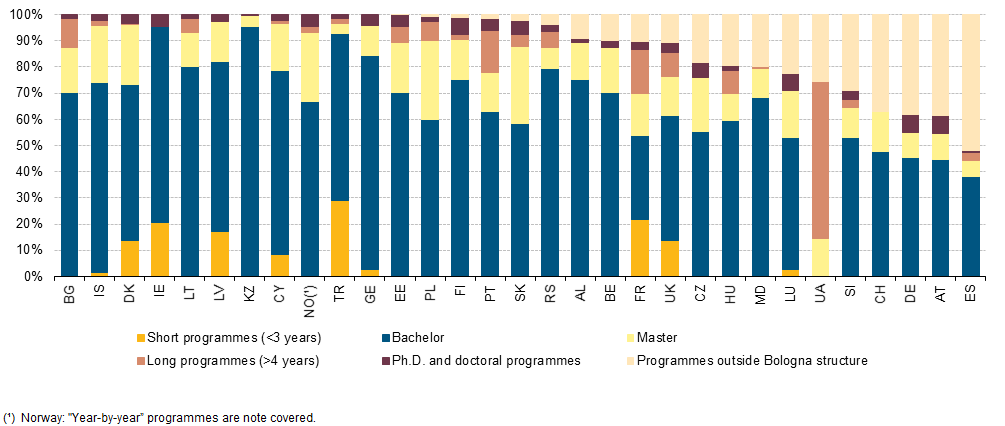
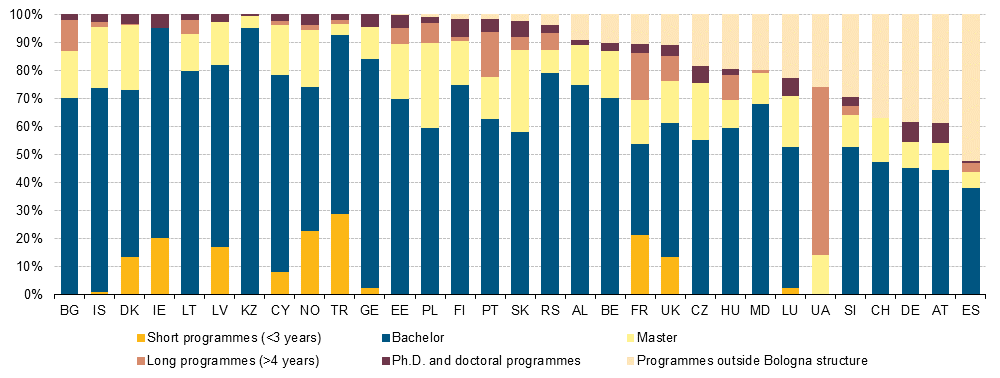
Distribution of students enrolled in programmes following the Bologna three-cycles structure, by cycle, 2011 12.PNG
(
file
)
66 KB
3
09:27, 10 April 2015
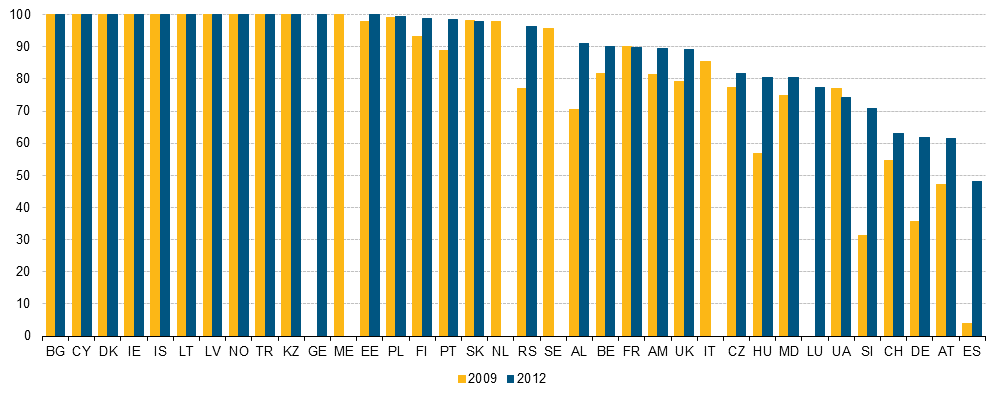
Percentage of students enrolled in programmes following the Bologna three-cycles structure, 2008 09 and 2011 12.PNG
(
file
)
22 KB
2
09:24, 10 April 2015
Enrolment rate in tertiary education for the 18-34 years old 2006 2009 2012.PNG
(
file
)
83 KB
2
09:23, 10 April 2015
Distribution of students enrolled in tertiary level of education by ISCED level, 2011 12.PNG
(
file
)
32 KB
2
09:22, 10 April 2015
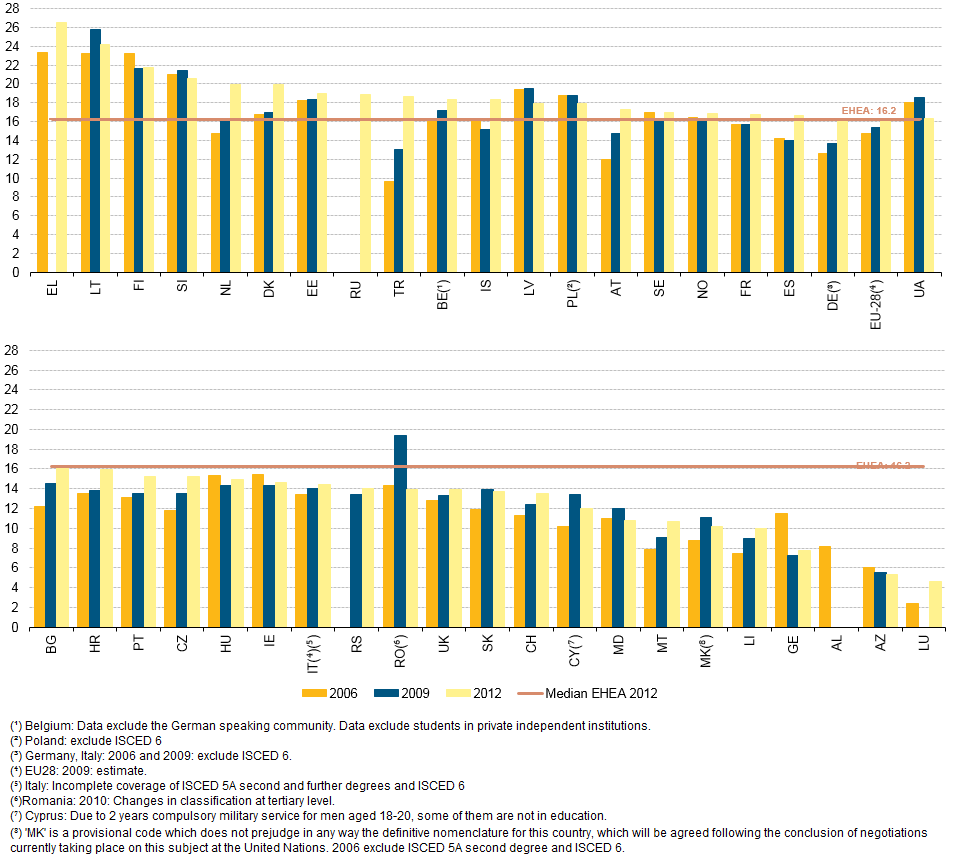
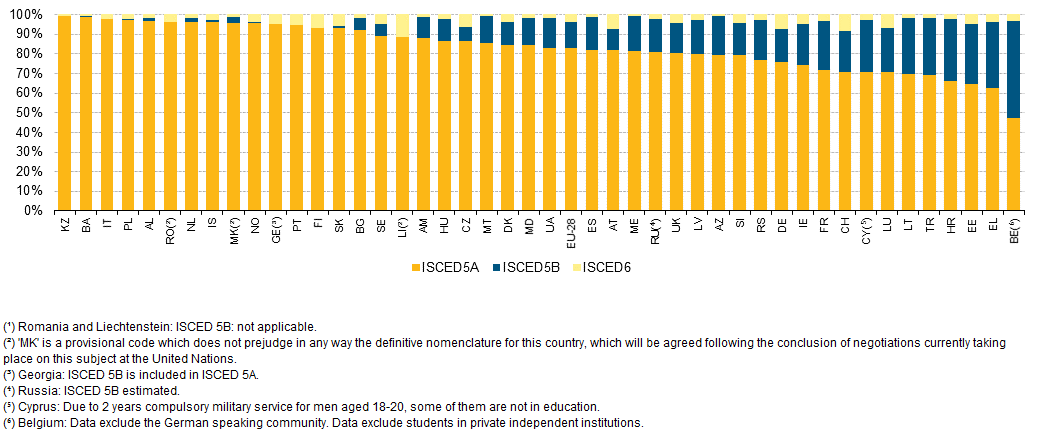
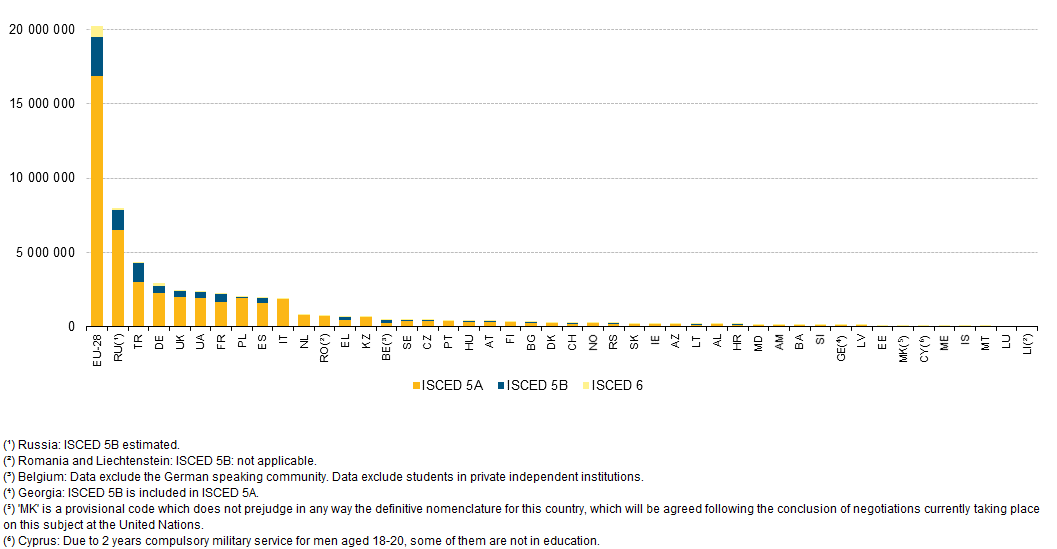
Number of students enrolled in tertiary education by ISCED level 2011 12.PNG
(
file
)
21 KB
2
15:52, 12 March 2015
Outward degree mobility rate students outside the EHEA as a pct of the students of the same country of origin, 2011 12.png
(
file
)
29 KB
1
15:47, 12 March 2015
Outward degree mobility rate students abroad outside the EHEA as a pct of the students of the same country of origin(¹)(²), 2011 12.png
(
file
)
29 KB
2
15:30, 12 March 2015
Outward degree mobility students abroad outside the EHEA as pct students of the same country of origin(¹)(²), 2011 12.PNG
(
file
)
22 KB
3
12:37, 11 February 2015
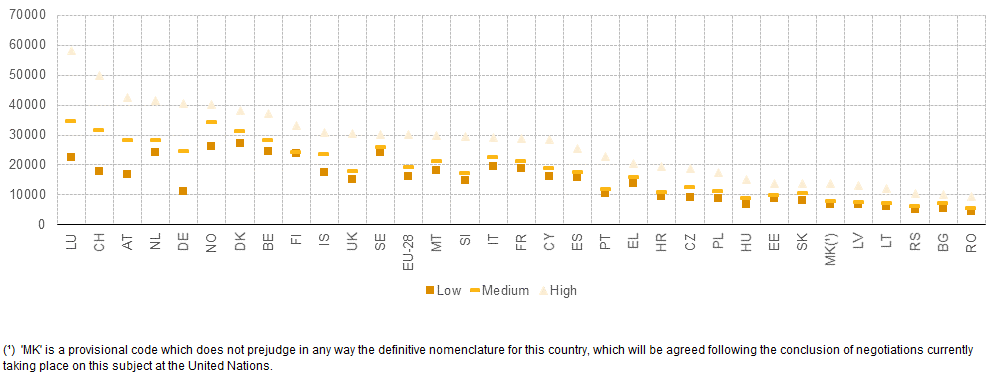
Median of annual gross income of employees by educational attainment, 2013.PNG
(
file
)
20 KB
2
11:36, 11 February 2015
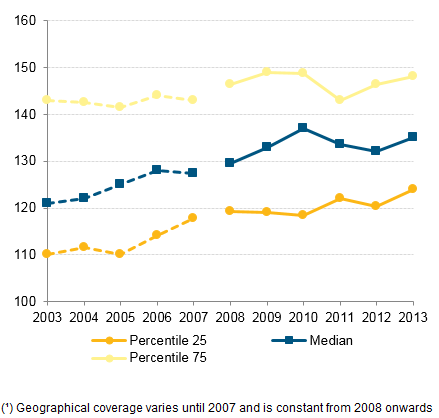
Ratio of median annual gross income of employees with tertiary education to the median (¹), 2013.PNG
(
file
)
29 KB
2
18:01, 10 February 2015
Attainment by gender Gender Parity Index of women to men to attain higher education(¹), 2003-2013.PNG
(
file
)
15 KB
2
14:20, 10 February 2015
Outward degree mobility rate – mobile graduates within the EHEA as a pct of all graduates of the same country of origin, 2011 12.PNG
(
file
)
7 KB
2
15:22, 6 February 2015
Figure 2 Percentage of Women in new entrants in tertiary education by age group2011.PNG
(
file
)
81 KB
2
15:21, 6 February 2015
Figure 1 Distribution of students enrolled in tertiary level of education by ISCED level, 2011 12.PNG
(
file
)
39 KB
2
11:54, 6 February 2015
Figure 4 Median percentage of women in enrolled students in Bologna structures by field (BA and MA), 2011 12.PNG
(
file
)
23 KB
2
12:05, 5 February 2015
Figure 6 Distribution of students enrolled in the Bologna three-cycles structure, by cycle, 2011 12.PNG
(
file
)
33 KB
3
11:47, 5 February 2015
Figure 5 Percentage of students enrolled in the Bologna three-cycles structure, 2008 09 and 2011 12.PNG
(
file
)
22 KB
4
10:48, 30 June 2014
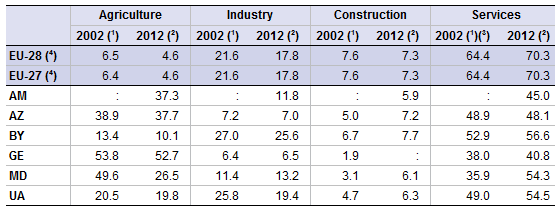
ENPE Employment by economic activity 2002 and 2012.PNG
(
file
)
14 KB
1
14:55, 3 March 2014
CPC Total gross inland energy consumption and energy intensity of the economy 2002 and 2012.PNG
(
file
)
23 KB
1
14:55, 3 March 2014
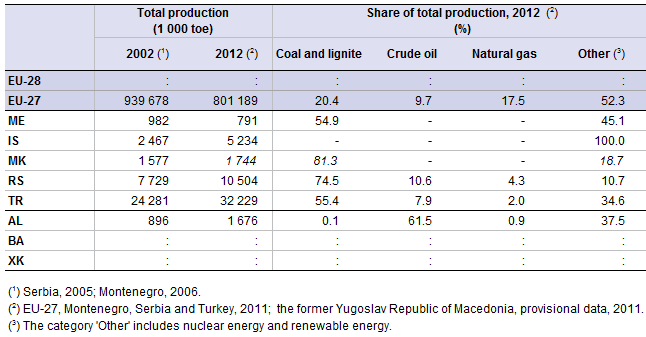
CPC Primary energy production 2002 and 2012.PNG
(
file
)
22 KB
1
14:55, 3 March 2014
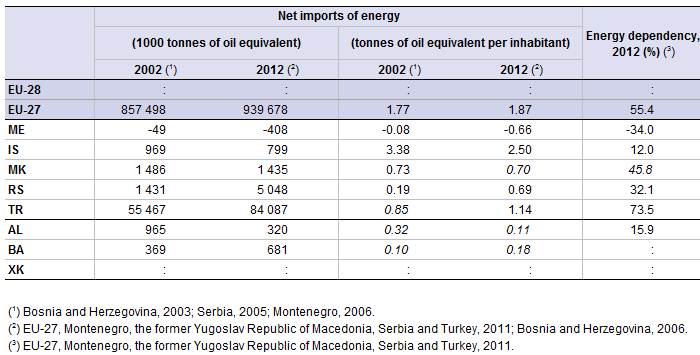
CPC Net imports of energy and energy dependency 2002 and 2012.PNG
(
file
)
26 KB
1
First page
Previous page
Next page
Last page
Special page
ISSN 2443-8219

(%C2%B9)(%C2%B2),_2011_12.PNG)
(%C2%B9),_2011_12.PNG)

(%C2%B2),_2011_12.PNG)
,_2011_12.PNG)

,_2011_12.PNG)
,_2011_12.PNG)
,_2011_12.PNG)
,_2011_12.PNG)

,_2011_12.PNG)
,_2011_12.PNG)


_and_sex.PNG)
,_2013.PNG)


,_2011_12.PNG)


(%C2%B2),_2011_12.png)
(%C2%B2),_2011_12.PNG)

,_2013.PNG)
,_2003-2013.PNG)


,_2011_12.PNG)


