Tutorials
Log in
Statistics Explained
menu
search
search
Navigation
Main page
Statistical themes
Glossary
Categories
Statistics 4 beginners
Tutorials
Help
Eurostat home
Education corner
Online publications
Regional yearbook
Sustainable development
Full list
Tools
User contributions
Logs
View user groups
Special pages
search
Navigation
Main page
Statistical themes
Glossary
Categories
Statistics 4 beginners
Tutorials
Help
Eurostat home
Education corner
Online publications
Regional yearbook
Sustainable development
Full list
Tools
User contributions
Logs
View user groups
Special pages
Navigation
Main page
Statistical themes
Glossary
Categories
Statistics 4 beginners
Tutorials
Help
Eurostat home
Education corner
Online publications
Regional yearbook
Sustainable development
Full list
Tools
User contributions
Logs
View user groups
Special pages
Uploads by Dimitch
This special page shows all uploaded files.
File list
Items per page:
20
50
100
250
500
Search for media name:
Username:
Include old versions of files
Go
First page
Previous page
Next page
Last page
Date
Name
Thumbnail
Size
Description
Versions
15:19, 16 January 2023
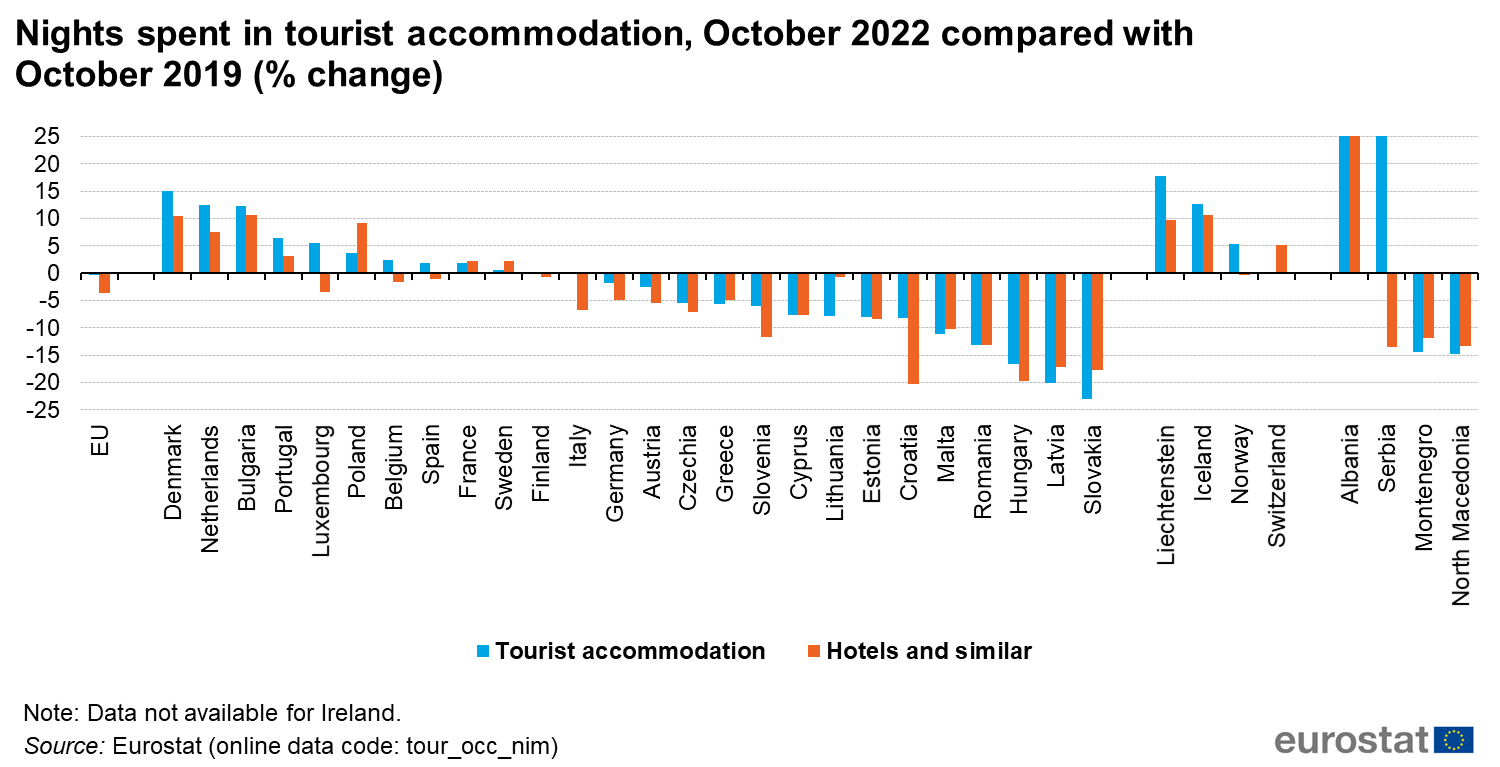
Nights spent in tourist accommodation, October 2022 compared with October 2019 (% change).png
(
file
)
106 KB
2
15:12, 16 January 2023
Nights spent in tourist accommodation establishments, October 2022 (thousand nights).png
(
file
)
671 KB
1
15:09, 16 January 2023
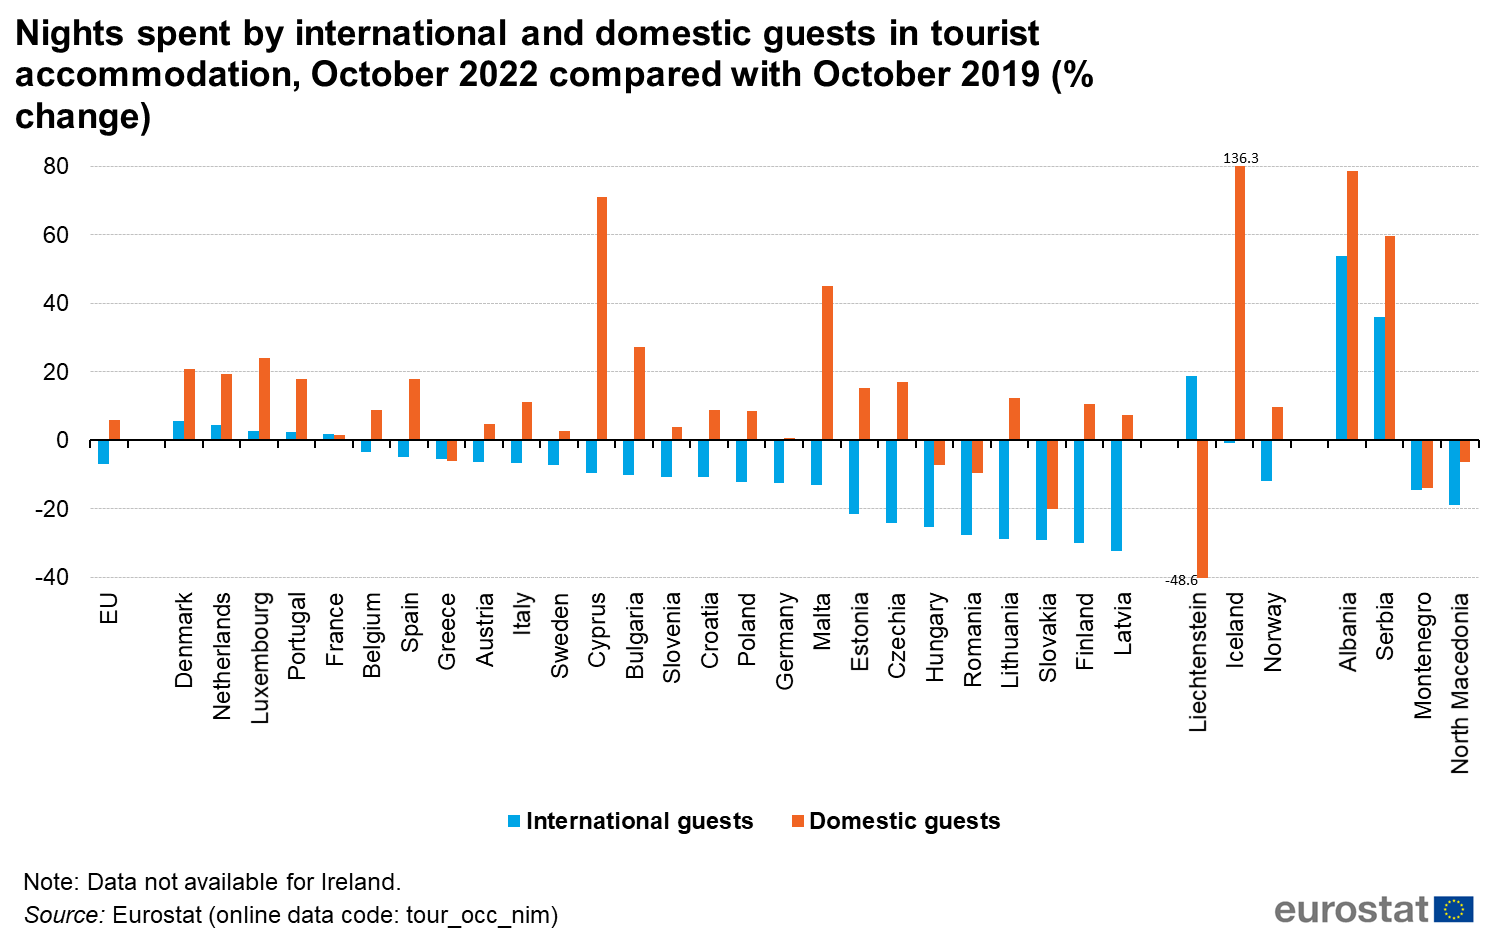
Nights spent by international and domestic guests in tourist accommodation, October 2022 compared with October 2019 (% change).png
(
file
)
121 KB
1
15:09, 16 January 2023
Nights spent in EU tourist accommodation, January to December 2019, 2020 and 2021 and January to October 2022 (million nights).png
(
file
)
107 KB
1
15:08, 16 January 2023
Annual estimates - Number of nights spent at tourist accommodation establishments, EU, 2009-2022 (millions).png
(
file
)
86 KB
1
15:08, 16 January 2023
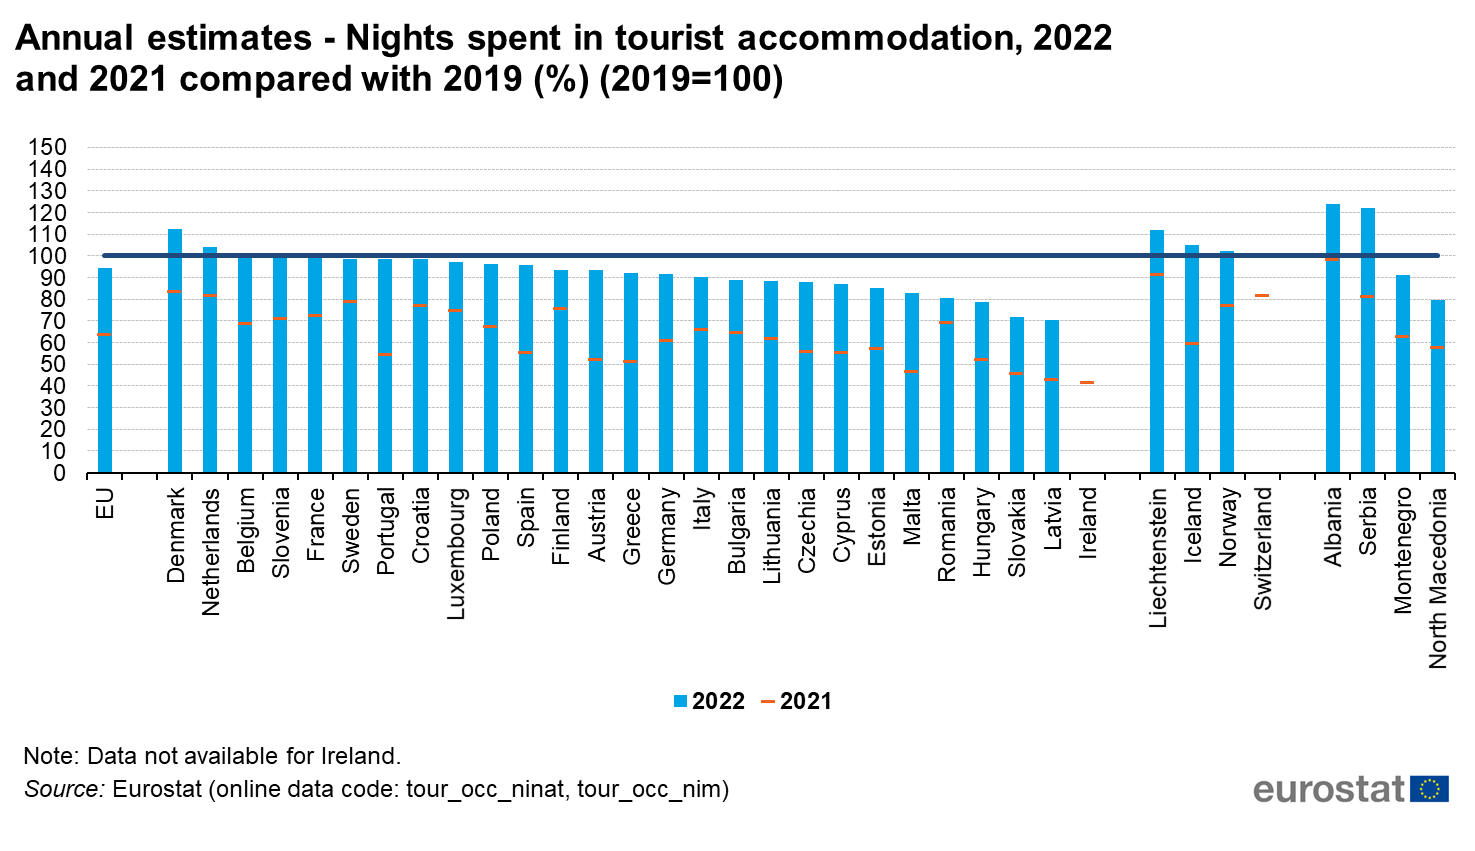
Annual estimates - Nights spent in tourist accommodation, 2022 and 2021 compared with 2019 (%) (2019=100) .png
(
file
)
140 KB
1
15:07, 16 January 2023
Nights spent by international guests in tourist accommodation, 2022 and 2021 compared with 2019 (%) (2019=100) .png
(
file
)
145 KB
1
15:07, 16 January 2023
Annual estimates - Nights spent at tourist accommodation establishments by NACE class, 2022 compared with 2019 (% change).png
(
file
)
840 KB
1
15:06, 16 January 2023
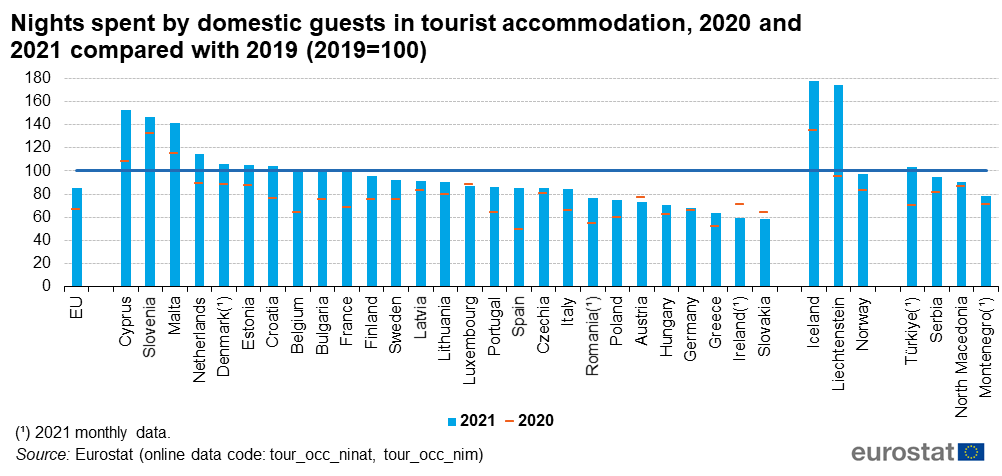
Nights spent by domestic guests in tourist accommodation, 2022 and 2021 compared with 2019 (%) (2019=100) .png
(
file
)
147 KB
1
15:05, 16 January 2023
Nights spent OCT 2022.xlsx
(
file
)
131 KB
1
18:53, 15 December 2022
Share of population participating in tourism, 2021 (% of population aged 15 years or more).png
(
file
)
103 KB
1
18:50, 15 December 2022
Country of origin for outbound tourism trips, 2021 (average nights spent abroad per inhabitant aged 15 years or more).png
(
file
)
96 KB
1
18:50, 15 December 2022
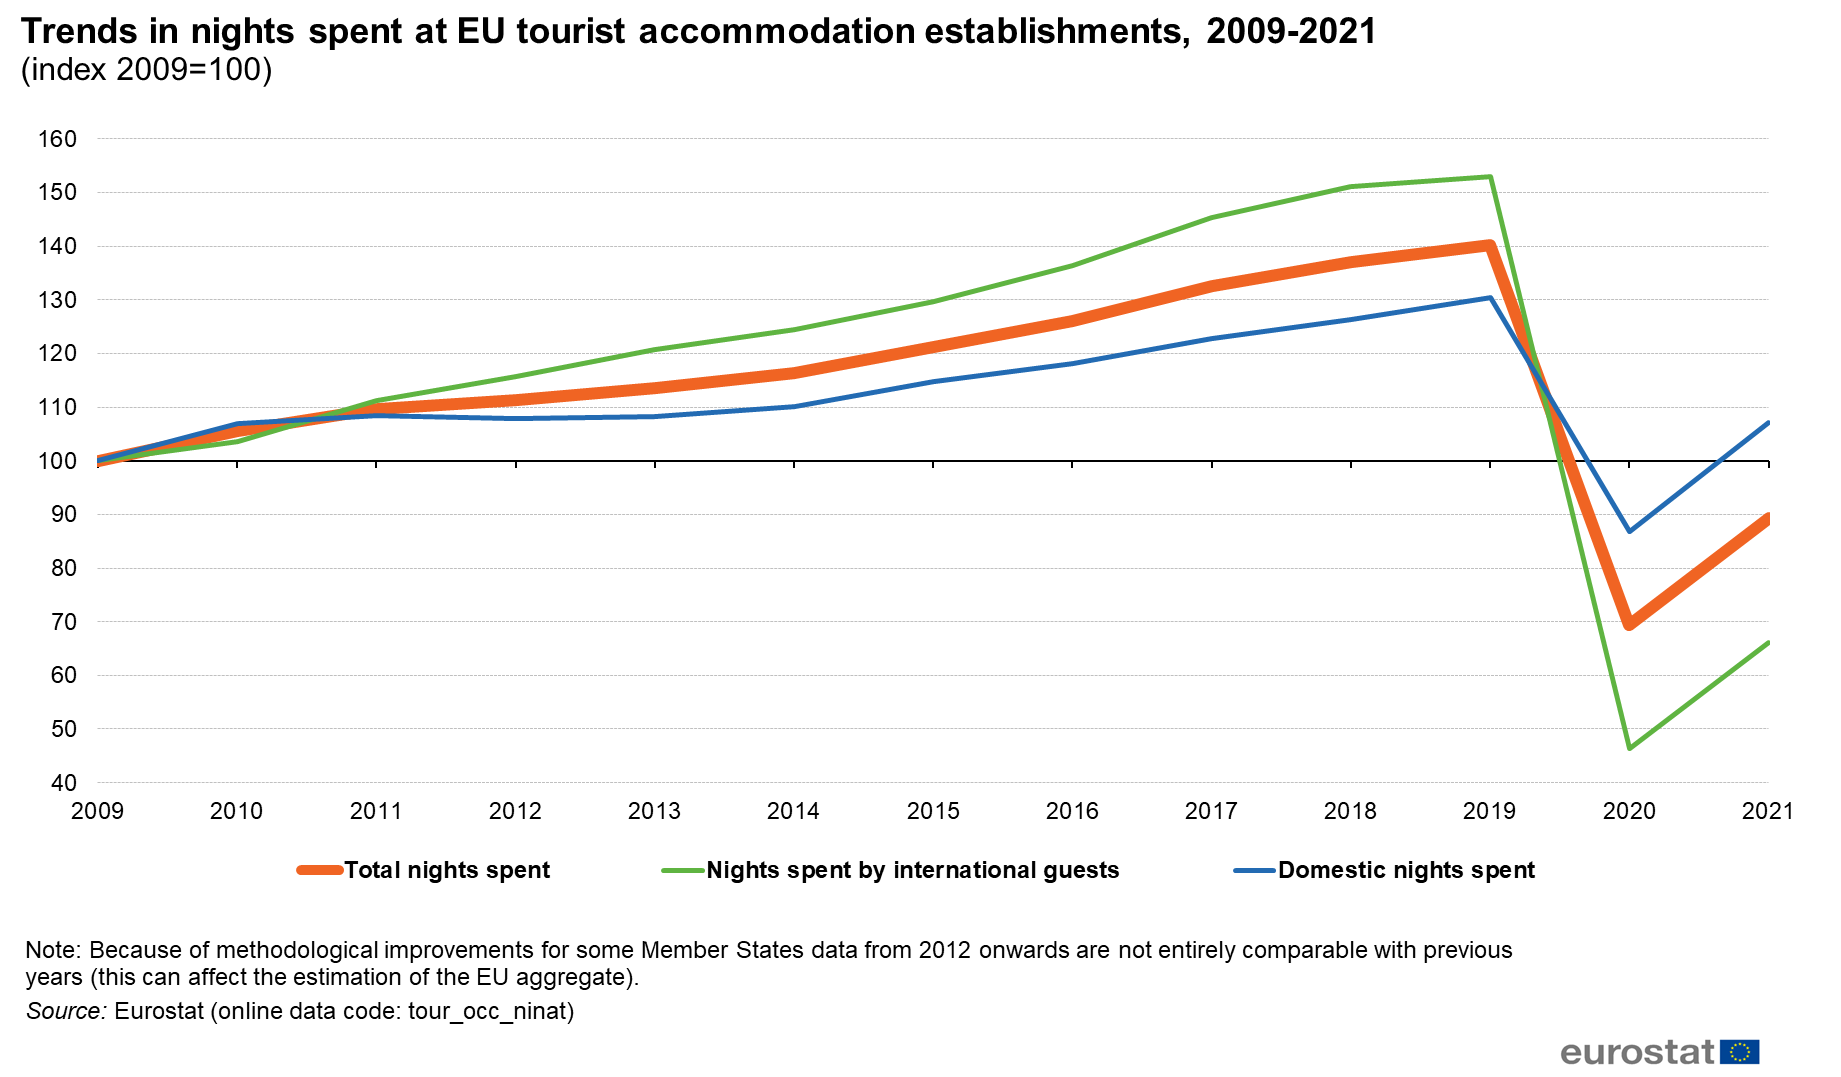
Trends in nights spent at EU tourist accommodation establishments, 2009-2021 (index 2009=100).png
(
file
)
121 KB
1
18:48, 15 December 2022
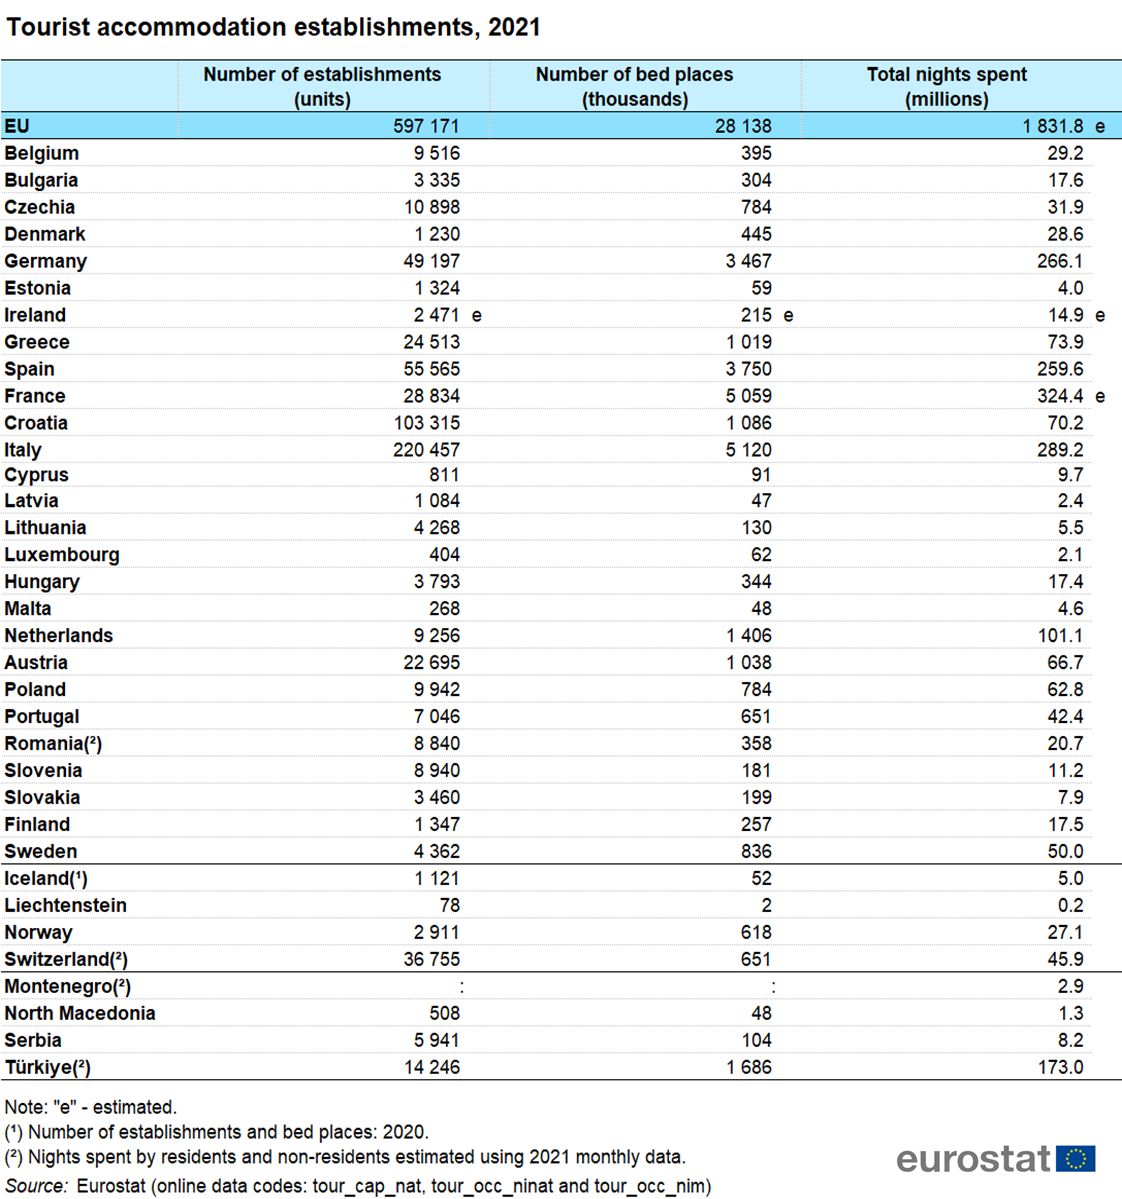
Tourist accommodation establishments, 2021.png
(
file
)
417 KB
1
18:47, 15 December 2022
Tourism intensity, 2021 (nights spent by domestic and international guests at tourist accommodation establishments per inhabitant).png
(
file
)
118 KB
1
18:46, 15 December 2022
Tourism statistics 2021data.xlsx
(
file
)
636 KB
1
18:30, 23 November 2022
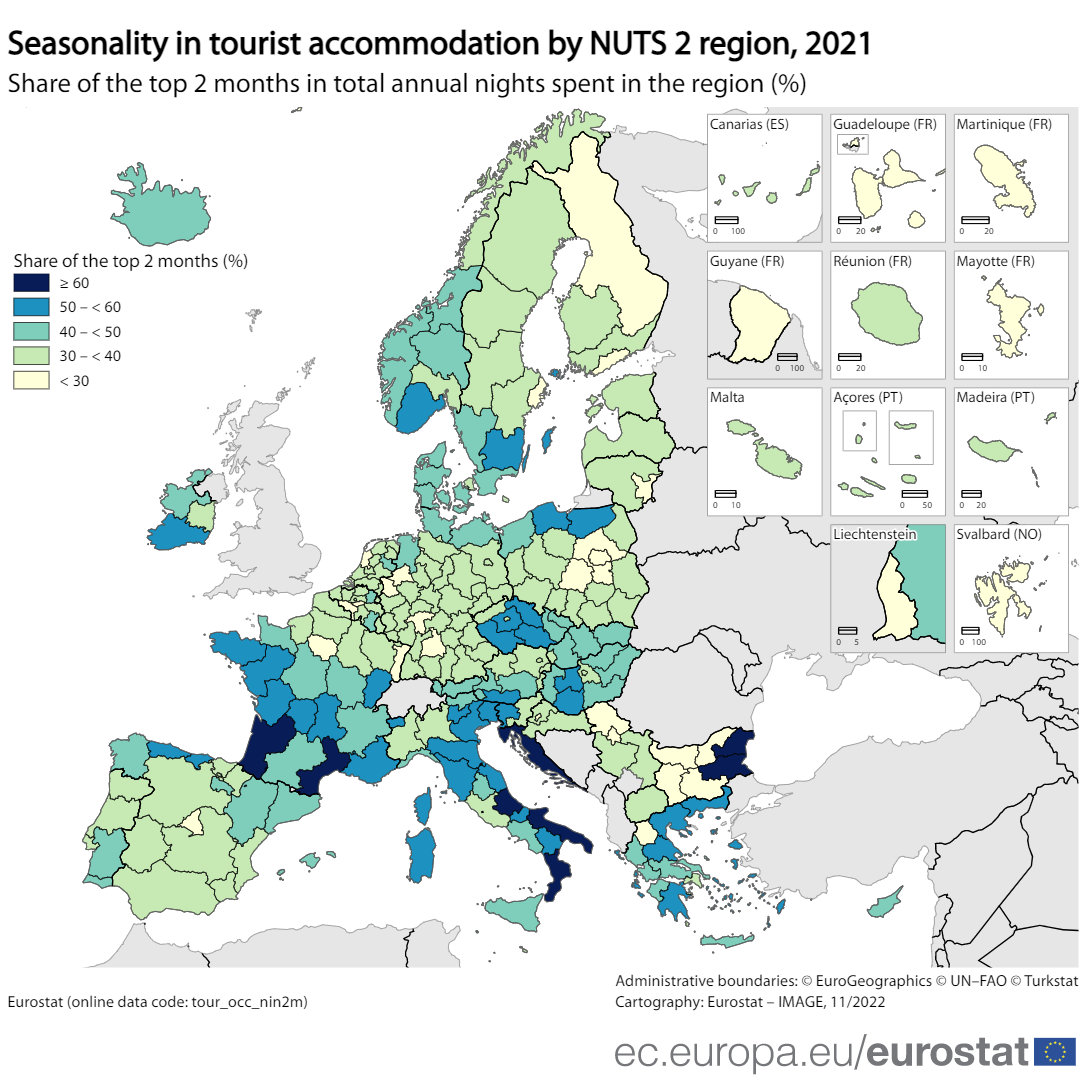
Share of the top 2 months in total annual nights spent in the region.png
(
file
)
421 KB
2
17:13, 23 November 2022
Tourism seasonality regional 2021data.xlsx
(
file
)
149 KB
1
13:44, 23 November 2022
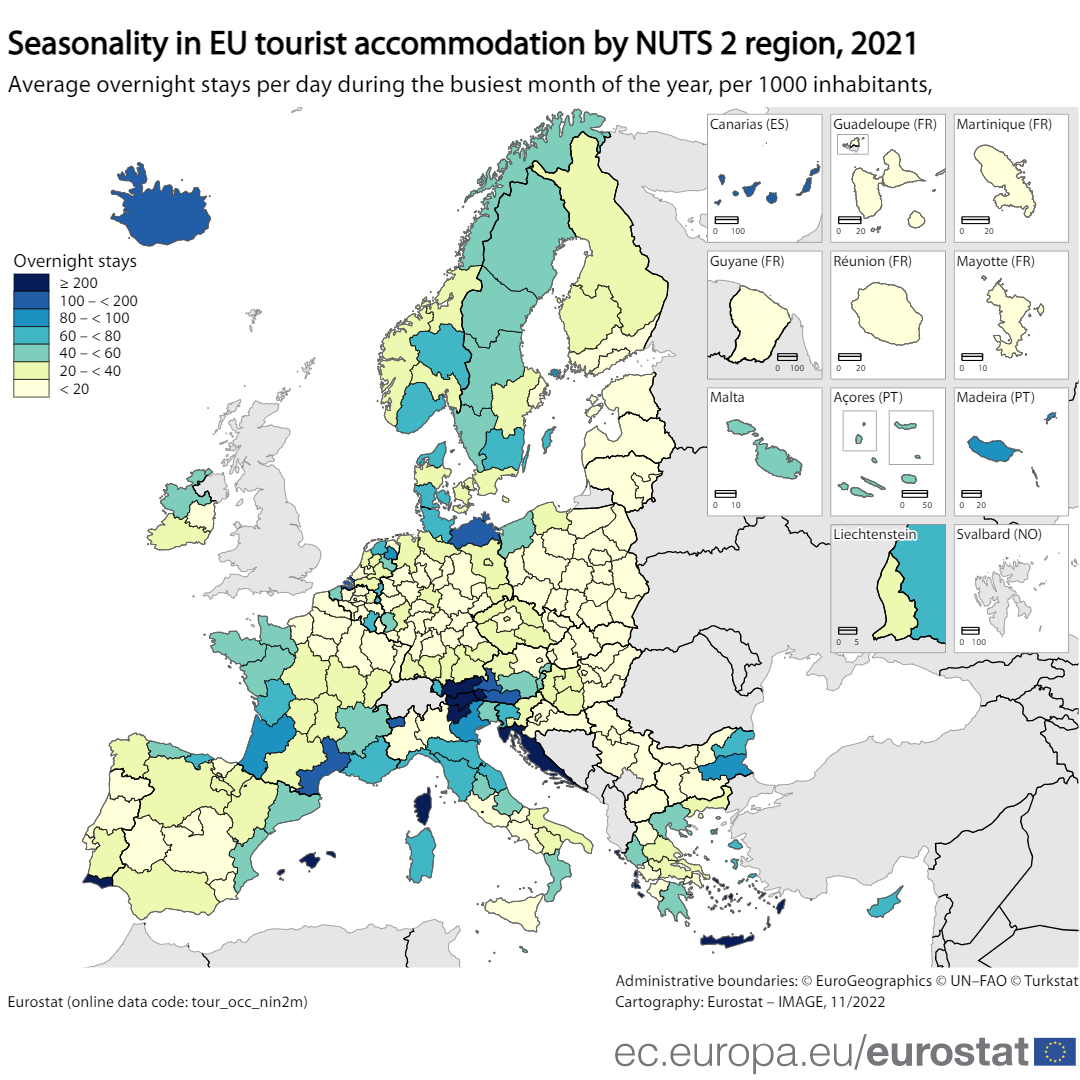
Average overnight stays per day during the busiest month of the year, per 1000 inhabitants.png
(
file
)
419 KB
1
13:44, 23 November 2022
Average overnight stays per day during the busiest month of the year, per Km2.png
(
file
)
416 KB
1
13:43, 23 November 2022
Top month in terms of nights spent.png
(
file
)
410 KB
1
13:27, 23 November 2022
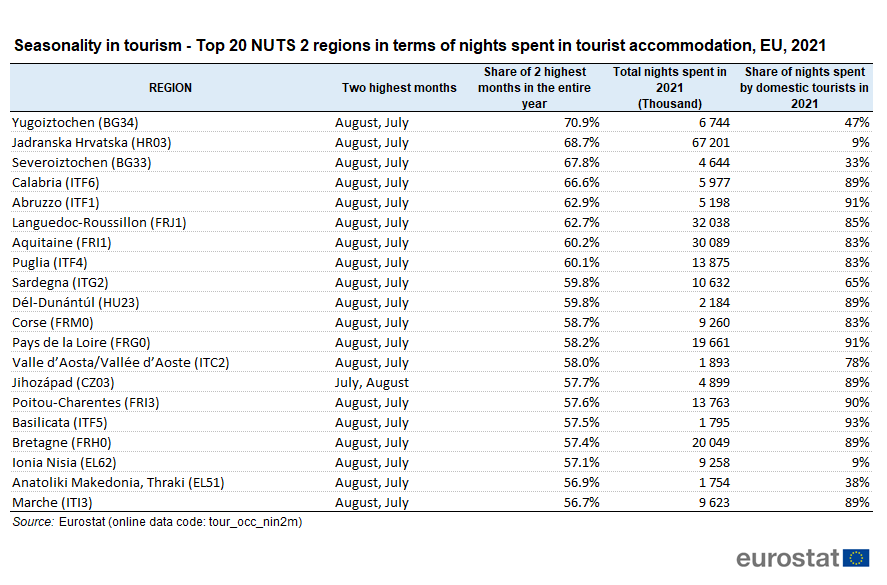
Seasonality in tourism - Top 20 NUTS 2 regions in terms of nights spent in tourist accommodation, EU, 2021.png
(
file
)
60 KB
1
13:27, 23 November 2022
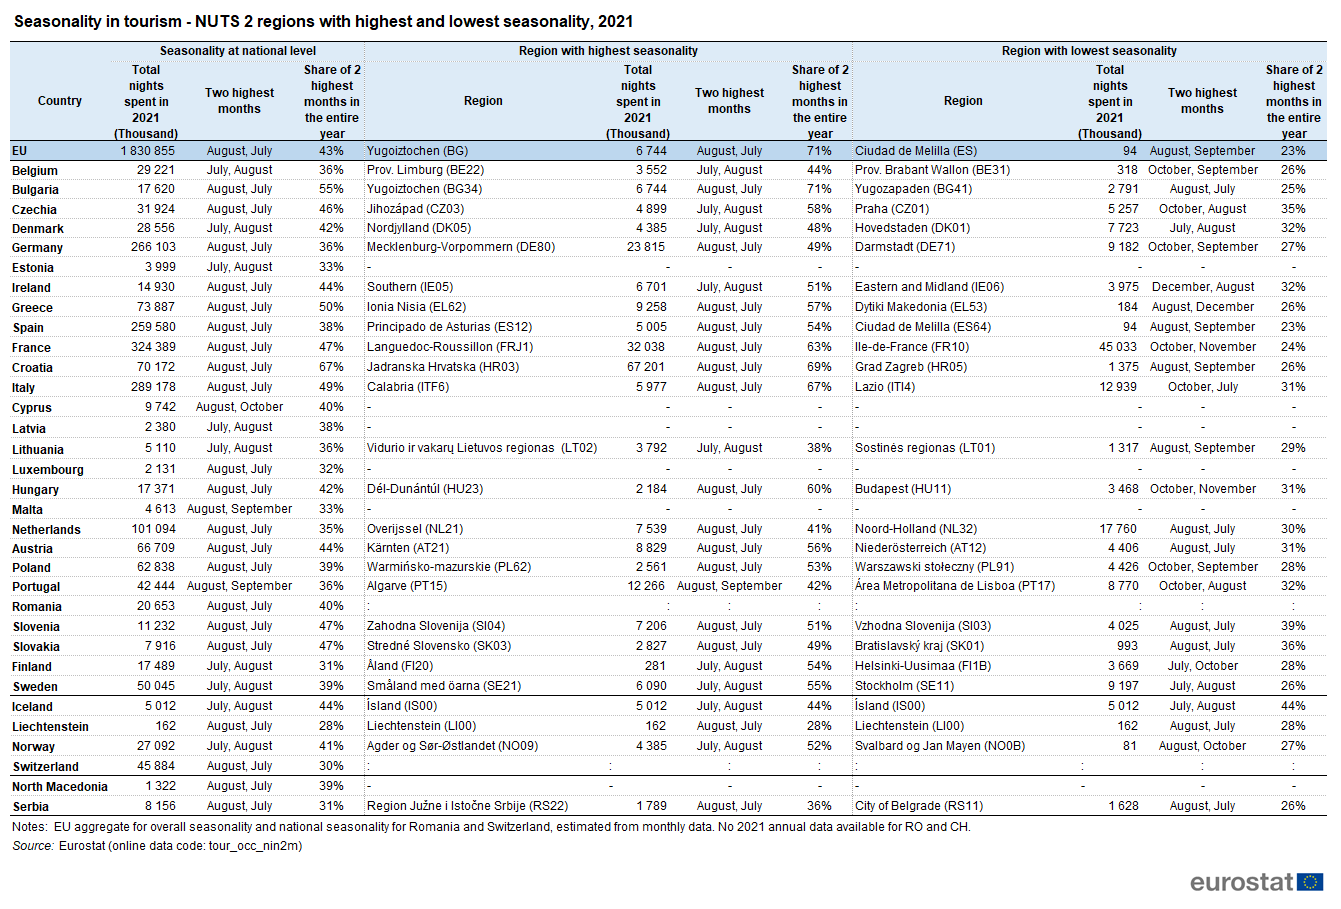
Seasonality in tourism - NUTS 2 regions with highest and lowest seasonality, 2021.png
(
file
)
157 KB
1
13:27, 23 November 2022
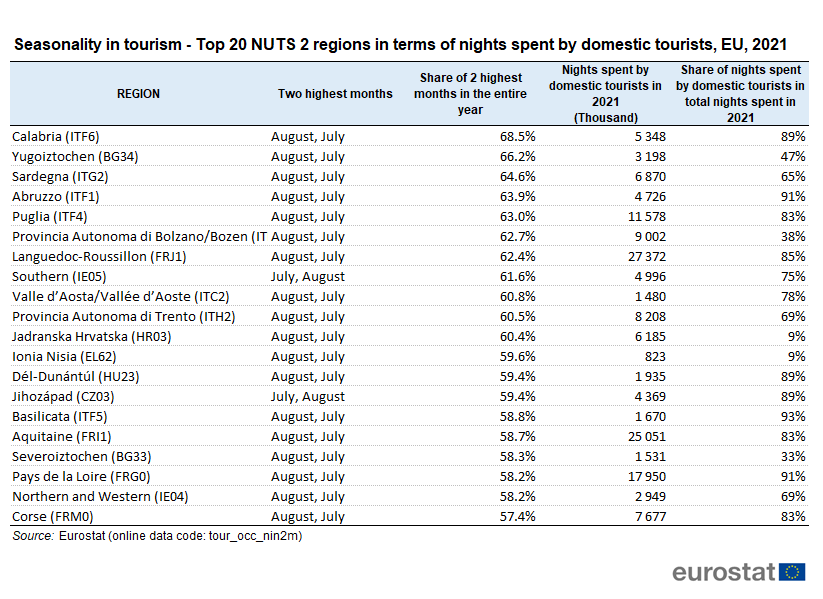
Seasonality in tourism - Top 20 NUTS 2 regions in terms of nights spent by domestic tourists, EU, 2021.png
(
file
)
62 KB
1
13:26, 23 November 2022
Seasonality in tourism - Top NUTS 2 regions in terms of nights spent by international tourists, EU, 2021.png
(
file
)
62 KB
2
19:29, 25 October 2022
Tourism supply annual 2021.xlsx
(
file
)
254 KB
2
19:20, 25 October 2022
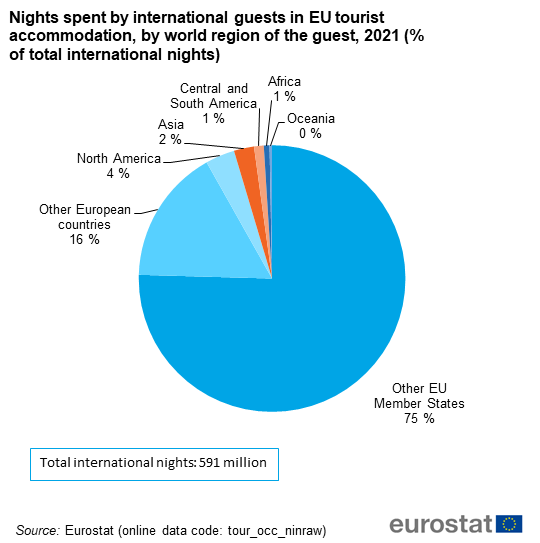
Nights spent by international guests in EU tourist accommodation, by world region of the guest, 2021 (% of total international nights).png
(
file
)
36 KB
2
18:50, 25 October 2022
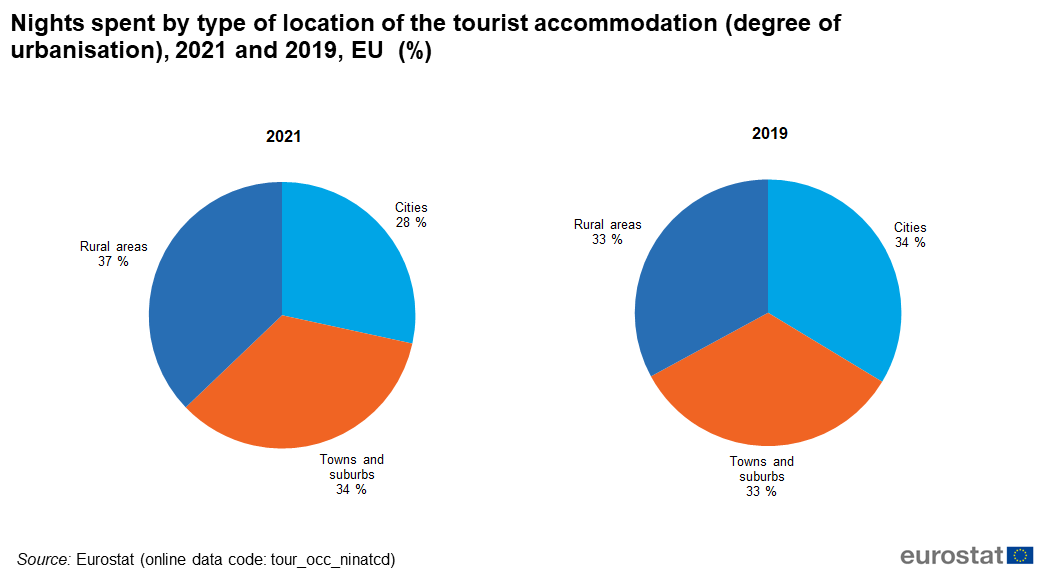
Nights spent by type of location of the tourist accommodation (degree of urbanisation), 2021 and 2019, EU (%).png
(
file
)
44 KB
2
18:44, 25 October 2022
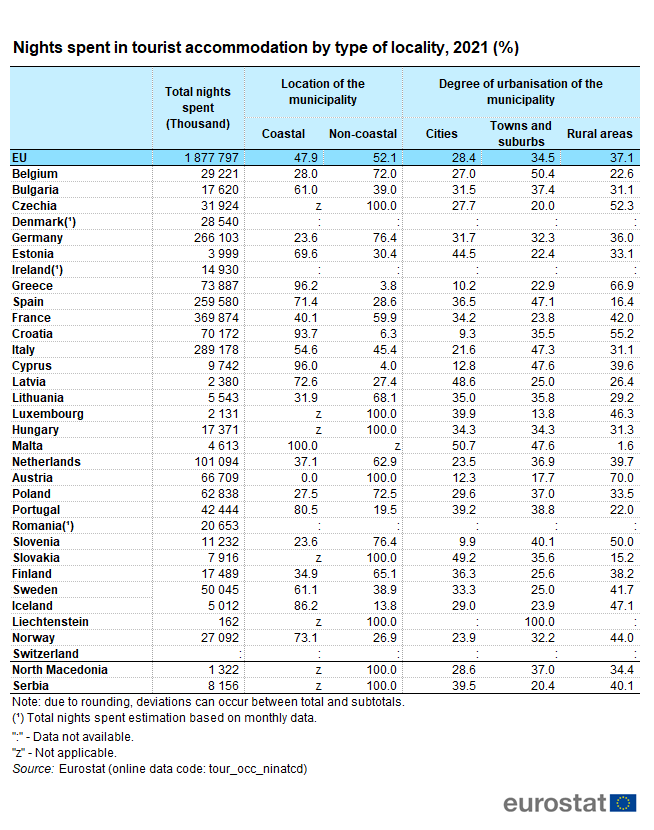
Nights spent in tourist accommodation by type of locality, 2021 (%).png
(
file
)
70 KB
1
18:11, 25 October 2022
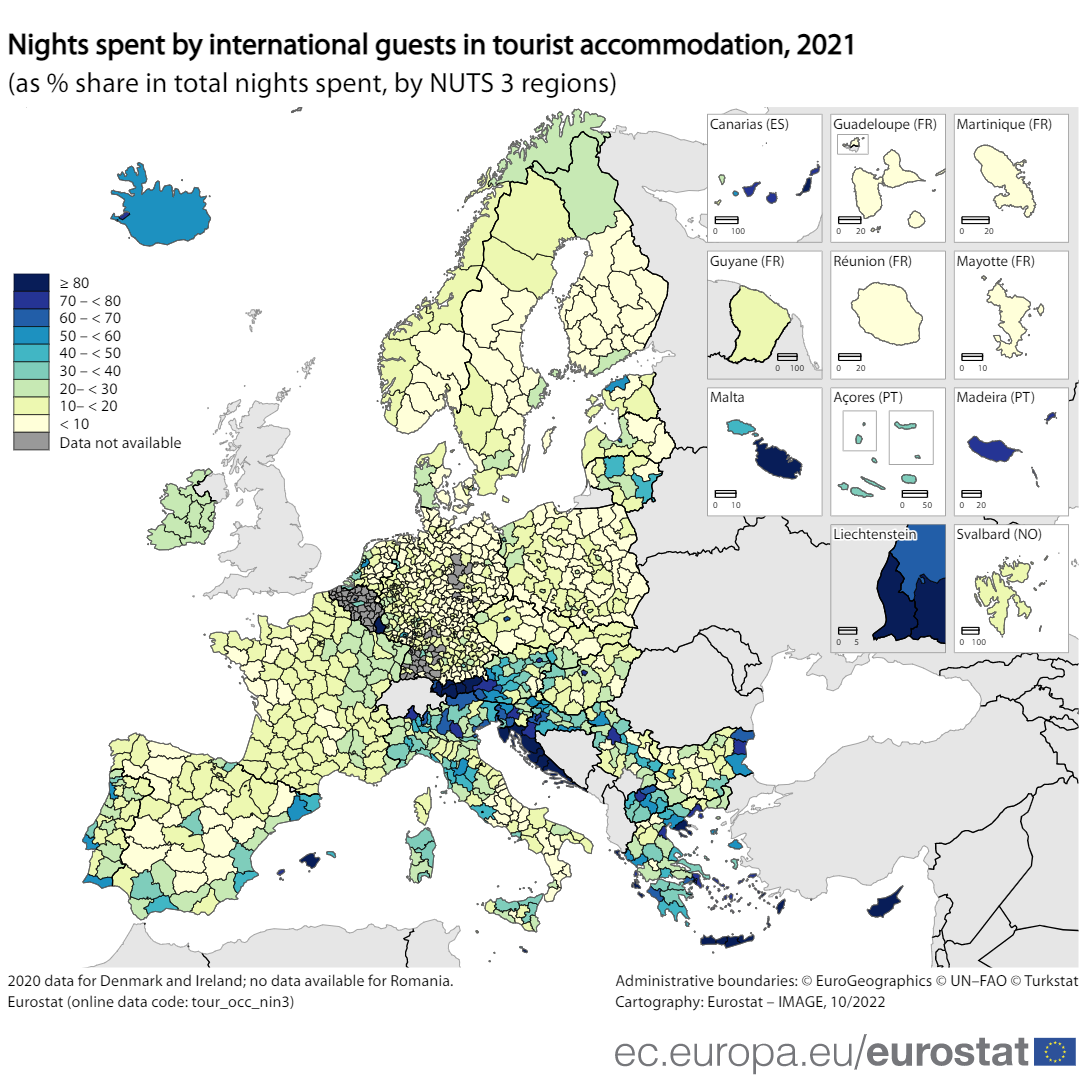
Nights spent by international guests in tourist accommodation, 2021 (as % share in total nights spent).png
(
file
)
527 KB
1
17:55, 25 October 2022
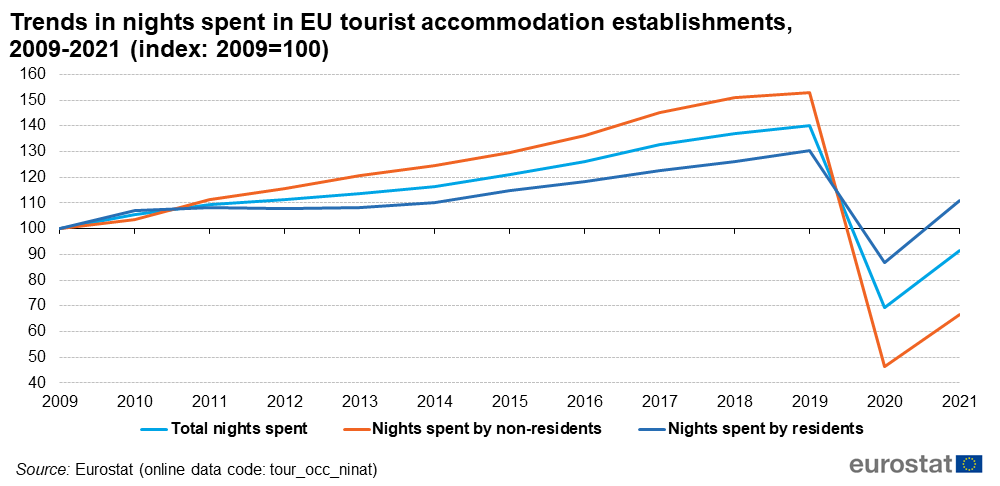
Trends in nights spent in EU tourist accommodation establishments, 2009-2021 (index 2009=100).png
(
file
)
49 KB
1
17:51, 25 October 2022
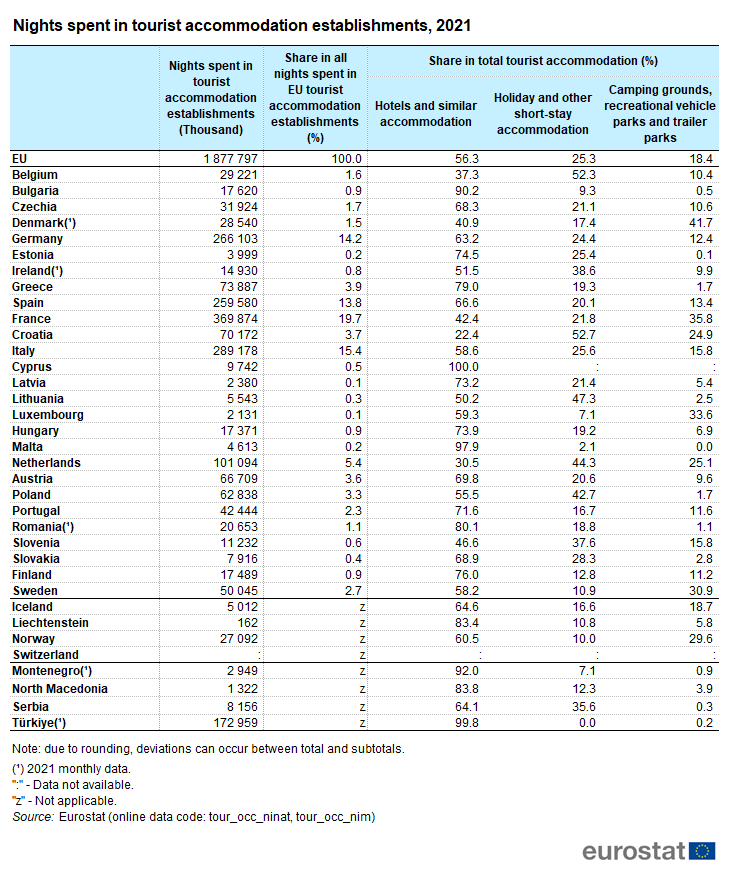
Nights spent in tourist accommodation establishments, 2021.png
(
file
)
77 KB
1
17:51, 25 October 2022
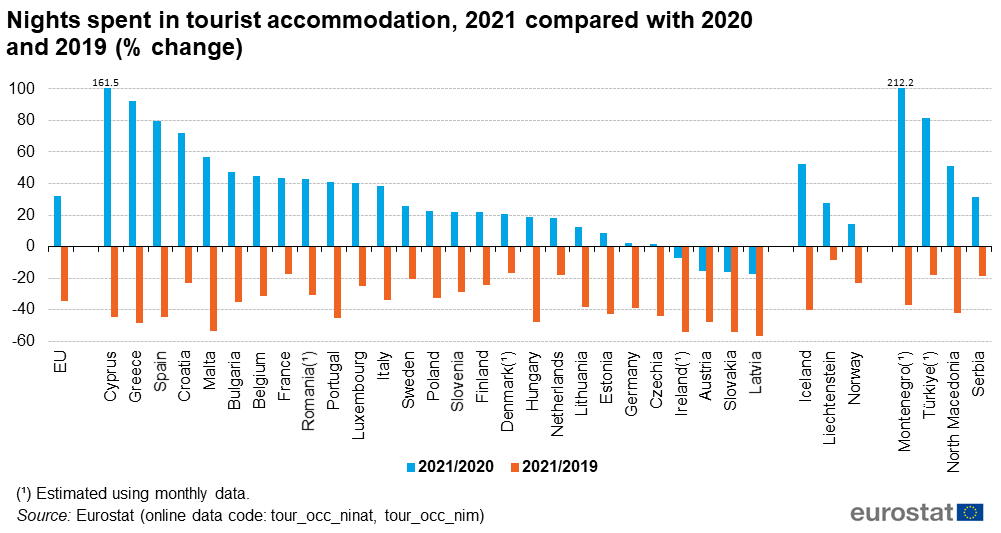
Nights spent in tourist accommodation, 2021 compared with 2020 and 2019 (% change).png
(
file
)
64 KB
1
17:50, 25 October 2022
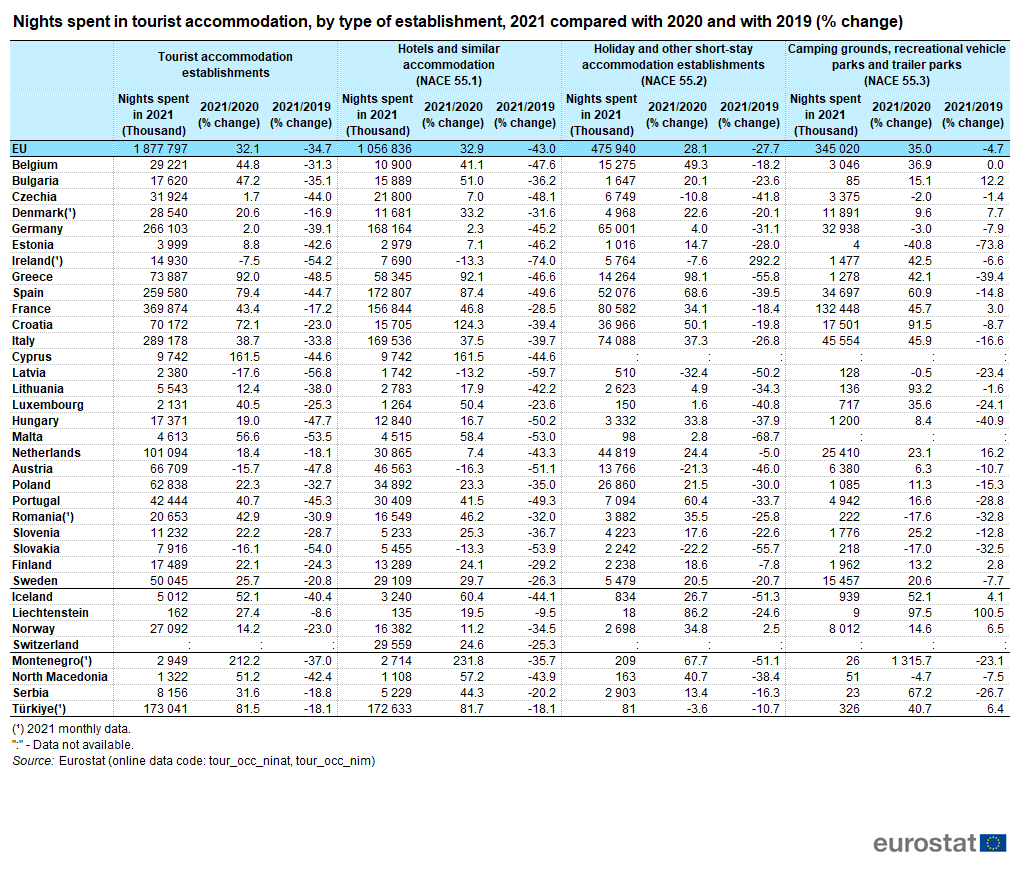
Nights spent in tourist accommodation, by type of establishment, 2021 compared with 2020 and with 2019 (% change).png
(
file
)
117 KB
1
17:50, 25 October 2022
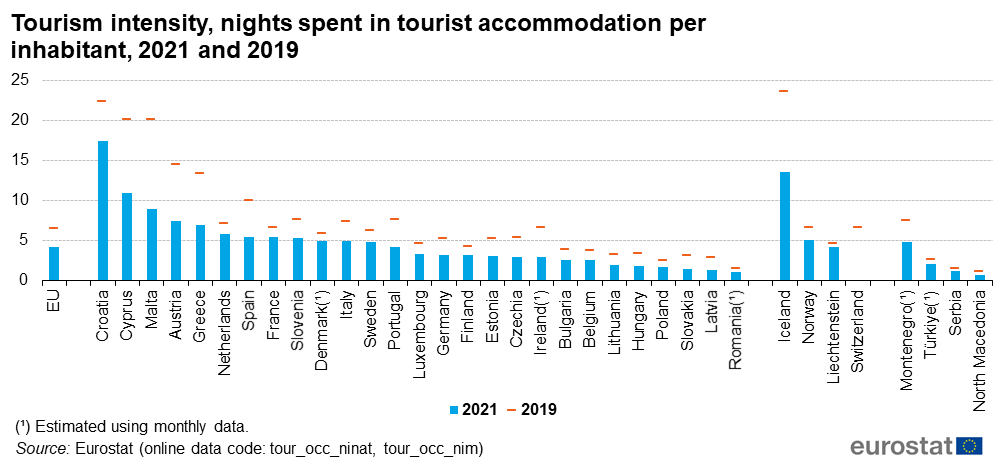
Tourism intensity, nights spent in tourist accommodation per inhabitant, 2021 and 2019.png
(
file
)
48 KB
1
17:50, 25 October 2022
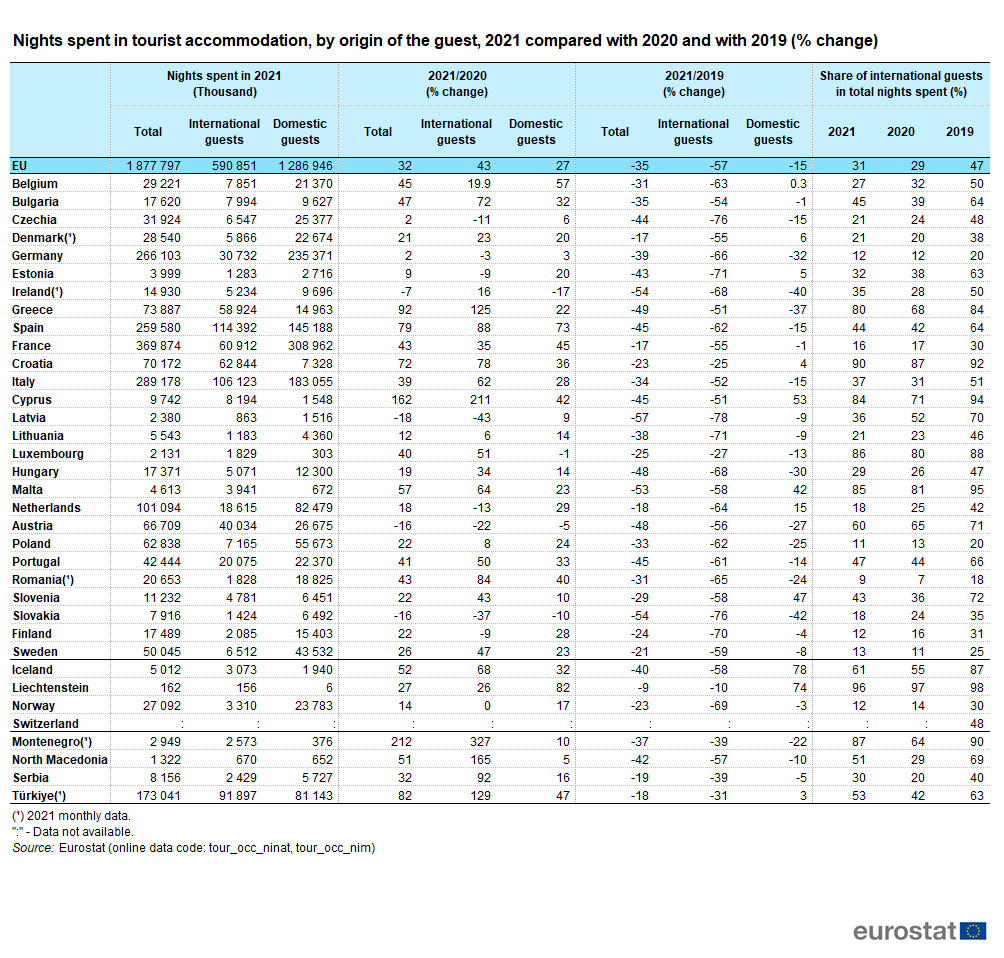
Nights spent in tourist accommodation, by origin of the guest, 2021 compared with 2020 and with 2019 (% change).png
(
file
)
103 KB
1
17:49, 25 October 2022
Nights spent by international guests in tourist accommodation, 2020 and 2021 compared with 2019 (2019=100) .png
(
file
)
54 KB
1
17:49, 25 October 2022
Nights spent by domestic guests in tourist accommodation, 2020 and 2021 compared with 2019 (2019=100) .png
(
file
)
61 KB
1
17:49, 25 October 2022
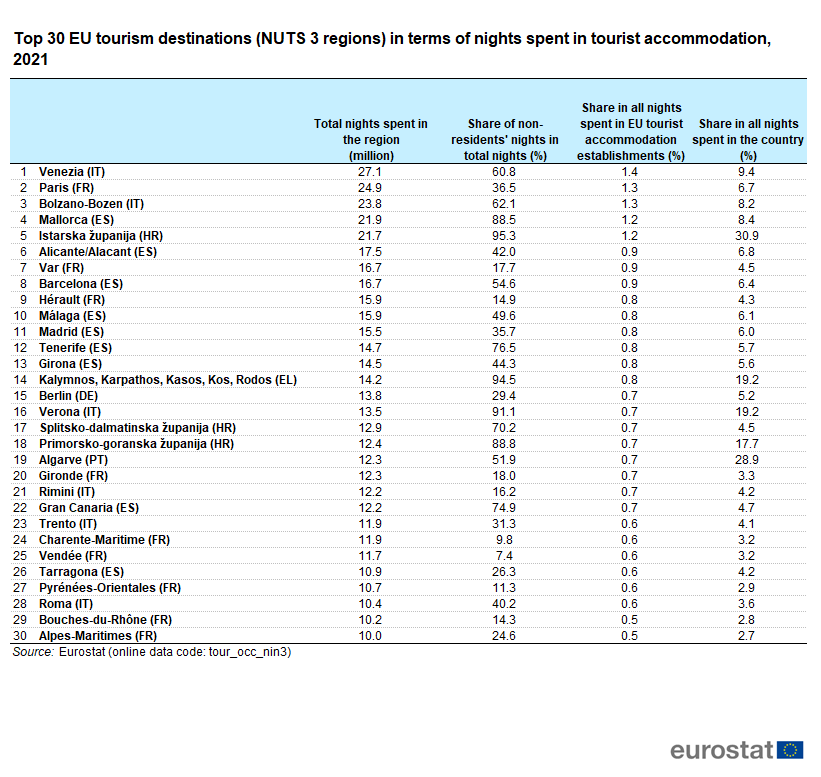
Top 30 EU tourism destinations (NUTS 3 regions) in terms of nights spent in tourist accommodation, 2021.png
(
file
)
64 KB
1
17:48, 25 October 2022
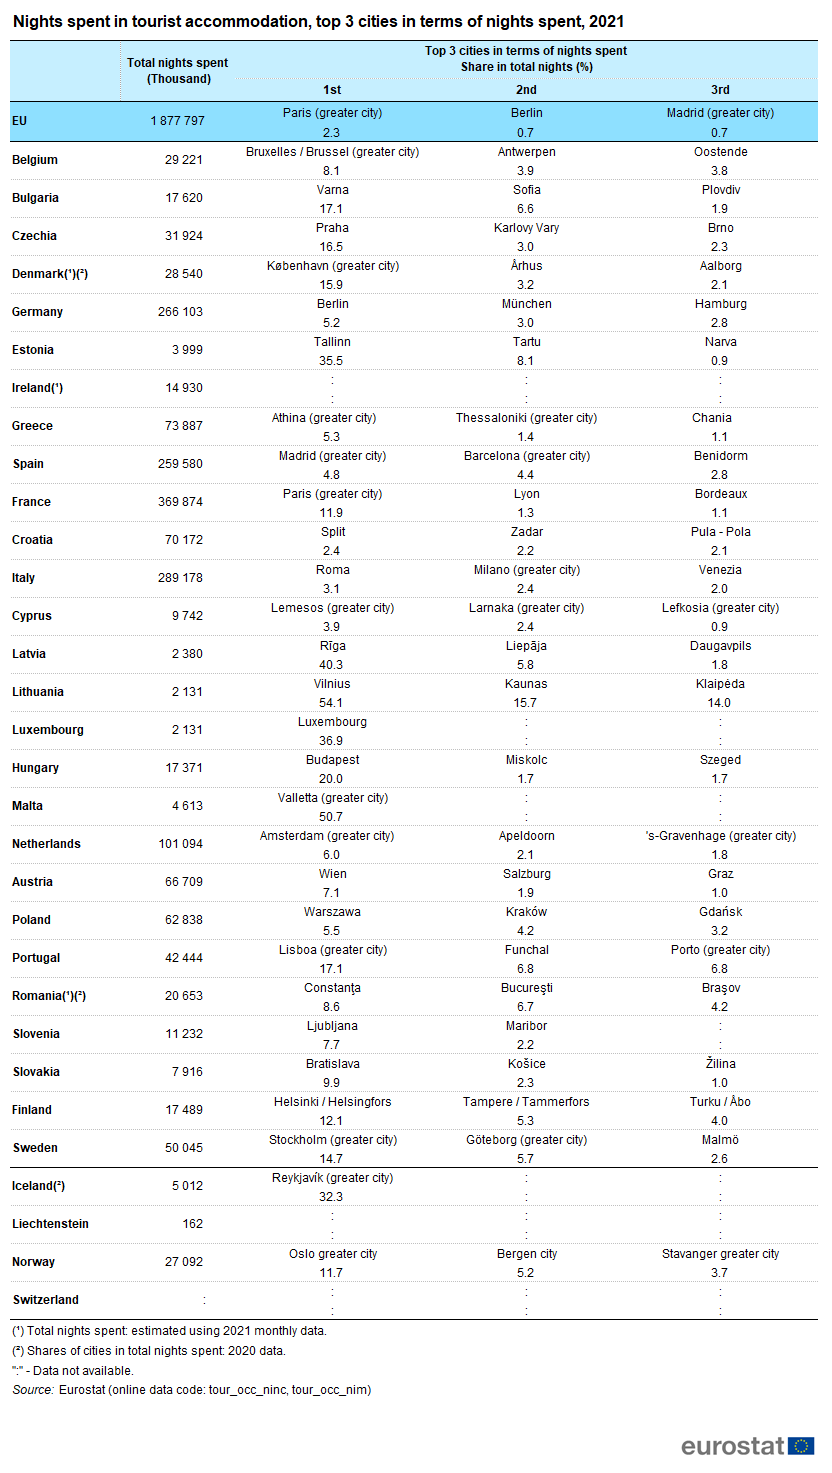
Nights spent in tourist accommodation, top 3 cities in terms of nights spent, 2021.png
(
file
)
101 KB
1
17:48, 25 October 2022
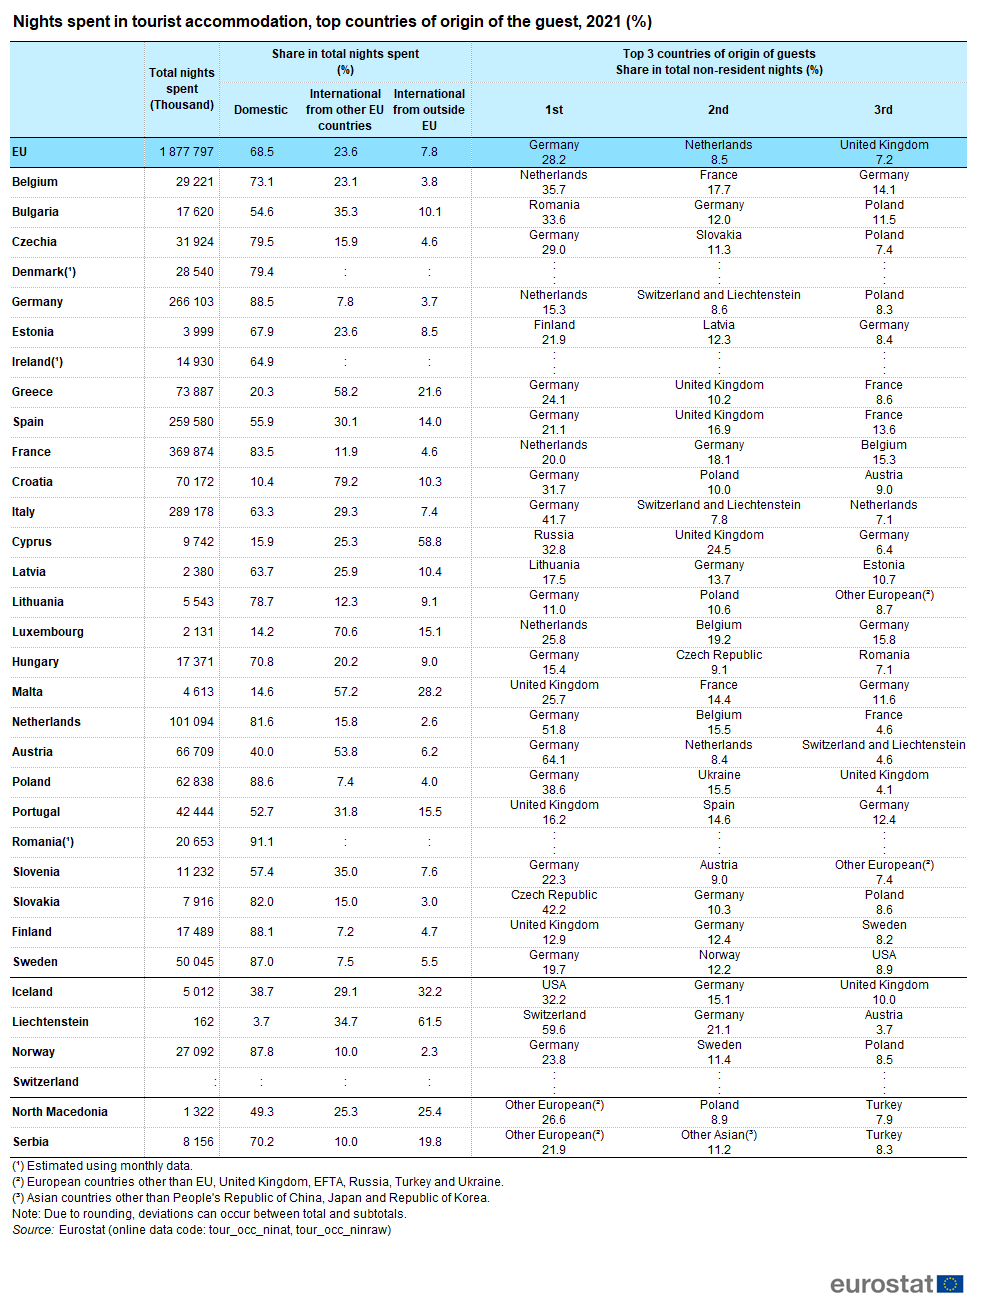
Nights spent in tourist accommodation, top countries of origin of the guest, 2021 (%).png
(
file
)
129 KB
1
17:47, 25 October 2022
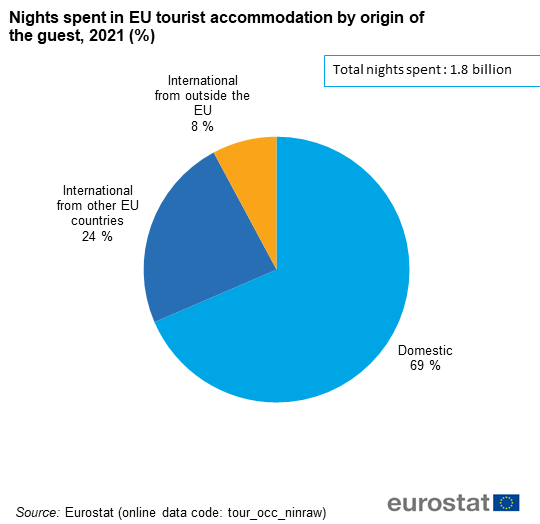
Nights spent in EU tourist accommodation by origin of the guest, 2021 (%).png
(
file
)
27 KB
1
17:47, 25 October 2022
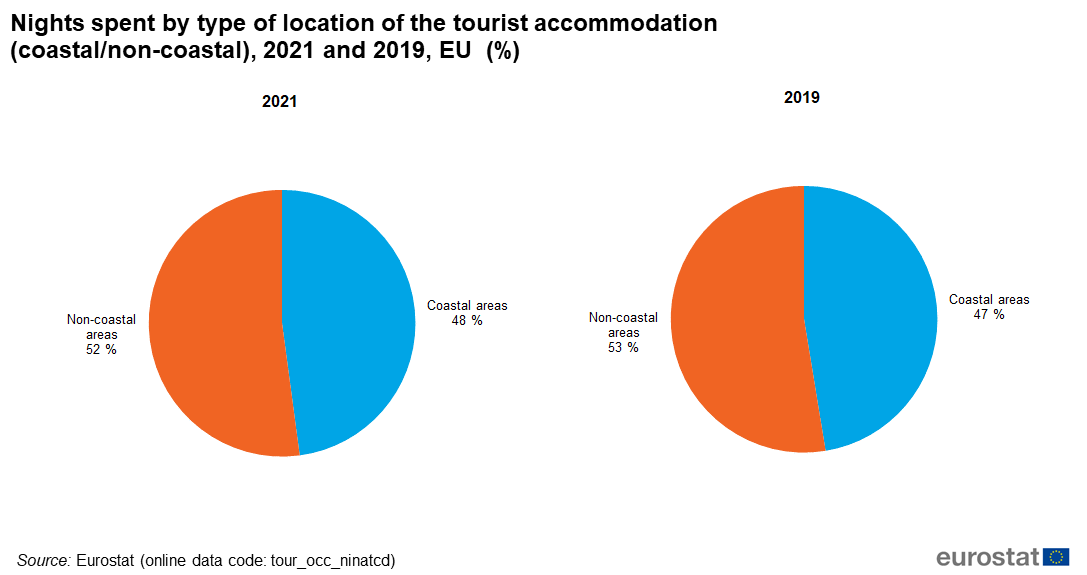
Nights spent by type of location of the tourist accommodation (coastal non-coastal), 2021 and 2019, EU (%).png
(
file
)
40 KB
1
17:45, 25 October 2022
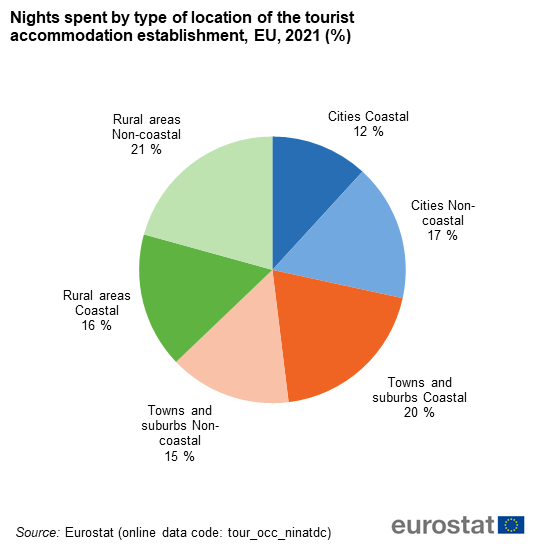
Nights spent by type of location of the tourist accommodation establishment, EU, 2021 (%).png
(
file
)
33 KB
1
17:44, 25 October 2022
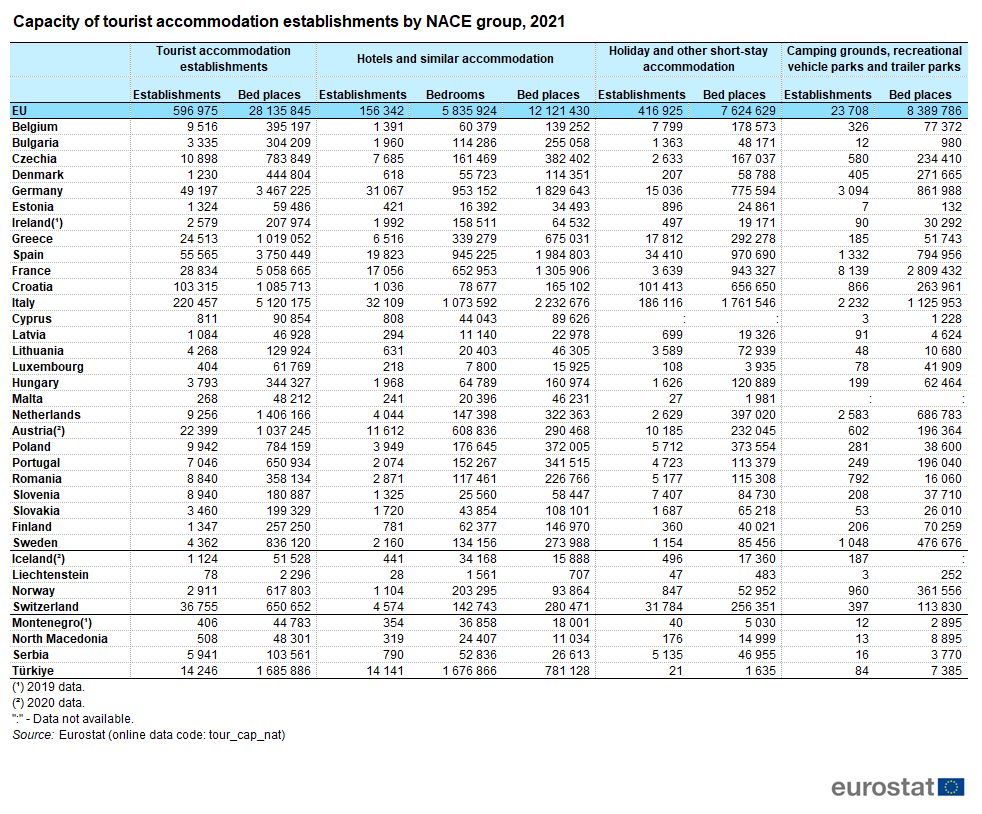
Capacity of tourist accommodation establishments by NACE group, 2021.png
(
file
)
114 KB
1
17:44, 25 October 2022
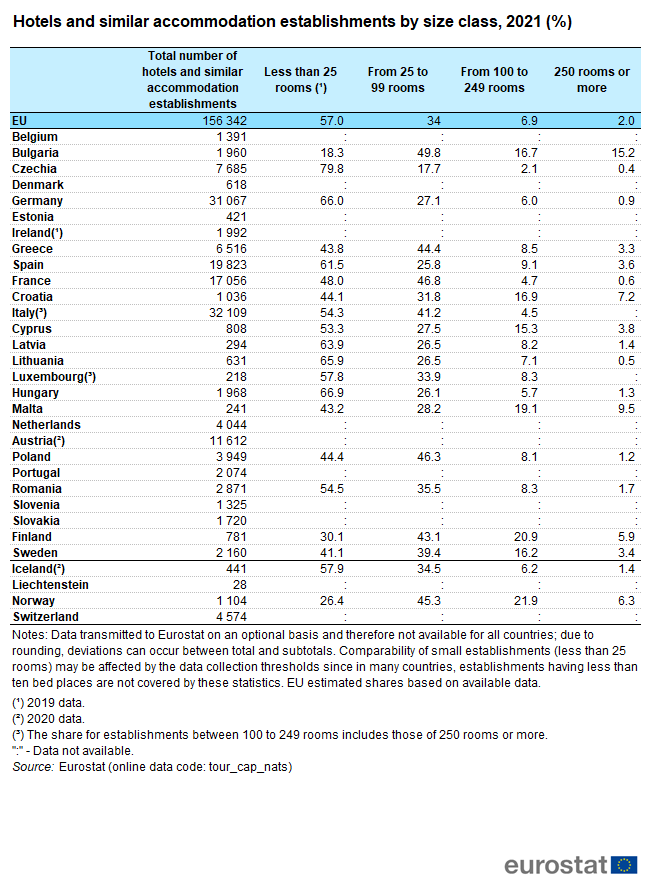
Hotels and similar accommodation establishments by size class, 2021 (%).png
(
file
)
70 KB
1
17:43, 25 October 2022
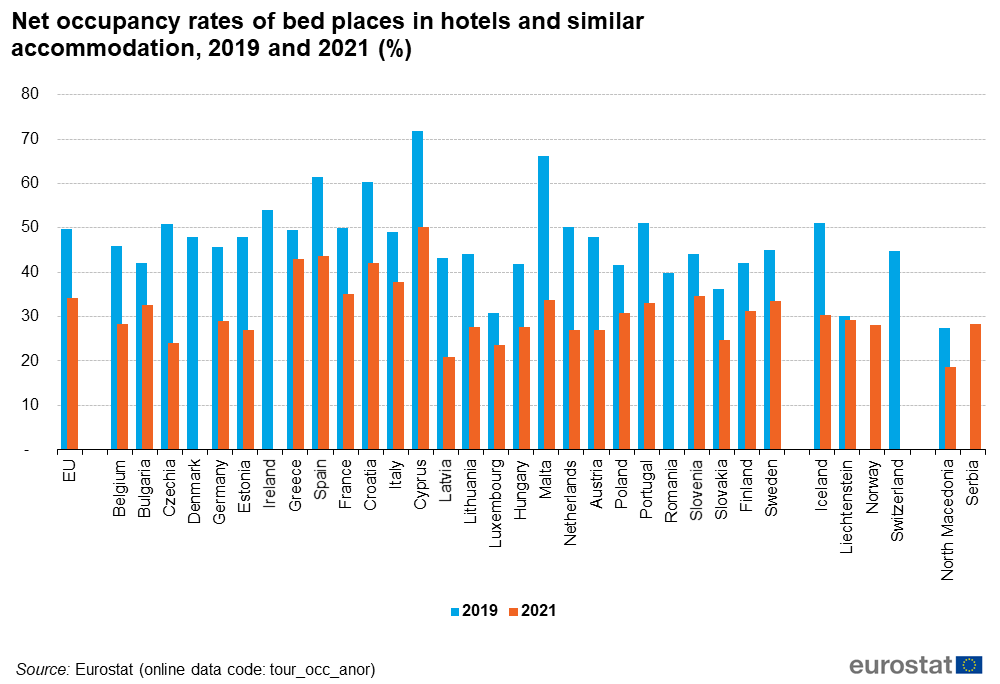
Net occupancy rates of bed places in hotels and similar accommodation, 2019 and 2021 (%).png
(
file
)
83 KB
1
16:10, 22 September 2022
Nights spent JUN 2022.xlsx
(
file
)
67 KB
3
16:09, 22 September 2022
Nights spent in tourist accommodation establishments, EU, January to June 2022 (thousand nights).png
(
file
)
97 KB
2
12:51, 22 September 2022
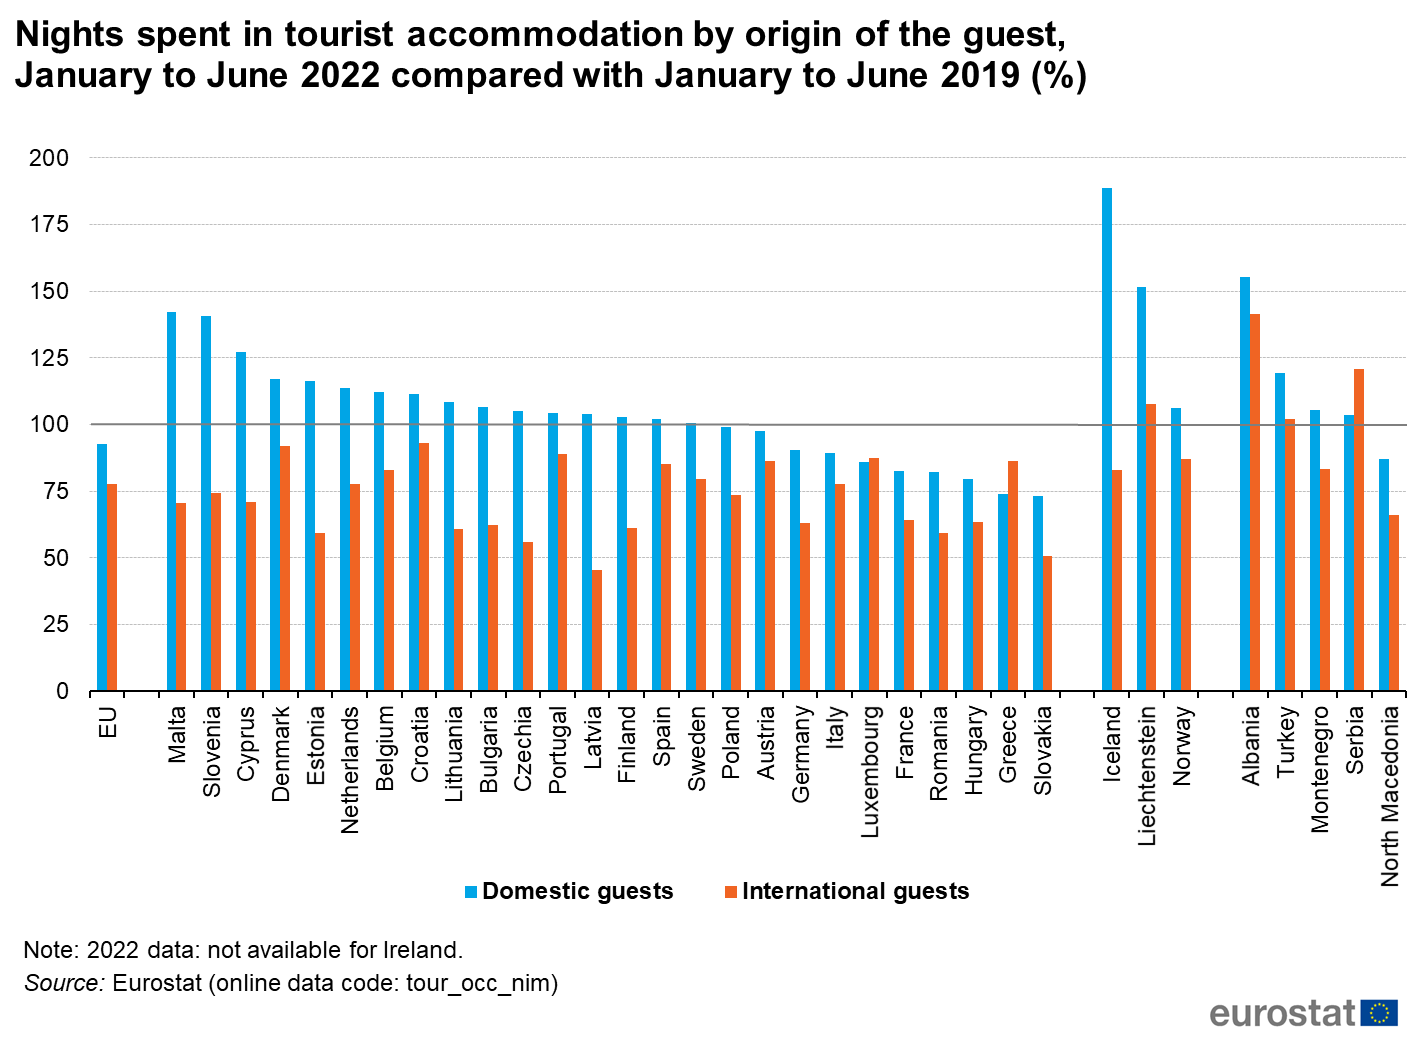
Nights spent in tourist accommodation by origin of the guest, January to June 2022 compared with January to June 2019 (%).png
(
file
)
153 KB
2
First page
Previous page
Next page
Last page
Special page
ISSN 2443-8219
.png)
.png)
.png)
.png)
.png)
_(2019%3D100)_.png)
_(2019%3D100)_.png)
.png)
_(2019%3D100)_.png)
.png)
.png)
.png)

.png)


.png)
,_2021_and_2019,_EU_(%25).png)
.png)
.png)
.png)

.png)
.png)

.png)
_.png)
_.png)
_in_terms_of_nights_spent_in_tourist_accommodation,_2021.png)

.png)
.png)
,_2021_and_2019,_EU_(%25).png)
.png)

.png)
.png)
.png)
.png)