Tutorials
Log in
Statistics Explained
menu
search
search
Navigation
Main page
Statistical themes
Glossary
Categories
Statistics 4 beginners
Tutorials
Help
Eurostat home
Education corner
Online publications
Regional yearbook
Sustainable development
Full list
Tools
User contributions
Logs
View user groups
Special pages
search
Navigation
Main page
Statistical themes
Glossary
Categories
Statistics 4 beginners
Tutorials
Help
Eurostat home
Education corner
Online publications
Regional yearbook
Sustainable development
Full list
Tools
User contributions
Logs
View user groups
Special pages
Navigation
Main page
Statistical themes
Glossary
Categories
Statistics 4 beginners
Tutorials
Help
Eurostat home
Education corner
Online publications
Regional yearbook
Sustainable development
Full list
Tools
User contributions
Logs
View user groups
Special pages
Uploads by Coyetca
This special page shows all uploaded files.
File list
Items per page:
20
50
100
250
500
Search for media name:
Username:
Include old versions of files
Go
First page
Previous page
Next page
Last page
Date
Name
Thumbnail
Size
Description
Versions
10:13, 13 September 2013
UK agricultural census 2010.xls
(
file
)
236 KB
1
10:38, 9 September 2013
HR agricultural census 2010.xls
(
file
)
254 KB
1
16:07, 5 September 2013
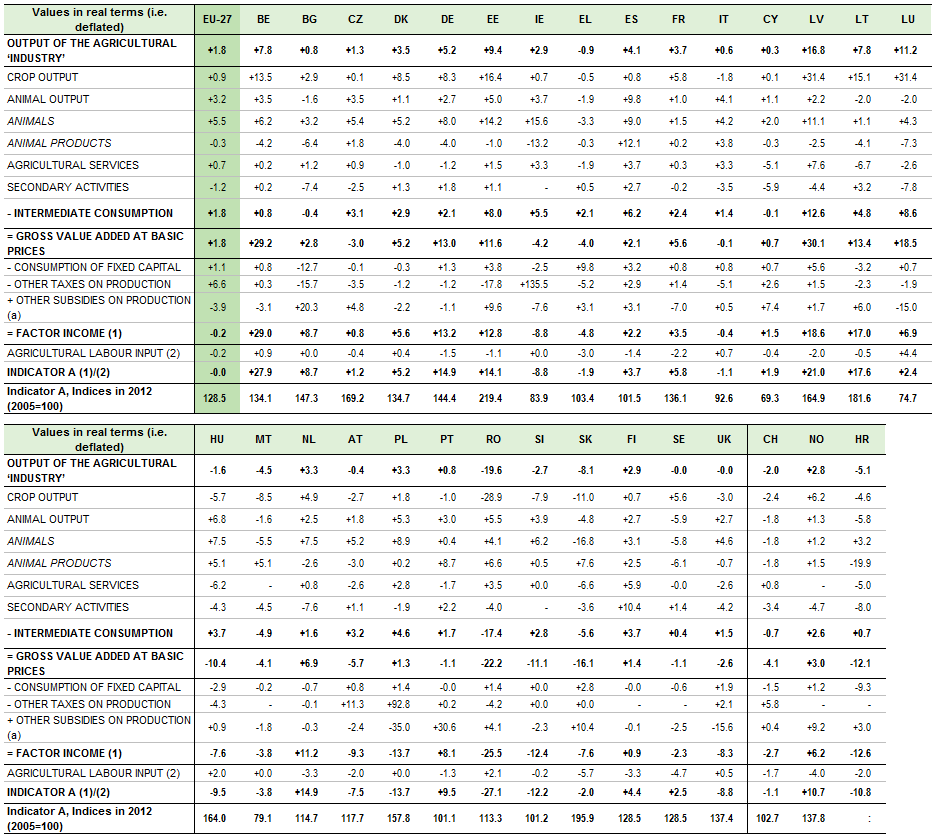
EAA and prices.xls
(
file
)
340 KB
1
08:45, 5 September 2013
Agricultural production - crops.xls
(
file
)
399 KB
2
08:43, 5 September 2013
Distribution of olive production EU-28 2012.PNG
(
file
)
10 KB
2
17:33, 3 September 2013
Agricultural production - animals.xls
(
file
)
1.3 MB
1
17:33, 3 September 2013
Animal slaughtering by species 2012.PNG
(
file
)
25 KB
3
09:26, 3 September 2013
CH2-Agricultural production - crops.xls
(
file
)
399 KB
1
12:16, 2 September 2013
Producer milk price EU-27 2005-2012.PNG
(
file
)
29 KB
1
12:05, 2 September 2013
Cow's milk collected EU-28 2012.PNG
(
file
)
13 KB
1
11:59, 2 September 2013
Utilisation of whole milk EU28 2012.PNG
(
file
)
19 KB
1
11:51, 2 September 2013
Trend in cow's milk collection and products obtained EU 1995-2012.PNG
(
file
)
35 KB
1
11:41, 2 September 2013
Milk collection and dairy production 2012.PNG
(
file
)
31 KB
1
11:31, 2 September 2013
Cow's milk apparent yield 2011.PNG
(
file
)
51 KB
1
11:20, 2 September 2013
Cattle slaughtering by animal category EU28 2012.PNG
(
file
)
21 KB
1
11:16, 2 September 2013
Cattle slaughtering by animal category 2012.PNG
(
file
)
29 KB
1
10:02, 2 September 2013
Meat of bovine animals price and production EU27 2005-2013.PNG
(
file
)
17 KB
1
09:54, 2 September 2013
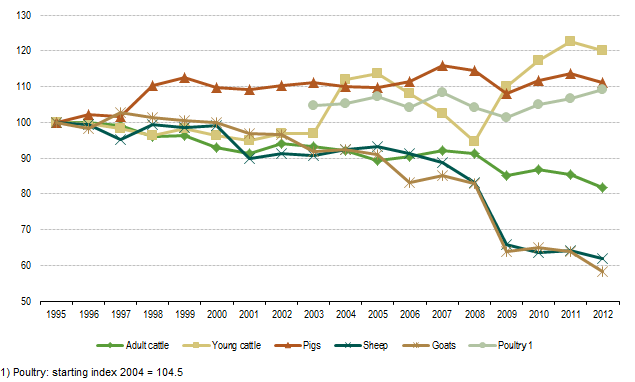
Slaughter index (in weight) by species EU27 1995-2012.PNG
(
file
)
31 KB
1
09:47, 2 September 2013
Slaughter by Member States EU27 2012.PNG
(
file
)
41 KB
1
09:22, 30 August 2013
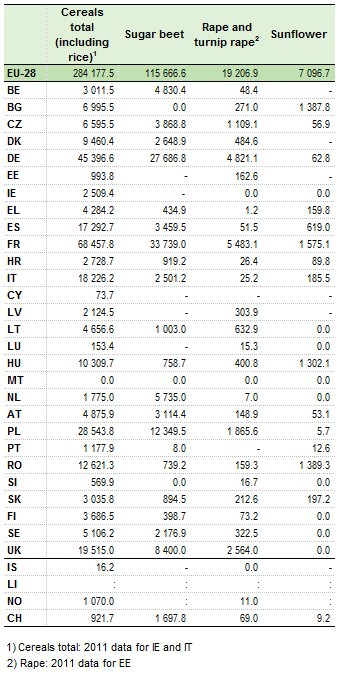
Harvested production of the most important cereals 2012.PNG
(
file
)
25 KB
2
09:18, 30 August 2013
Harvested production of some of the main crops 2012.PNG
(
file
)
26 KB
1
16:14, 29 August 2013
Agricultural land use EU-28 2011.PNG
(
file
)
23 KB
1
16:10, 29 August 2013
Share of UAA out of total area EU-28 2011.PNG
(
file
)
20 KB
1
15:57, 29 August 2013
Share of grape production (all grapes) between Member States 2012.PNG
(
file
)
10 KB
1
15:52, 29 August 2013
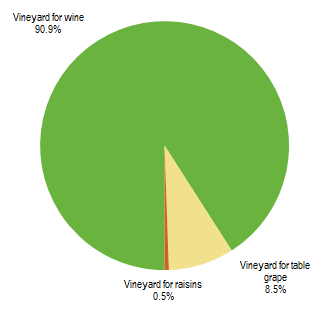
Allocation of the grape production EU-28 2012.PNG
(
file
)
9 KB
1
15:46, 29 August 2013
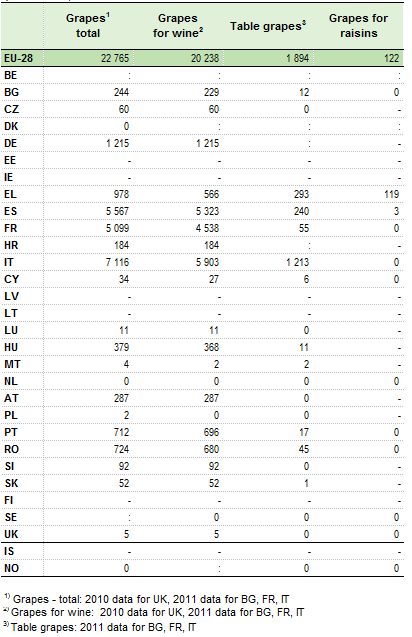
Grape production EU-28 2012.PNG
(
file
)
20 KB
1
15:41, 29 August 2013
Harvested production of some fruits and vegetables 2012.PNG
(
file
)
27 KB
1
15:36, 29 August 2013
Harvested production of cereals by type of cereal EU-28 2012.PNG
(
file
)
13 KB
1
15:33, 29 August 2013
Share of cereal production between Member States 2012.PNG
(
file
)
16 KB
1
15:28, 29 August 2013
Evolution of the rye and rice production EU28 2006-2012.PNG
(
file
)
9 KB
1
15:22, 29 August 2013
Evolution of the wheat barley and grain maize production EU28 2012.PNG
(
file
)
10 KB
1
14:59, 29 August 2013
Share of main crop production between Member States 2012.PNG
(
file
)
14 KB
1
14:55, 29 August 2013
Evolution of the rape and turnip rape and sunflower production EU-28 2006-2012.PNG
(
file
)
9 KB
1
14:50, 29 August 2013
Evolution of cereal and sugar beet production EU28 2006 2012.PNG
(
file
)
9 KB
1
14:44, 29 August 2013
Harversted production of some of the main crops 2012.PNG
(
file
)
24 KB
1
11:34, 29 August 2013
Livestock numbers EU27 1995 2012.PNG
(
file
)
16 KB
1
10:43, 30 July 2013
SK agricultural census 2010.xls
(
file
)
271 KB
1
10:40, 30 July 2013
SK-agricultural censu 2010.xls
(
file
)
271 KB
1
15:01, 23 July 2013
Figure Livestock by main types DK 2000 and 2010.PNG
(
file
)
10 KB
2
11:26, 23 July 2013
RO-agricultural census 2010.xls
(
file
)
234 KB
1
11:25, 23 July 2013
Figure Livestock by main types RO 2000 and 2010.PNG
(
file
)
12 KB
2
10:29, 12 July 2013
Table Number of holdings with cattle and places by type of animal housing HU 2010.PNG
(
file
)
13 KB
1
11:45, 11 July 2013
Figure Livestock by main types BG 2003 and 2010.PNG
(
file
)
14 KB
3
11:10, 8 July 2013
Agricultural income 2012 tables and graphs.xls
(
file
)
3.76 MB
1
10:58, 8 July 2013
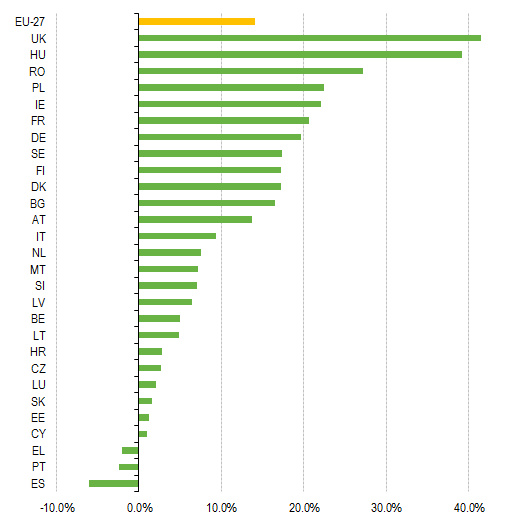
Main components of agricultural income, EU-27, 2012 vs.2011 (% change compared with previous year).png
(
file
)
85 KB
2
09:56, 8 July 2013
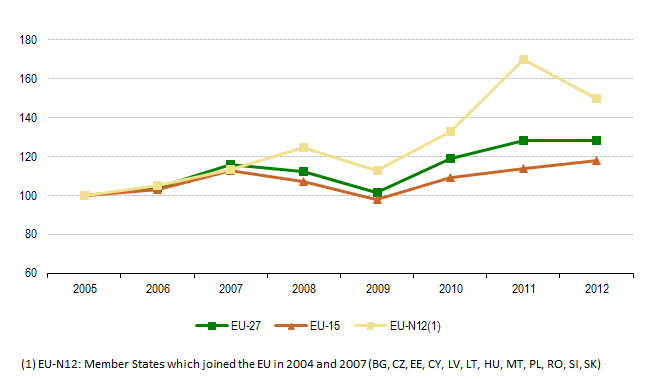
Trends in EU agricultural income per work unit, Indicator A,( 2005=100).png
(
file
)
19 KB
Reverted to version as of 07:51, 8 July 2013
5
09:50, 8 July 2013
Trends in EU agricultural income per work unit, Indicator A, 2005-2012.png
(
file
)
25 KB
3
12:12, 21 June 2013
Annual selling prices of agricultural products 2012.PNG
(
file
)
26 KB
1
12:02, 21 June 2013
Deflated price indices of means of agricultural production 2012.PNG
(
file
)
18 KB
1
11:59, 21 June 2013
Deflated price indices of agricultural output 2012.PNG
(
file
)
17 KB
1
First page
Previous page
Next page
Last page
Special page
ISSN 2443-8219


_by_species_EU27_1995-2012.PNG)


_between_Member_States_2012.PNG)


.png)
.png)


