Tutorials
Log in
Statistics Explained
menu
search
search
Navigation
Main page
Statistical themes
Glossary
Categories
Statistics 4 beginners
Tutorials
Help
Eurostat home
Education corner
Online publications
Regional yearbook
Sustainable development
Full list
Tools
User contributions
Logs
View user groups
Special pages
search
Navigation
Main page
Statistical themes
Glossary
Categories
Statistics 4 beginners
Tutorials
Help
Eurostat home
Education corner
Online publications
Regional yearbook
Sustainable development
Full list
Tools
User contributions
Logs
View user groups
Special pages
Navigation
Main page
Statistical themes
Glossary
Categories
Statistics 4 beginners
Tutorials
Help
Eurostat home
Education corner
Online publications
Regional yearbook
Sustainable development
Full list
Tools
User contributions
Logs
View user groups
Special pages
Uploads by Berenso
This special page shows all uploaded files.
File list
Items per page:
20
50
100
250
500
Search for media name:
Username:
Include old versions of files
Go
First page
Previous page
Next page
Last page
Date
Name
Thumbnail
Size
Description
Versions
20:00, 1 June 2021
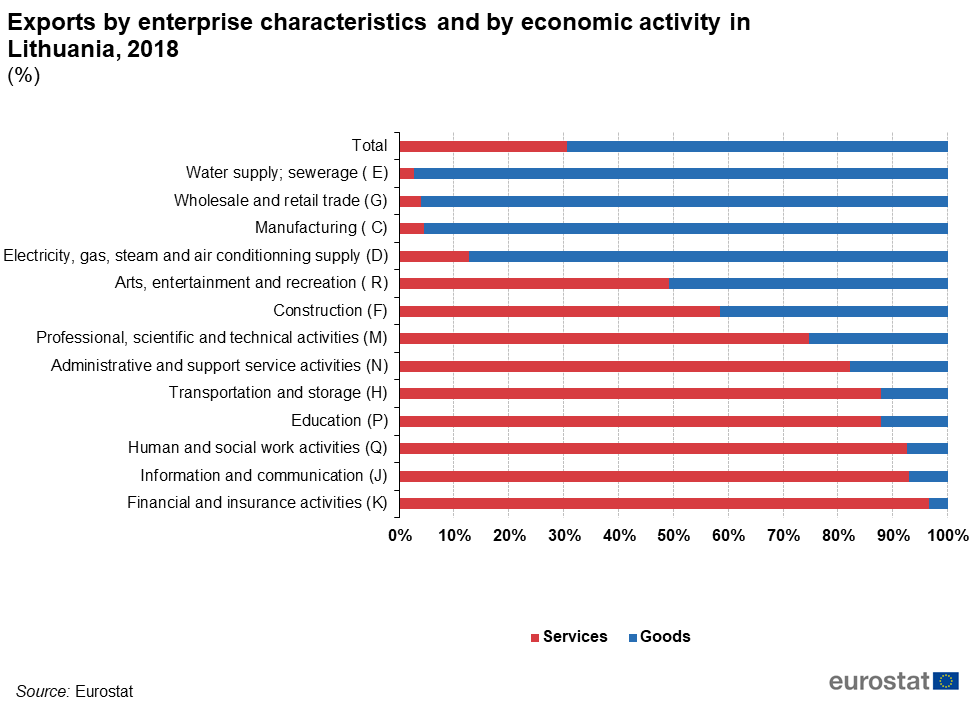
7 Exports by enterprise characteristics and by economic activity in Lithuania, 2018 (%).png
(
file
)
52 KB
1
19:56, 1 June 2021
4Services trade by enterprise ownership and country, partner rest of the world , Imports (%, from total linked enterprises).png
(
file
)
59 KB
1
19:55, 1 June 2021
3Services trade by enterprise ownership and country, partner rest of the world , Exports (%, from total linked enterprises).png
(
file
)
58 KB
1
19:50, 1 June 2021
3 Services trade by enterprise ownership and country, partner rest of the world , Exports (%, from total linked enterprises).png
(
file
)
54 KB
1
19:17, 1 June 2021
8b Services exports intensity by main NACE Rev2 activities and countries, partner rest of the world.png
(
file
)
64 KB
1
19:12, 1 June 2021
F9 Services exports intensity by main NACE Rev2 activities and countries, partner rest of the world.png
(
file
)
72 KB
2
13:09, 1 June 2021
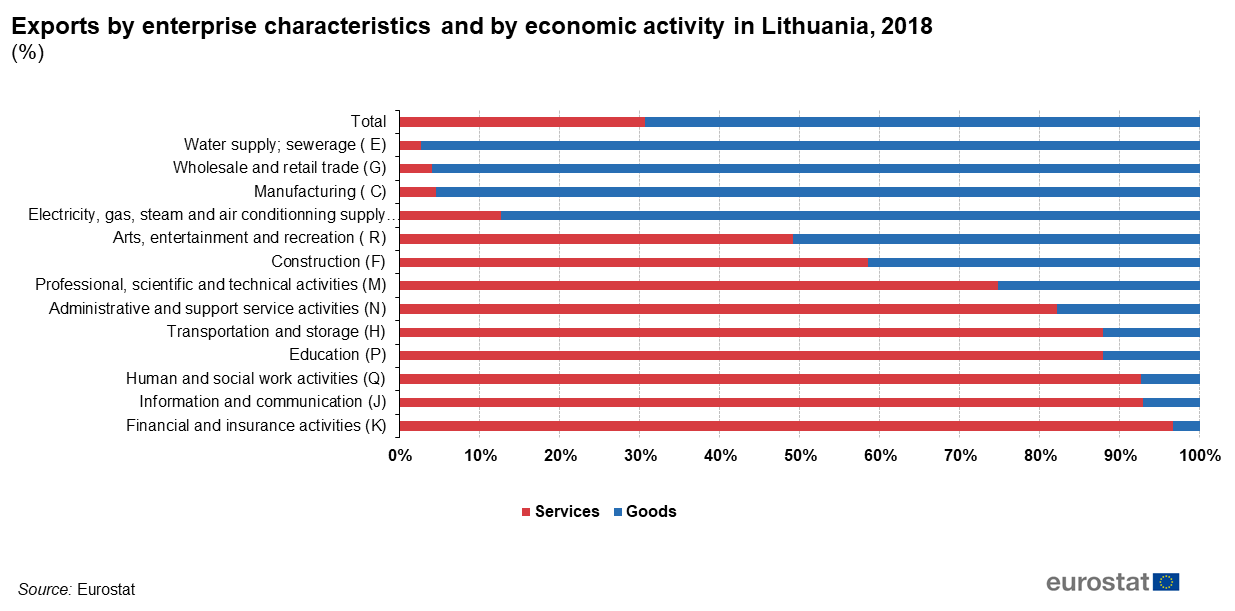
F8 Exports by enterprise characteristics and by economic activity in Lithuania, 2018 (%).png
(
file
)
52 KB
1
13:07, 1 June 2021
F7 Services exports by economic activity of the enterprise, partner rest of the world (%).png
(
file
)
141 KB
1
13:03, 1 June 2021
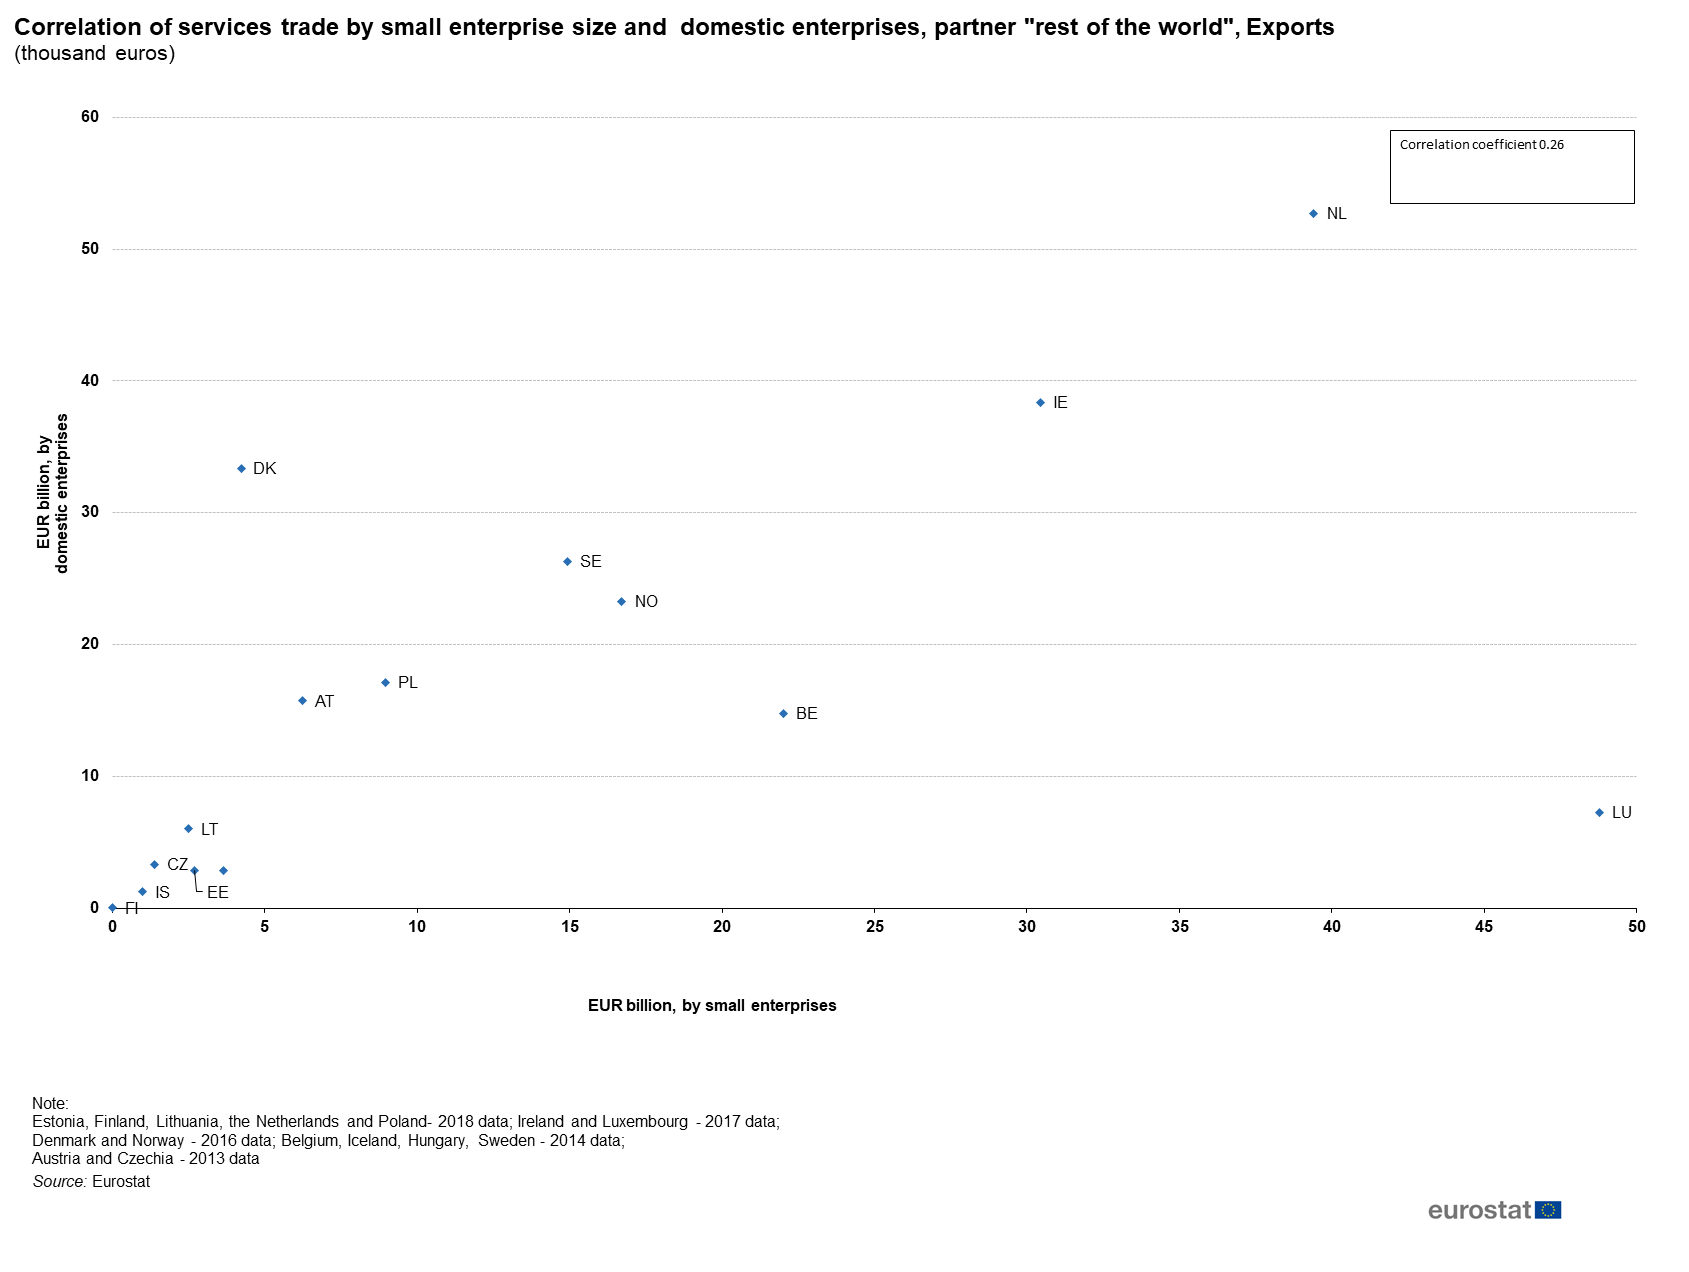
F6 Correlation of services trade by small enterprise size and domestic enterprises, partner rest of the world , Exports (thousand euros).png
(
file
)
62 KB
1
13:01, 1 June 2021
F5 Services trade by enterprise ownership and country, partner rest of the world , Imports (%, from total linked enterprises).png
(
file
)
58 KB
1
12:58, 1 June 2021
F4 Services trade by enterprise ownership and country, partner rest of the world , Exports (%, from total linked enterprises).png
(
file
)
57 KB
1
12:56, 1 June 2021
F3 Services trade by enterprise size class and country, partner rest of the world , Imports (%).png
(
file
)
108 KB
1
12:51, 1 June 2021
F2 Services trade by enterprise size class and country, partner rest of the world , Exports (%).png
(
file
)
87 KB
1
12:31, 1 June 2021
F1 STEC data availability.png
(
file
)
20 KB
1
19:07, 23 April 2021
F7 Trading partners' share of EU international trade in services with non-member countries (extra-EU), 2019 (%).png
(
file
)
240 KB
1
19:05, 23 April 2021
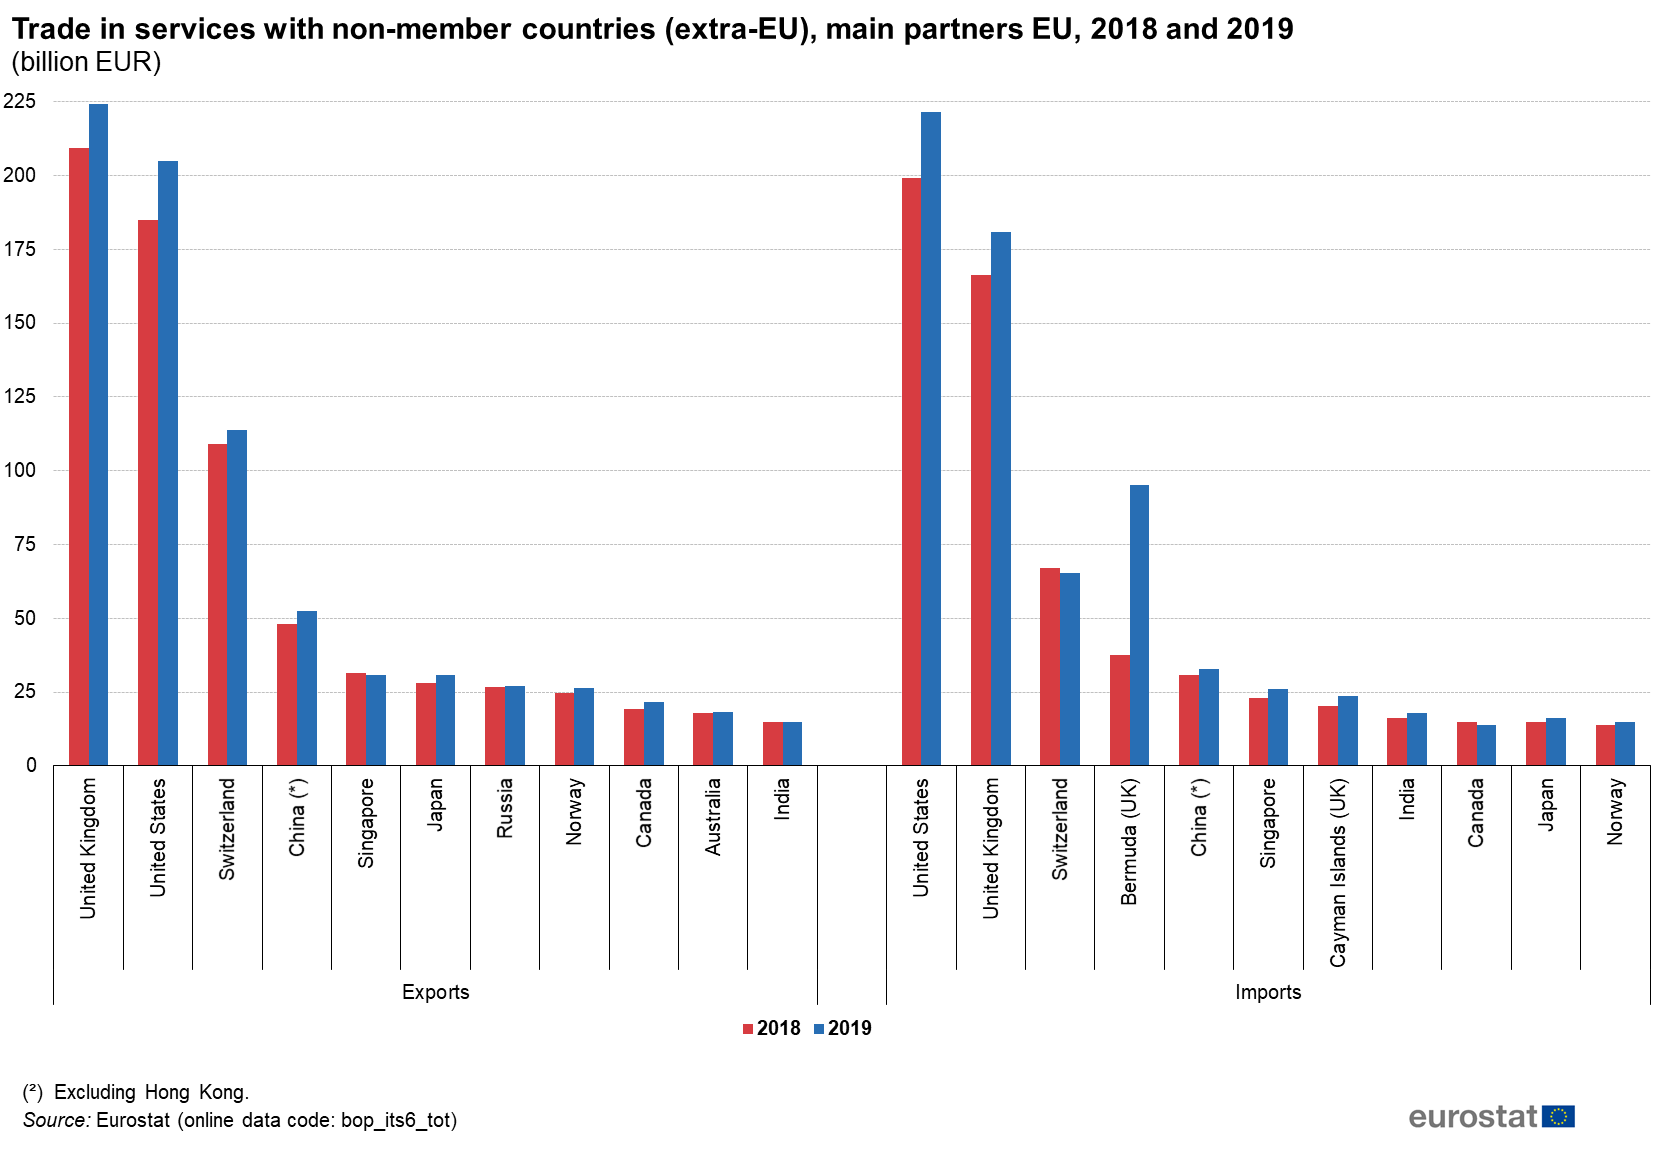
F6 Trade in services with non-member countries (extra-EU), main partners EU, 2018 and 2019 (billion EUR).png
(
file
)
130 KB
1
19:04, 23 April 2021
F5 Distribution of intra-EU and extra-EU trade (exports plus imports) in services 2019 (%).png
(
file
)
150 KB
1
19:03, 23 April 2021
F4 Share of EU Member States in international trade in services within the EU (intra-EU), 2019 (% of EU total).png
(
file
)
188 KB
1
19:01, 23 April 2021
F3 Share of EU Member States in international trade in services with non-member countries (extra-EU), 2019 (% of EU total).png
(
file
)
190 KB
1
18:58, 23 April 2021
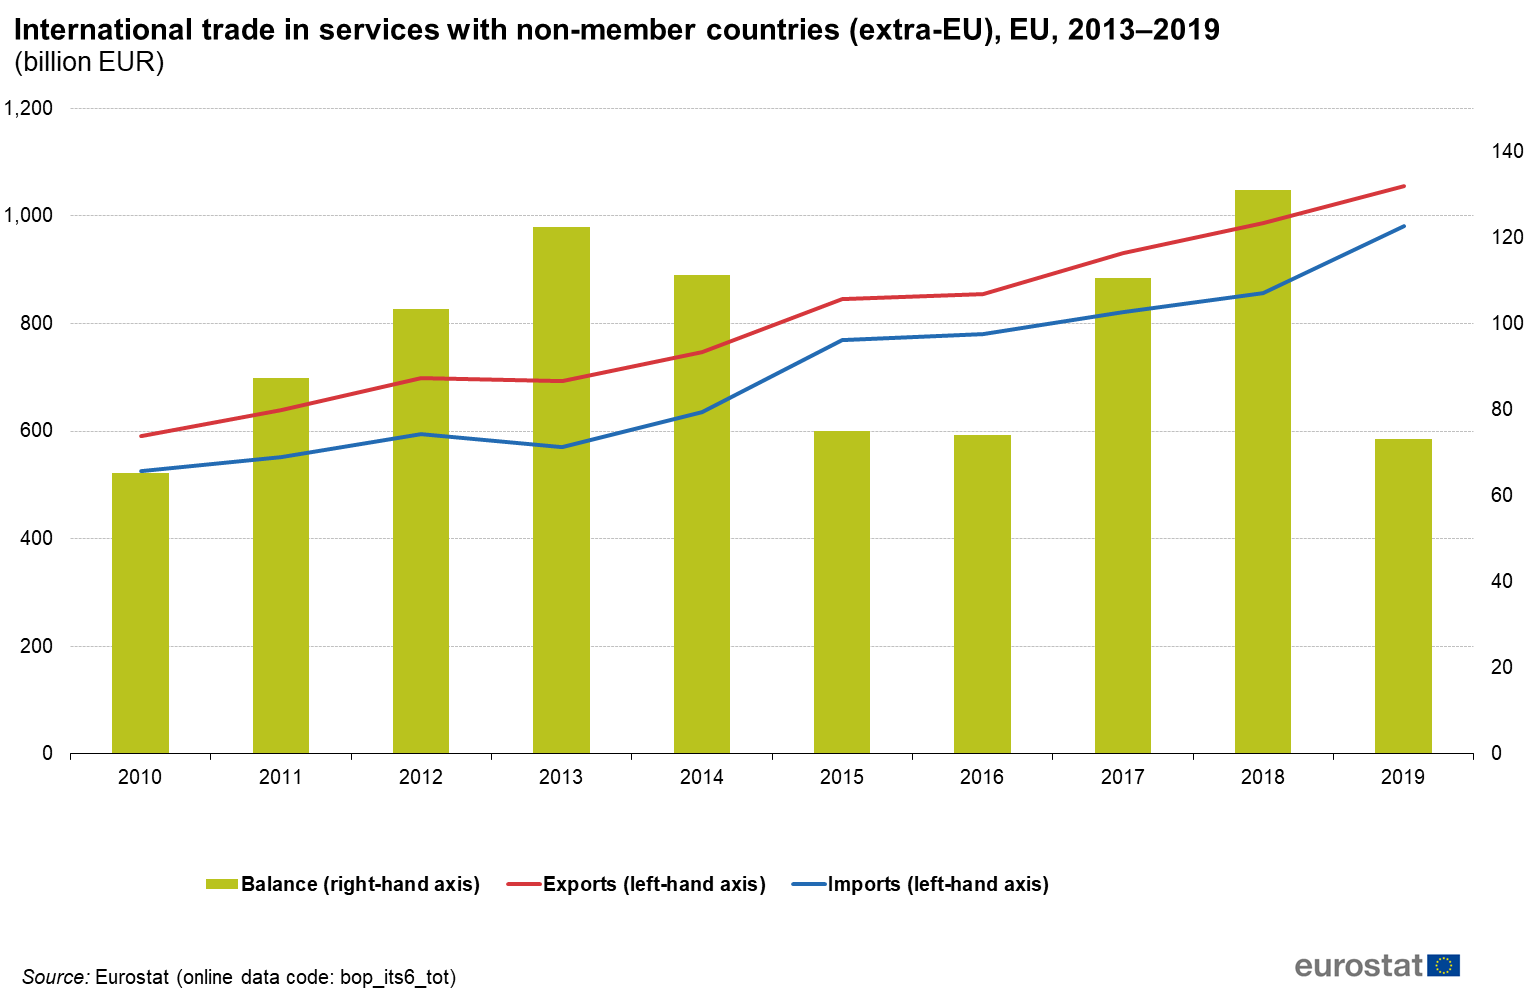
F2 International trade in services with non-member countries (extra-EU) EU 2013–2019 (billion EUR).png
(
file
)
99 KB
1
18:55, 23 April 2021
F1 Annual change in international trade (exports plus imports) with non-member countries (extra-EU) EU 2000–2019 (%).png
(
file
)
71 KB
1
17:48, 23 March 2021
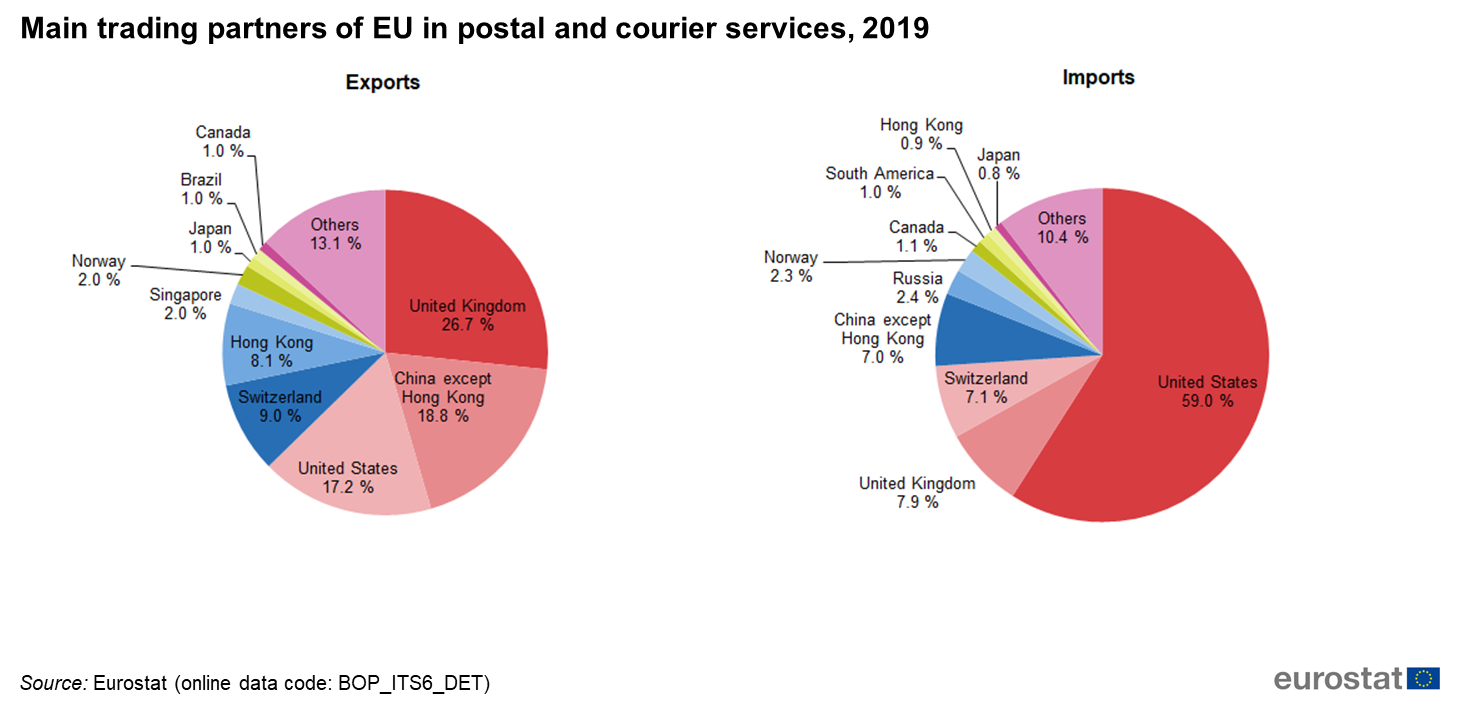
Main trading partners of EU in postal and courier services, 2019.png
(
file
)
226 KB
1
17:47, 23 March 2021
Main trading partners of EU in other modes of transport services, 2019.png
(
file
)
235 KB
1
17:45, 23 March 2021
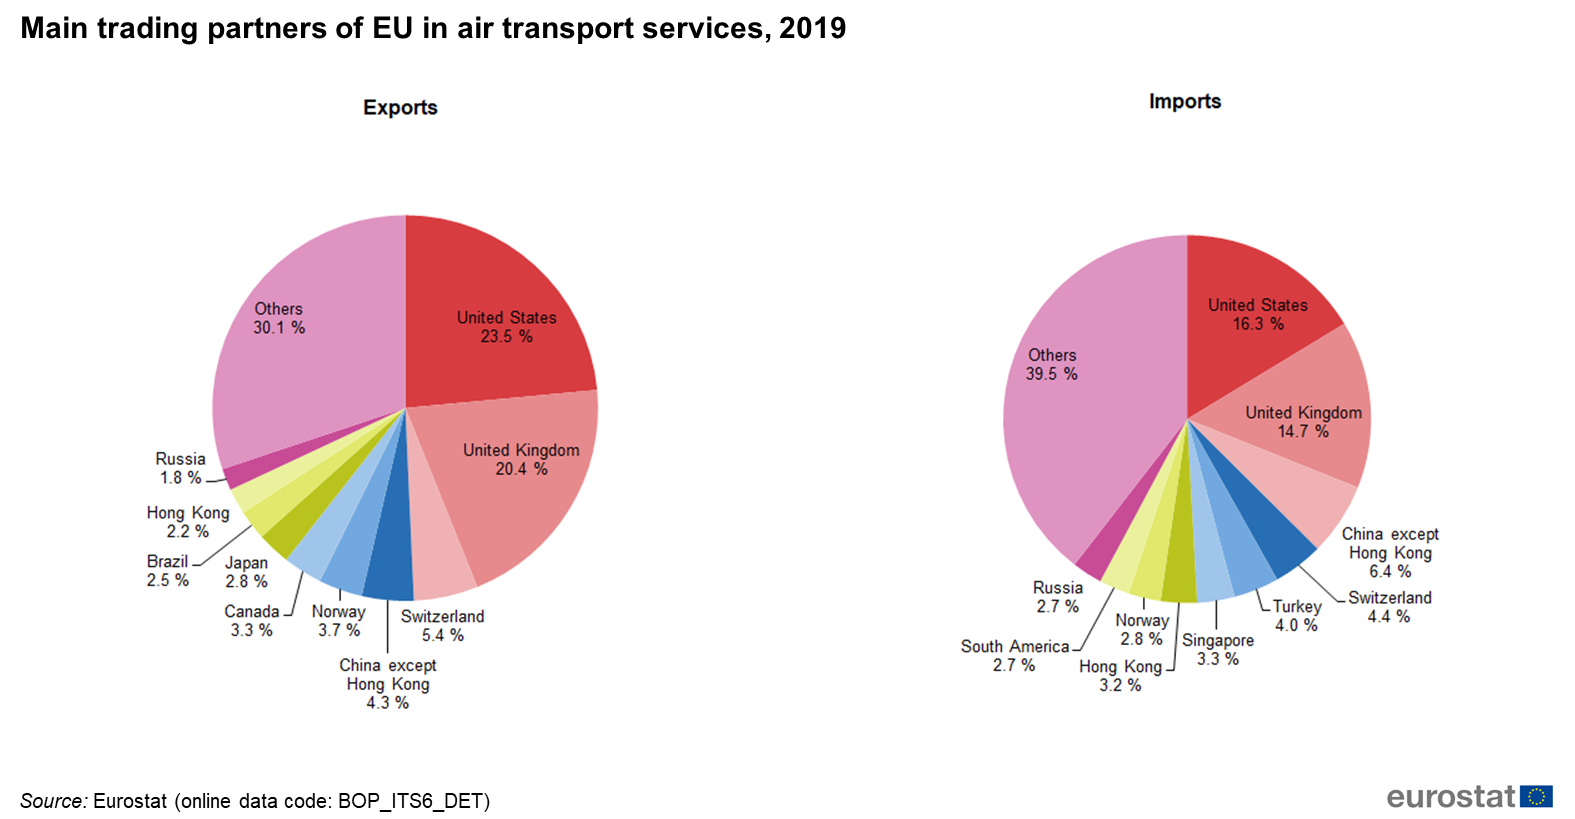
Main trading partners of EU in air transport services, 2019.png
(
file
)
237 KB
1
17:44, 23 March 2021
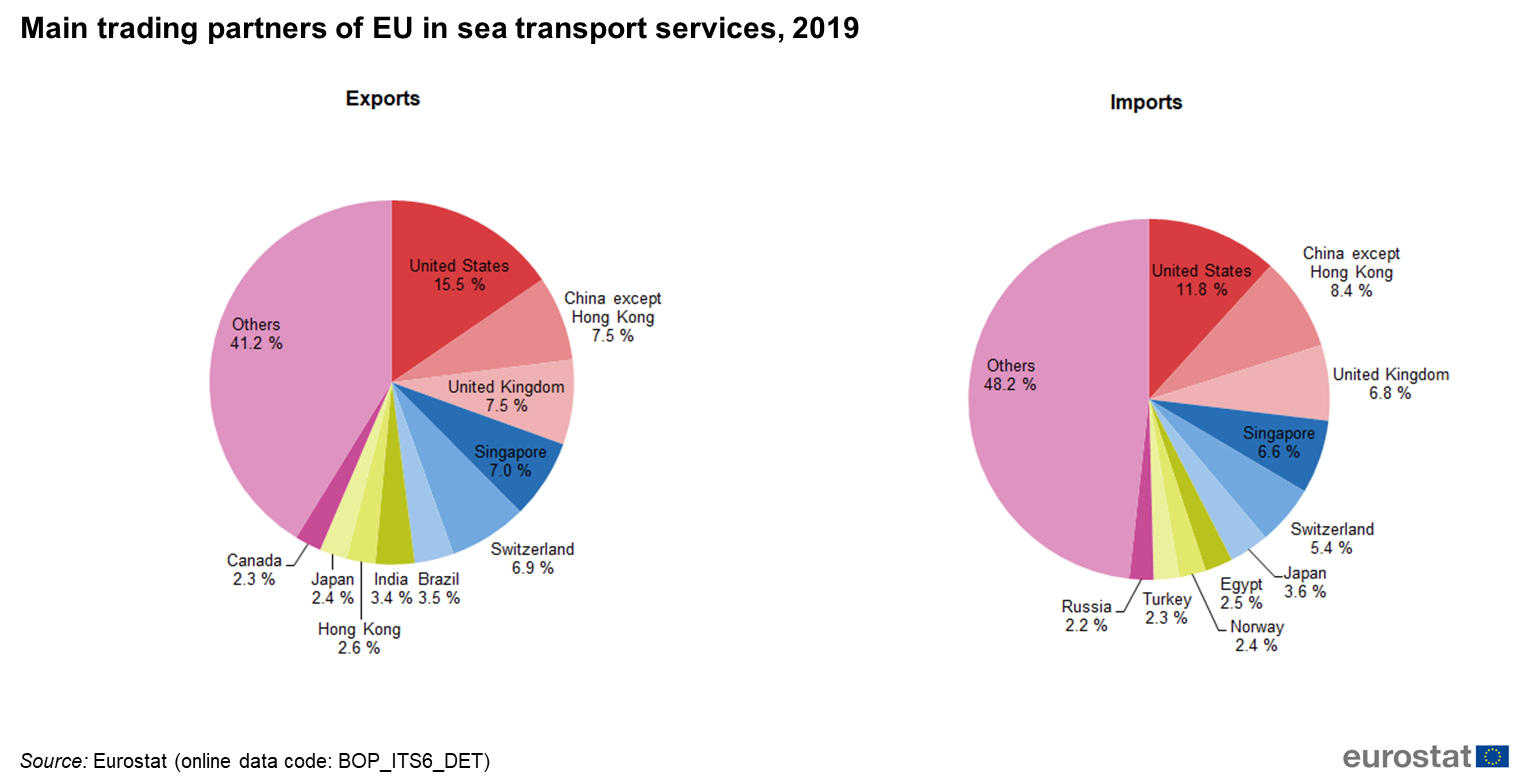
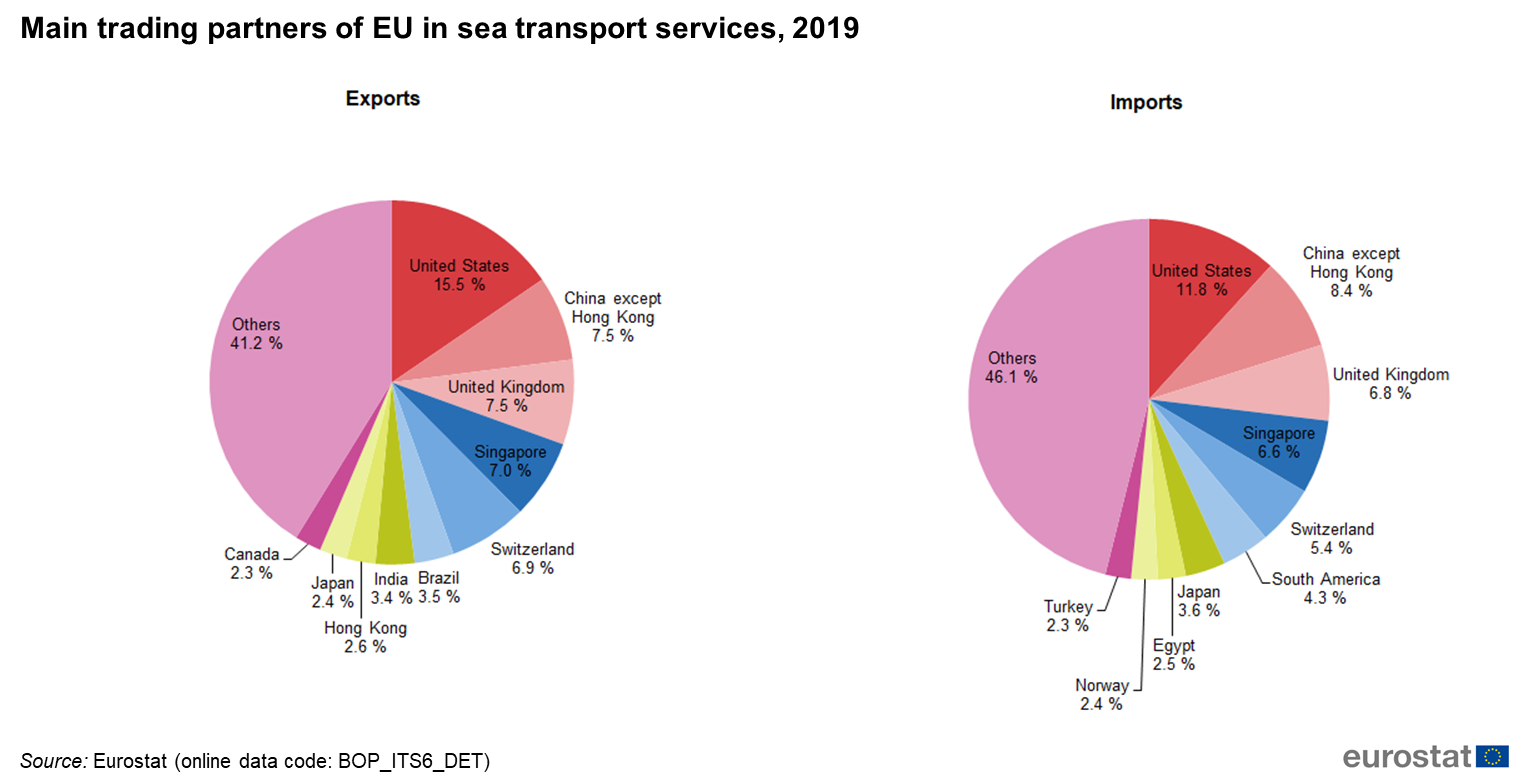
Main trading partners of EU in sea transport services, 2019.png
(
file
)
232 KB
1
17:43, 23 March 2021
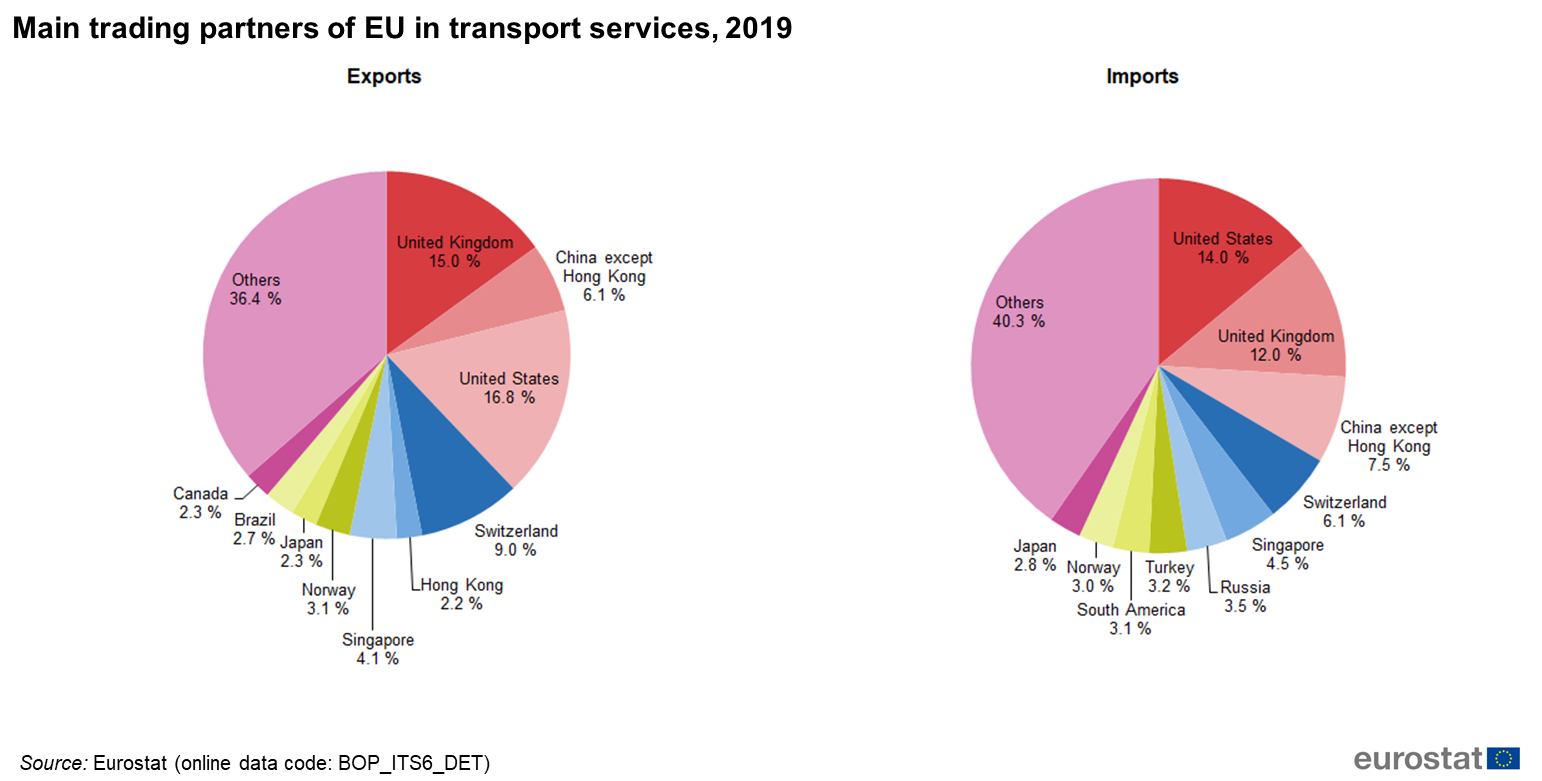
Main trading partners of EU in transport services, 2019.png
(
file
)
238 KB
1
21:02, 22 March 2021
Fig 12 Main trading partners of EU in postal and courier services, 2019.png
(
file
)
228 KB
1
21:01, 22 March 2021
Fig 10 Main trading partners of EU in other modes of transport services, 2019.png
(
file
)
235 KB
1
21:00, 22 March 2021
Fig 8 Main trading partners of EU in air transport services, 2019.png
(
file
)
240 KB
1
20:59, 22 March 2021
Fig 6 Main trading partners of EU in sea transport services, 2019.png
(
file
)
235 KB
1
20:50, 22 March 2021
Fig 4 Main trading partners of EU in transport services, 2019.png
(
file
)
240 KB
1
20:45, 22 March 2021
F 4 Main trading partners of EU in transport services, 2019.png
(
file
)
240 KB
1
16:43, 22 March 2021
F12 Main trading partners of EU in postal and courier services, 2019.png
(
file
)
230 KB
2
16:42, 22 March 2021
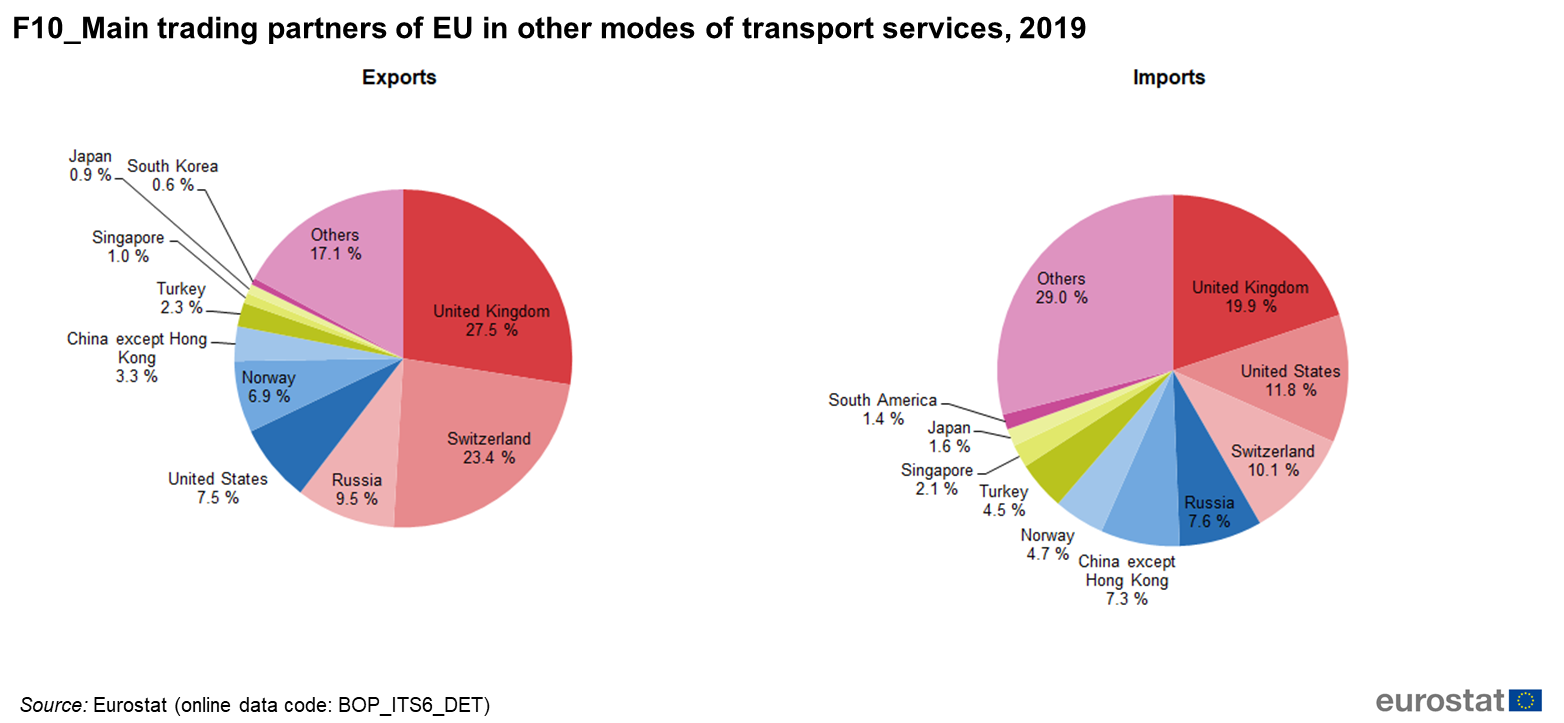
F10 Main trading partners of EU in other modes of transport services, 2019.png
(
file
)
236 KB
5
16:38, 22 March 2021
F8 Main trading partners of EU in air transport services, 2019.png
(
file
)
240 KB
2
16:36, 22 March 2021
Main trading partners of EU-28 in Sea Transport services 2017.png
(
file
)
235 KB
3
16:35, 22 March 2021
F6 Main trading partners of EU in sea transport services, 2019.png
(
file
)
235 KB
3
16:33, 22 March 2021
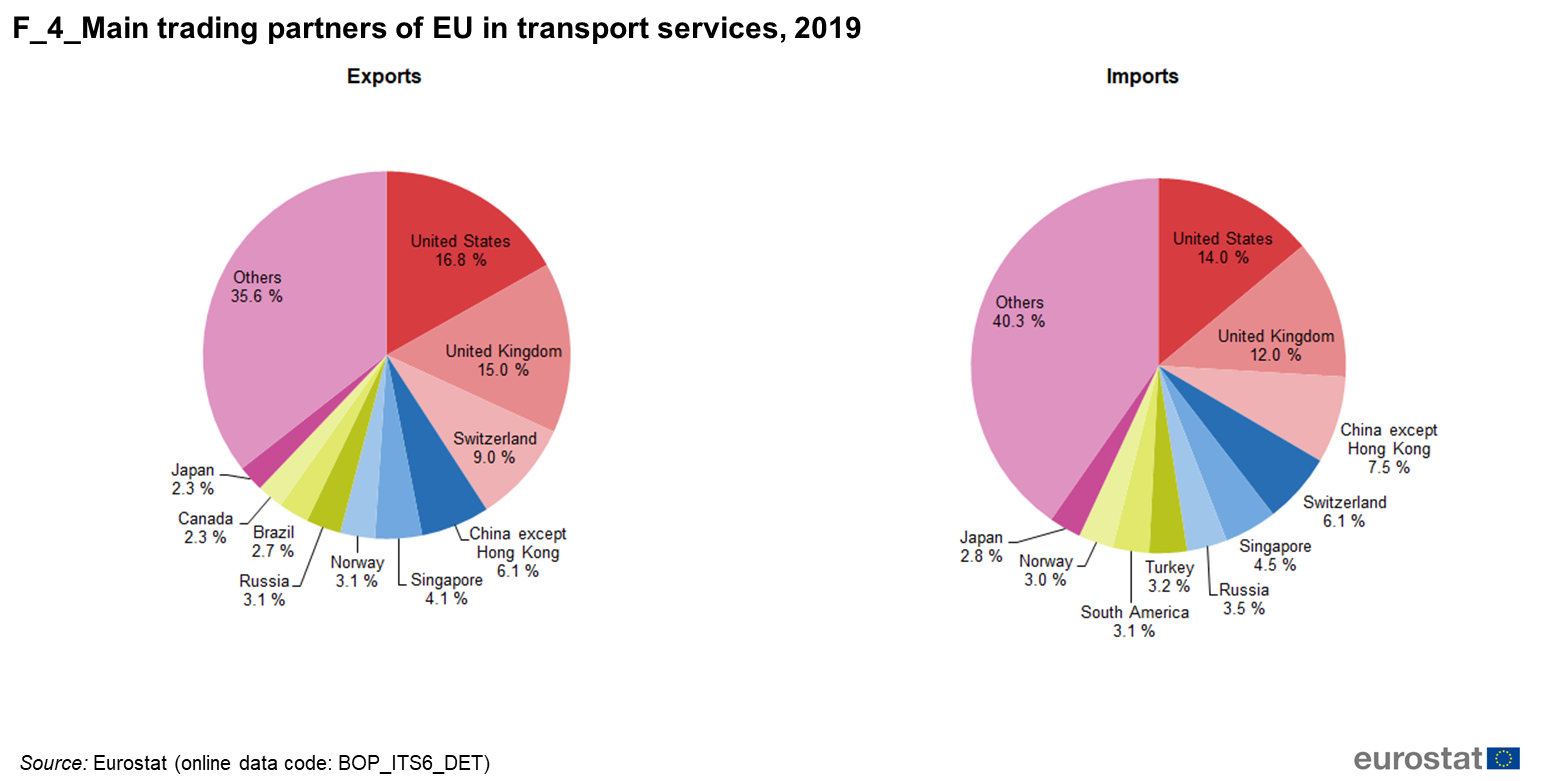
F4 Main trading partners of EU in transport services, 2019.png
(
file
)
237 KB
2
18:48, 19 March 2021
F11 Evolution of postal and courier services trade for EU, 2010-2019 (EUR 1 000 million) .png
(
file
)
44 KB
1
18:47, 19 March 2021
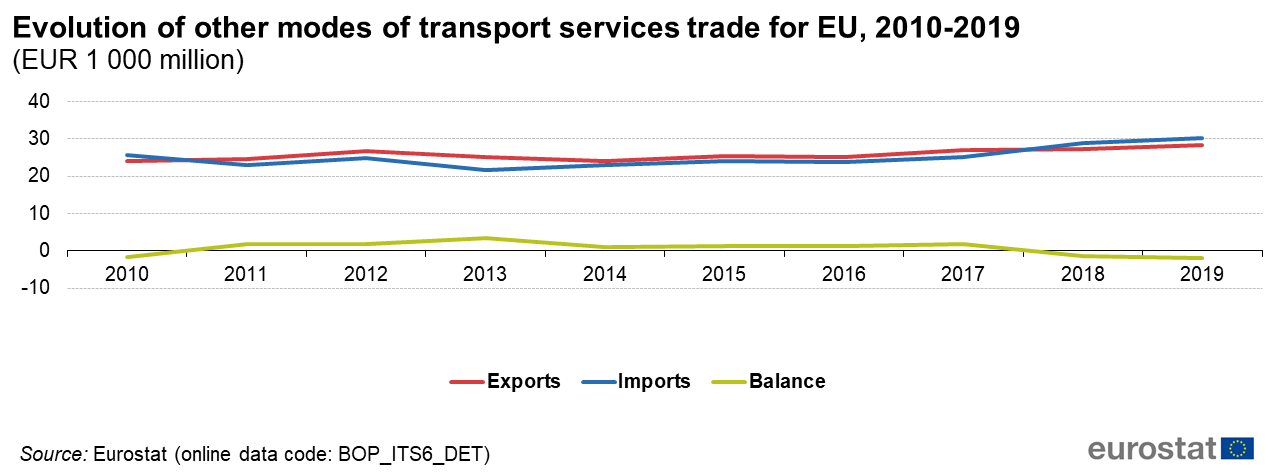
F9 Evolution of other modes of transport services trade for EU, 2010-2019 (EUR 1 000 million) .png
(
file
)
41 KB
1
18:45, 19 March 2021
F7 Evolution of air transport services trade for EU, 2010-2019 (EUR 1 000 million) .png
(
file
)
42 KB
1
18:43, 19 March 2021
F5 Evolution of sea transport services trade for EU, 2010-2019 (EUR 1 000 million) .png
(
file
)
36 KB
1
18:41, 19 March 2021
F3 Contributions of sea, air, other modes of transport and postal and courier services to imports of EU, 2010-2019 (EUR 1 000 million).png
(
file
)
57 KB
1
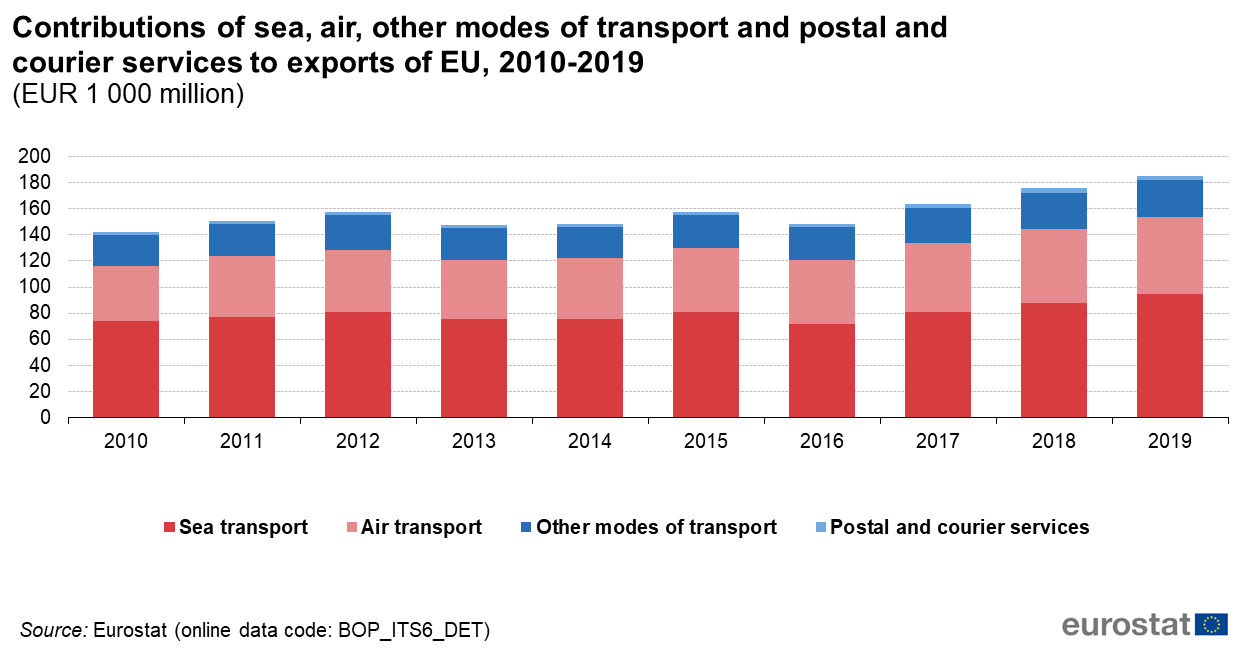
18:38, 19 March 2021
F2 Contributions of sea, air, other modes of transport and postal and courier services to exports of EU, 2010-2019 (EUR 1 000 million).png
(
file
)
63 KB
1
18:36, 19 March 2021
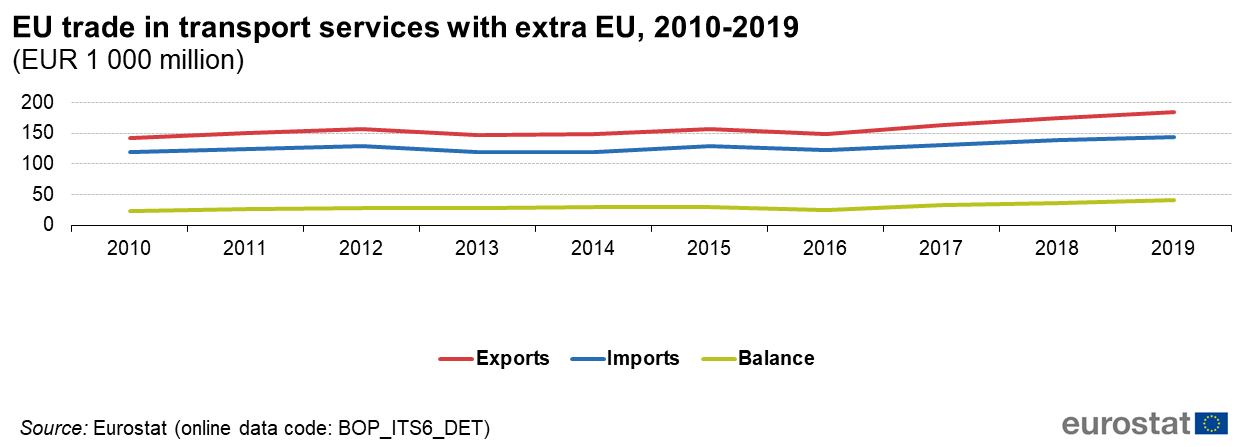
F1 EU trade in transport services with extra EU, 2010-2019 (EUR 1 000 million) .png
(
file
)
38 KB
1
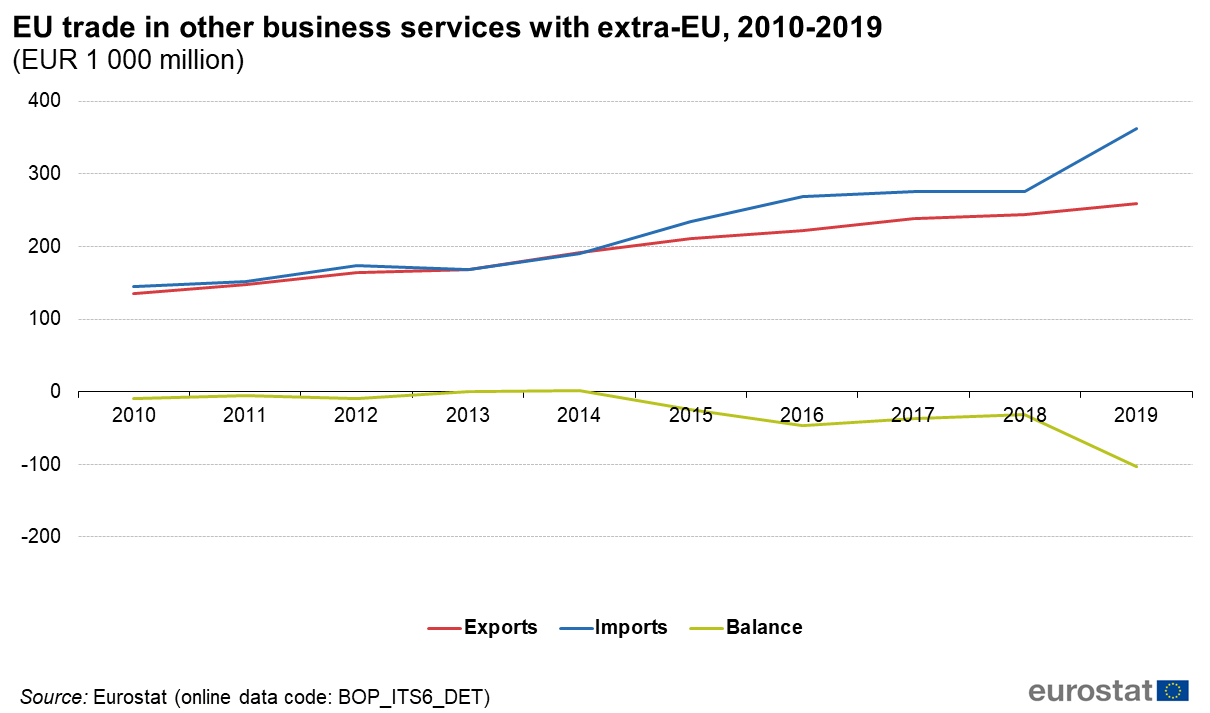
12:36, 19 March 2021
EU trade in other business services with extra-EU, 2010-2019 (EUR 1 000 million) .png
(
file
)
50 KB
5
12:30, 19 March 2021
EU trade in other business services with extra-EU, 2010-2019 (EUR 1 000 million).png
(
file
)
50 KB
2
11:59, 19 March 2021
Main trading partners' share of EU in technical, trade-related, and other business services, 2019.png
(
file
)
229 KB
2
11:28, 19 March 2021
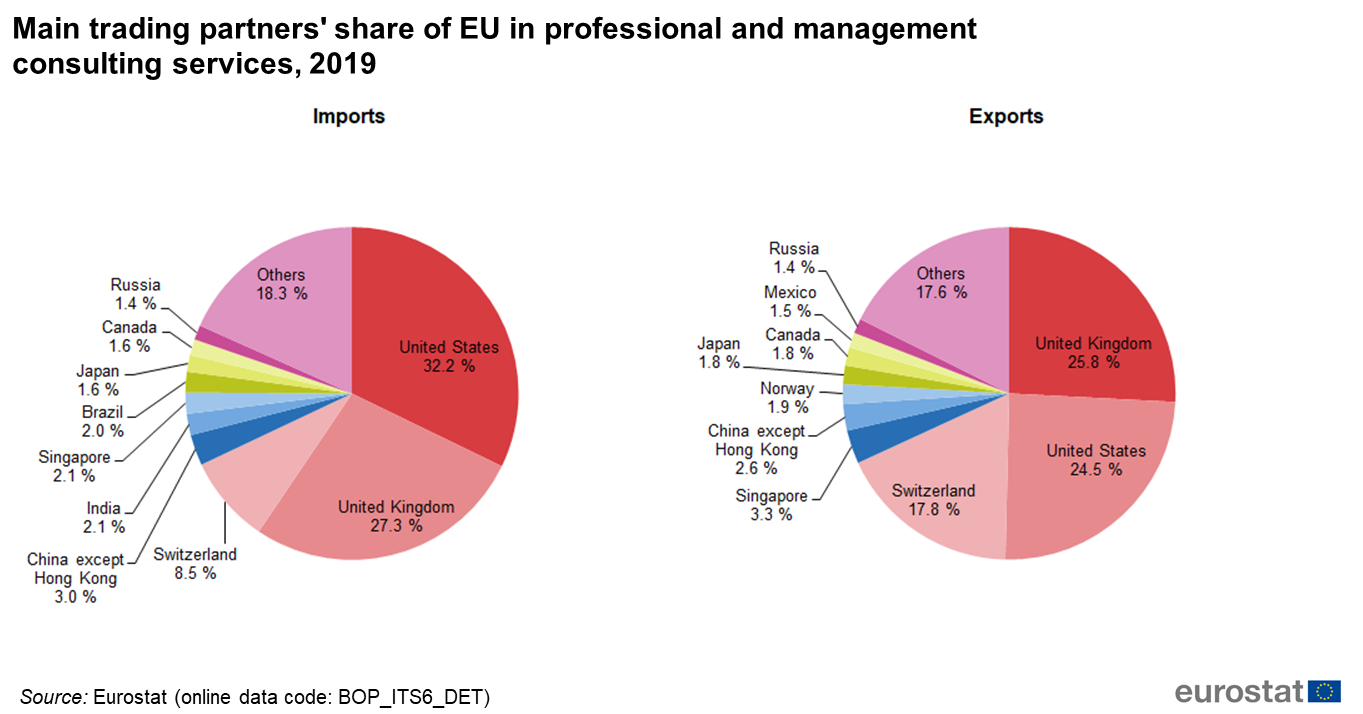
Main trading partners' share of EU in professional and management consulting services, 2019.png
(
file
)
223 KB
3
20:12, 18 March 2021
CHART 1.xlsx
(
file
)
18 KB
1
First page
Previous page
Next page
Last page
Special page
ISSN 2443-8219
.png)
.png)
.png)
.png)


.png)
.png)
.png)
.png)
.png)
.png)
.png)

,_2019_(%25).png)
,_main_partners_EU,_2018_and_2019_(billion_EUR).png)
_in_services_2019_(%25).png)
,_2019_(%25_of_EU_total).png)
,_2019_(%25_of_EU_total).png)
_EU_2013%E2%80%932019_(billion_EUR).png)
_with_non-member_countries_(extra-EU)_EU_2000%E2%80%932019_(%25).png)


_.png)
_.png)
_.png)
_.png)
.png)
.png)
_.png)
_.png)
.png)

