Short-term business statistics - base year 2021
As of March 2024, short-term statistics (STS) indicators are published with the new base year 2021 (since 2018 the base year had been 2015).
This article is part of a set of background articles treating various methodological aspects of short-term business statistics.
Full article
Reasons for base year change
The relative significance of the various economic activities in the EU and the euro area changes over time, i.e. some economic activities expand while others may decline. Such changes will also influence the relative weight of countries in the European aggregates. These structural changes are taken into account by the switch to the new base year 2021 in short-term statistics.
The changeover to the new base actually consists of two steps: rebasing, i.e. updating the weights used to calculate the indices from the base year 2015 to 2021; and re-referencing (or rescaling) the indices to a new base, from 2015 = 100 to 2021 = 100. In principle, these two steps can be carried out independently of each other, but they are usually done together. For the calculation of European aggregates, the new weights are implemented as of 27 February 2024 by Eurostat. At the same time, all series at both national and European level are rescaled to 2021 = 100.
Usually, the base year in short-term statistics is changed every five years and the new weights are implemented at the latest three years after the end of the new base year. Up to now, base years generally ended in “0” or “5”. In the present exercise the weights from the year 2021 are used, since the regular rebasing had to be postponed due the introduction of the new legal base for business statistics which took effect in 2021.
Moreover, the statistical results of the year 2020 were strongly influenced by the Covid-19 crisis and were in many respects atypical. In general, it is preferred that the weights used for aggregating indices are more or less typical for longer periods of time.
It should be noted that Member States may choose a different timing for rebasing and re-referencing, and for this reason it may happen that one and the same (national) series is presented in Eurostat's database with reference 2021 = 100, while on the website of the National Statistical Institute it is still presented with reference 2015 = 100. However, both series are equivalent: the growth rates are the same and one series can easily be converted into the other. Member States are likely to take the opportunity of the base year change to revise the methodology underlying the calculation of their STS data. These revisions, as well as the changes in weights, will affect the time series at national and European level.
For different indicators different statistical variables are used as weights. Table 1 provides an overview.
Detailed information on the 2021 weights of the Member States in the EU and euro area aggregates can be found here.
Effects of base year change
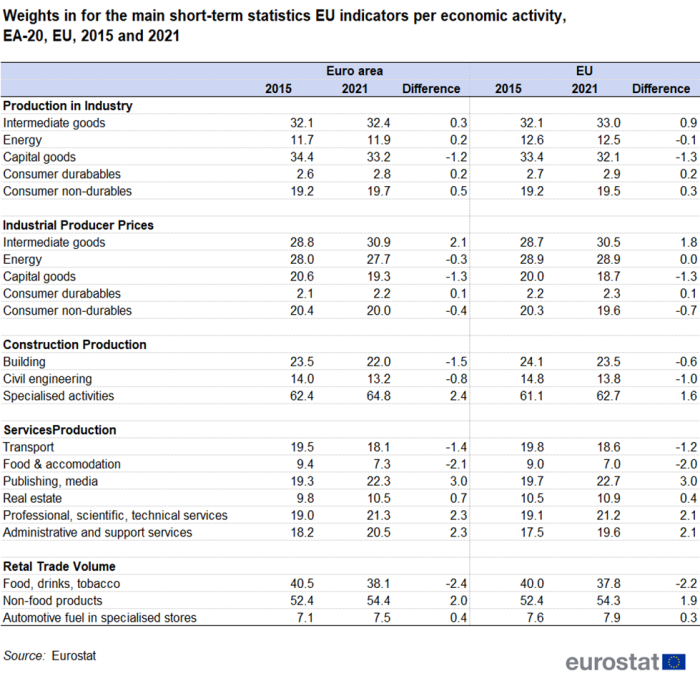
Table 2 compares the new 2021 weights with the replaced 2015 weights used for the production of the euro area and EU aggregates for the four main STS indicators which are published monthly in news releases or are regularly published in news items, i.e. production in industry, construction, and services, volumes of retail trade, and producer prices in industry.
As can be seen in industry (production and also producer prices), the weight of industries operating in the field of capital goods decreased, the weights for intermediate goods generally increased. For production in construction, weights shifted to specialised activities. In services, weights for transport activities as well as for food and accommodation services declined while publishing and media activities increased. In retail trade, non-food purchases have higher weights in 2021 while the weights for food-purchases declined.
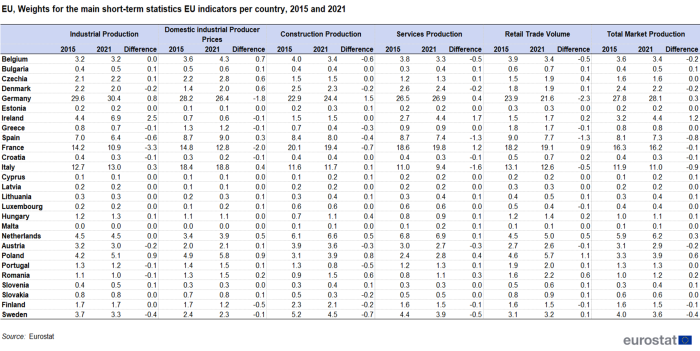
The weights of the individual countries in the EU aggregates also changed. Table 3 provides an overview.
Table 4 summarises the impact that the new weight structure has on the EU indices for production in industry, industrial producer prices, production in construction, and on the volume of retail sales. The countries with the highest positive and negative impact on the European aggregate are listed. The values for the impact are calculated as the difference between new and old weights multiplied with the calendar adjusted country index for the year 2022.
Direct access to


