Archive:People outside the labour force
Data extracted in June 2021
Planned article update: June 2022
Highlights
People outside the labour force aged 15-64 by sex, EU-27, 2002-2019
The group of people outside the labour force, i.e. people neither employed nor unemployed, is a heterogeneous group as regards sex, age, reasons for not looking for a job and level of attachment to the labour force.
This article aims at characterizing this group of people and at studying its evolution over time. Comparing 2020 results with those of previous years, the impact of COVID-19 on this group of people is clearly visible.
The article is based on the Labour Force Survey (EU-LFS) and presents results for the EU as a whole, but also for all EU Member States individually, for three EFTA countries (Iceland, Norway and Switzerland) and four candidate countries (Montenegro, North Macedonia, Serbia and Turkey).
Full article
More people outside the labour force in 2020
This statistical article looks at the population outside the labour force, i.e. the population that is neither employed nor unemployed. The share of people outside the labour force in the total population of working age[1] had fallen from 32.3 % in 2002 to 26.6 % in 2019 in the EU, marking 17 consecutive years of decrease. Hereafter in 2020, this share increased to 27.1 %, corresponding to 1.3 million additional people outside the labour force compared with 2019.

Source: Eurostat (lfsa_ipga)
Looking at the shares for the male and female population, one can observe that the women’s share has been always above the men's one. This was also the case in 2020 with 21.8 % of men outside the labour force, compared with 32.5 % of women. However, the declining trend in the gender gap is visible: from 16.7 percentage points (p.p.) in 2002 to 10.7 p.p. in 2020.
The share of men outside the labour force increased by 0.7 p.p. between 2019 and 2020. This is the highest increase recorded for the male population outside the labour force since 2002. For comparison, the second-highest increase was from 2008 to 2009, by 0.2 p.p. The increase between 2019 and 2020 in the share of women was 0.4 p.p., i.e. slightly smaller than for men over the same period. However, this was the first increase for women outside the labour force since 2002, interrupting a downward trend of 17 years.
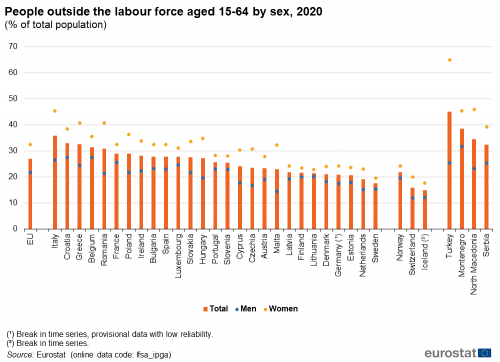
Figure 2 reveals a large difference among the Member States in the proportion of people outside the labour force. This share ranged from around one-third of the total working age population in Italy (35.9 %), Croatia (32.9 %) and Greece (32.6 %) to less than one-fifth in the Netherlands (19.1 %) and Sweden (17.5 %). However, focusing only on women, a significantly higher share can be observed, ranging from 40.7 % in Greece and Romania and 45.3 % in Italy to 19.7 % in Sweden. Furthermore, Greece, Romania and Italy, together with Malta, recorded the largest gender gap in the EU, with a share of women exceeding those of men by 19.4 p.p. in Romania, 18.8 p.p. in Italy, 17.8 p.p. in Malta and 16.2 p.p. in Greece. There is no country (shown in Figure 2) with a lower proportion of people outside the labour force among women than among men.
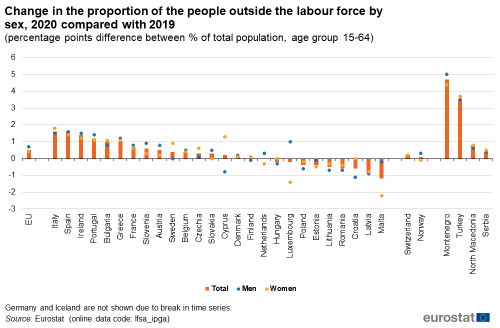
Countries also had large differences as regards the development of people outside the labour force from 2019 to 2020 (see Figure 3). Nevertheless, 15 out of 27 EU Member States recorded a raise in the share of people outside the labour force in the total population, the highest increases were found in Italy and Spain (+1.6 p.p. for both), followed by Ireland (+1.4 p.p.). In addition, Portugal, Bulgaria and Greece had an increase between +1.0 p.p. and +1.2 p.p. In contrast, nine EU countries experienced a decrease between 2019 and 2020, and the largest decrease was recorded in Malta (-1.2 p.p.).
Source: Eurostat (lfsa_ipga)
The number of people outside the labour force largely depends on sex, age and education level
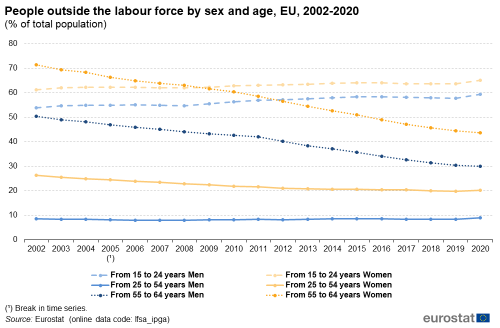
The development in the number of people outside the labour force conceals contrasting situations depending on the age group (see Figure 4).
The share of people outside the labour force in the youngest age group, i.e. people aged 15-24, shows a slow but steady upward trend between 2002 and 2020: from 53.9 % to 59.4 % for men, and from 61.3 % to 65.1 % for women. Even though a decrease in the share of young people outside the labour force is visible in some of the years, the size of the decrease could not compensate for the increase in other years. From 2019 to 2020, a particularly high increase was recorded, of 1.5 p.p. for men and 1.4 p.p. for women. An increase of this size has not been observed so far since 2002.
When analysing the results for people aged 15-24, it should be kept in mind that most people in this age group are still in education or training (see the article on Youth unemployment). Consequently, they are not available for work or do not actively seek work.
In contrast, the population outside the labour force in the age group 55-64 has experienced a sizable decrease since 2002. The percentage of people outside the labour force aged 55-64 fell by 20.4 p.p. for men (from 50.5 % in 2002 to 30.1 % in 2020) and by 27.7 p.p. for women (from 71.4 % in 2002 to 43.7 % in 2020). This decrease has been constant throughout the years since 2002, even from 2019 to 2020. This is due to the increasing retention of people aged 55-64 in employment as shown in the following article on employment: Employment - annual statistics.
The category 25-54 is by far the largest of the three groups in terms of population, but it is also the age group experiencing the lowest rates of people outside the labour force. In this group, a small share of men is outside the labour force (9.0 % in 2020). This can be seen as a structural set of circumstances, as the ratio remains relatively stable over time and despite the economic situation (8.6 % in 2002). There are also fewer women aged 25-54 outside the labour force, compared to the other age groups, showing a continuously decreasing trend up to 2019: a ratio of 26.4 % in 2002 compared with 19.8 % in 2019. However, this trend was interrupted in 2020 as the share of women outside the labour force increased to 20.2 %.
Source: Eurostat (lfsa_ipga)
The consequence of very high numbers of people outside the labour force aged 15-24 and 55-64 is even more visible in absolute figures, with the number of people outside the labour force being similar in the three age groups (15-24, 25-54 and 55-64), despite the different size of their total population. Indeed, in the EU in 2020, the age group 15-24 encompassed 28.9 million people outside the labour force. In the age group 25-54, there were 25.9 million persons outside the labour force. Finally, 22.3 million persons were outside the labour force in the age group 55-64. Between 2019 and 2020, the size of the first two age groups increased by 0.7 million for each, whereas it decreased by 0.2 million for the third group.
Another determining factor of being outside the labour force is the educational level attained. People with a higher educational level are less likely to be outside the labour force, as shown in Figure 5, which contains information for the age group 25-64[2]. The relationship between educational attainment level and being outside the labour force applies irrespective of sex: the higher the education level, the fewer people outside the labour force. However, the women’s share was substantially higher than the men’s share in all three educational levels presented in Figure 5, for all years since 2002. In 2020, men outside the labour force who had attained a low educational level (i.e. with at most lower secondary) were 24.7 %, as compared with 13.8 % of men with a medium educational level (i.e. at most upper secondary or post-secondary level, but less than tertiary) and 7.4 % of men with a high (i.e. tertiary) level, whereas women outside the labour force with a low, medium and high level of education were 48.6 %, 26.4 % and 13.2 %, respectively. Another relevant finding is that the gender gap appears to decrease with the increase of the level of education.
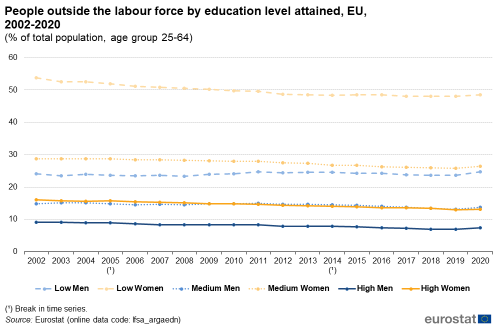
Source: Eurostat (lfsa_argaedn)
Young people mainly in education
Young people tend to be outside the labour force: in 2020, in the EU, 62.2 % of all people aged 15-24 were outside the labour force, more specifically 59.4 % of men and 65.1 % of women. The rate of people outside the labour force in this age group ranges from less than one third (31.3 %) in the Netherlands to 78.8 % in Greece, 78.1 % in Bulgaria and 76.2 % in Italy (see Figure 6). Differences between countries are largely explained by the number of young people combining studies and presence in the labour force (having or seeking a small side job)[3].
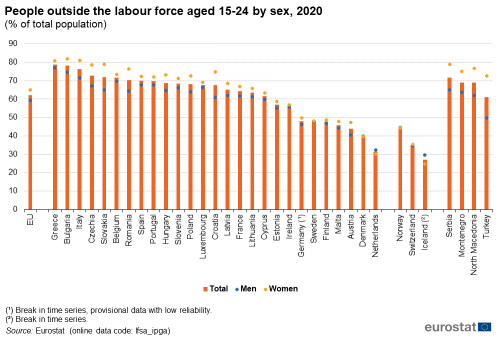
Source: Eurostat (lfsa_ipga)
Among the EU countries with comparable data between 2019 and 2020, only Romania (-0.1 p.p.) had a slight decrease in the proportion of young people outside the labour force between these two years (see Figure 7). Germany also recorded a decrease from 2019 to 2020; however, due to a break in the time series, German results in 2020 are not comparable with the previous periods. All other Member States saw an increase in the share of young people outside the labour force, ranging from 0.3 p.p. in Austria to 3.4 p.p. in Poland and Ireland, 4.1 p.p. in Portugal and 4.7 p.p. in Slovenia.

Source: Eurostat (lfsa_ipga)
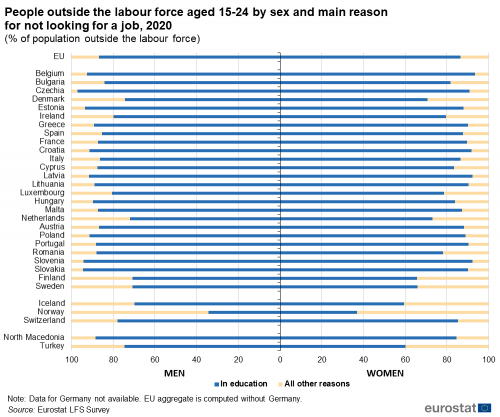
The incidence of reasons for being outside the labour force for men and women in this age group do not reveal many differences compared with those observed in older age groups. Being in education is by far the most frequent reason that both sexes give for not looking for a job (see Figure 8). As a percentage of the population outside the labour force in the EU (excluding Germany) in 2020, these were 86.8 % of men and 86.4 % of women.
Family responsibilities is the main reason for women aged 25-54 for being outside the labour force
Regardless of gender, in 2020, the share of people outside the labour force aged 25-54 was the highest in Italy, where almost one-quarter (23.5 %) of people in this age group were neither employed nor looking nor available to work. In another six EU countries, this share was also above 15 %, these were Ireland, Croatia, Greece, Romania, Belgium and Bulgaria (in descending order). In contrast, in Lithuania, Sweden and Slovenia, less than 1 in 10 persons aged 25-54 were outside the labour force (see Figure 9).
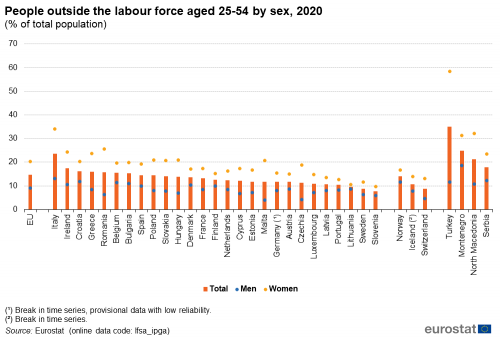
Source: Eurostat (lfsa_ipga)
The main part of the working population in the EU is aged between 25 and 54 years. This is also the age when families are started and children are raised. In this age group, the gender differences for being outside the labour force are more pronounced. In 2020, 9.0 % of men in this age group were outside the labour force in the EU compared with 20.2 % of total women. The largest gender difference in the EU considering this age group was found in Italy, where 34.0 % of women were outside the labour force, compared with 13.0 % of men. Note that Italy had the largest share of women outside the labour force in the EU during 2020; the lowest was in Slovenia (9.7 %). Taking into consideration and non-EU countries, a more striking gender difference can be found, namely in Turkey with 58.4 % of women being outside the labour force, whereas the corresponding share of men was 11.6 %.
As regards the development from 2019 to 2020, more than half of the EU countries recorded an increase in the share of people outside the labour force aged 25-54 (see Figure 10). The biggest increases were in Italy (+1.6 p.p.), Spain (+1.5 p.p.), Greece (+1.4 p.p.) and Bulgaria (+1.1 p.p.). In the same period, it decreased in fewer countries between 2019 and 2020; the largest cuts were in Luxembourg (-0.6 p.p.), Malta (-0.9 p.p.) and Latvia (-1.0 p.p.).

Source: Eurostat (lfsa_ipga)
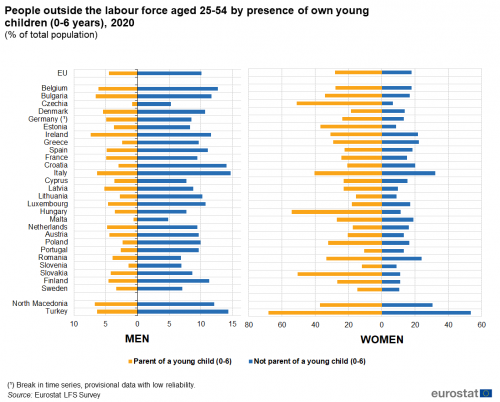
More women aged 25-54 are outside the labour force if they are mothers of young children aged 6 or under: 28.3 % compared with 17.8 % for women aged 25-54 without small children in the EU in 2020 (see Figure 11). For men the opposite is found: if there is one or more young child in their household, the proportion of men outside the labour force was 4.5 %, compared with 10.1 % if no such child was present in the household. Those patterns, due to the presence of children, are evident in every country except for women in Portugal (see Figure 13). Moreover, with 10.8 %, Portugal had the lowest share among the EU countries of women outside the labour force with at least one young child; at the other end of the ranking were Hungary, Czechia and Slovakia, where more than 50 % of women were in the same situation.
Significant gender differences can be observed in the reasons men and women have for being outside the labour force in the age group 25-54, more specifically in the instance of personal or family responsibilities as the main reason for not looking for a job. Around half (47.6 %) of women at that age outside the labour force in the EU (excluding Germany) were in this situation due to personal or family responsibilities. This share ranged from 75.6 % in Czechia to 10.0 % in Denmark. In contrast, the corresponding share for men at EU level (excluding Germany) amounted to only 7.5 % and ranged from 23.1 % in Bulgaria to 1.3 % in Sweden (see Figure 12).
30.1 % of men and 43.7 % of women aged 55-64 were outside the labour force
Amongst the EU Member States, Luxembourg (54.1 %), Croatia (52.3 %) and Romania (49.8 %) recorded the highest share of people outside the labour force in the age group 55-64 in 2020 (see Figure 13). On the other end of the scale, in Sweden, Estonia and Lithuania, one quarter or less of the population aged 55-64 was outside the labour force.
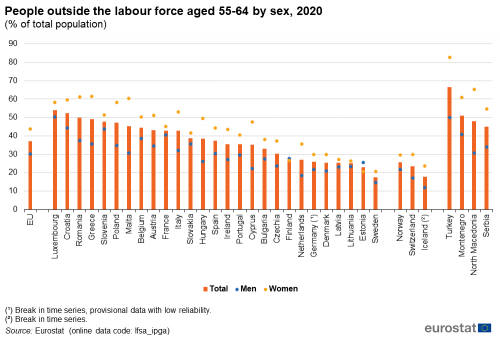
Source: Eurostat (lfsa_ipga)
According to 2020 results, 43.7 % of women and 30.1 % of men aged 55-64 were outside the labour force in the EU. Looking at the national level, significantly larger gender differences can be observed for this age group, than for the younger generations (the people aged 15-24 and 25-54). The difference in the share of men and women outside the labour force in the age group 55-64 was the biggest among the EU countries, i.e. exceeding 25 p.p., in Cyprus (47.7 % for women versus 22.2 % for men), Greece (61.4 % for women versus 35.5 % for men) and Malta (60.3 % for women versus 30.6 % for men). Furthermore, Greece and Malta, alongside with Romania (61.2 %), were the Member States with the highest share of women outside the labour force in the age group 55-64. The highest rates for women can, nevertheless, be found outside the EU, in North Macedonia (65.2 %) and in Turkey (82.7 %).
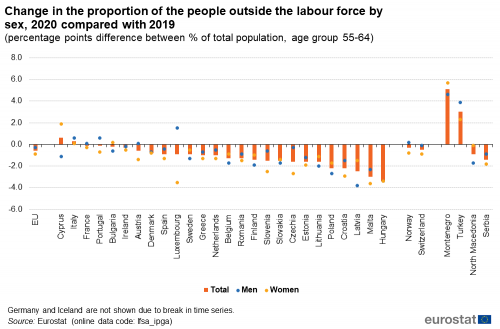
Unlike for the other age groups (15-24 and 25-54), the share of people outside the labour force aged 55-64 declined from 2019 to 2020 in the vast majority of EU countries (see Figure 14). Latvia, Malta and Hungary recorded the largest cuts, respectively -2.5 p.p., -3.0 p.p. and -3.4 p.p. Cyprus (+0.6 p.p.) and Italy (+0.3 p.p.) were the only Member States with comparable data between 2019 and 2020 to record an increase in the share of people aged 55-64 outside the labour force.
Source: Eurostat (lfsa_ipga)
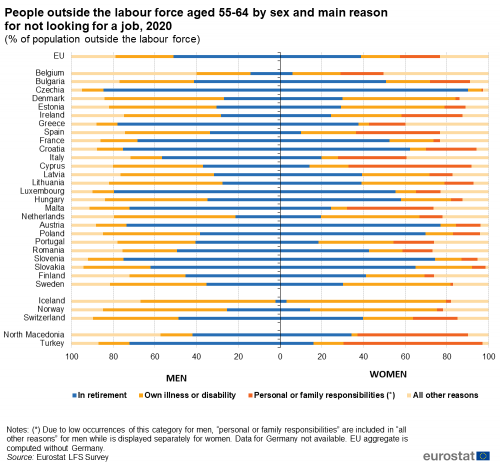
Retirement was the most frequent reason given by men in this age category for being outside the labour force; 51.1 % of the men outside the labour force in the EU (excluding Germany) aged 55-64 were retired. The second most common reason was “own illness or disability”, with 27.9 % of the men outside the labour force not looking for a job for this reason (see Figure 15).
Retirement was also the most frequent reason for not looking for a job among women outside the labour force aged 55-64 in the EU (excluding Germany) (38.8 %). “Own illness or disability” (18.7 %) and “personal or family responsibilities” (19.1 %) were the other non-negligible causes for being outside the labour force among women in the EU (excluding Germany) in this age category. In contrast to men, however, the pattern for women is less consistent across the EU Member States. In some countries (e.g. Cyprus and Malta), personal or family responsibilities were the main reason given in this age group for women outside the labour force, and in other countries (e.g. Poland and Slovenia), retirement being the prevailing reason (see Figure 15).
72.9 % of people outside the labour force aged 25-54 have not worked during the last two years
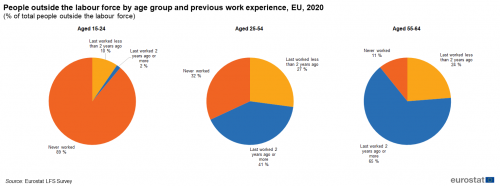
The concept of people outside the labour force encompasses people with varying degrees of attachment to the labour force. This can be seen, for instance, by looking at their previous working experience, i.e. how many of them have previously worked, the duration of their work and how long ago they were last working.
Among the young population aged 15-24 who were outside the labour force in the EU in 2020, the overwhelming majority (88.9 %) have never worked before; 9.6 % have worked during the last 2 years and 1.5 % last worked over 2 years ago. This means that most of these persons have not yet entered the labour force, and those who have done so retain some attachment in the form of a relatively recent previous job.
Among people outside the labour force in the prime working age group 25-54, the distribution shifts significantly: 27.1 % have worked in the last two years, 41.0 % last worked more than two years ago and 31.9 % have never worked. This shows a rather high degree of labour force detachment, as 72.9 % have not worked during the last 2 years.
Finally, among the population aged 55-64 who are outside the labour force, 23.7 % have worked in the last two years and 65.5 % have worked more than two years ago and only 10.8 % have never worked. This shows that, with age, most people were, at some point, part of the labour force, but for many, the connection does not last.
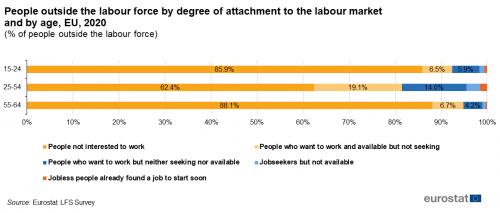
21.3 % of the population outside the labour force are interested in working
People outside the labour force are defined by the fact that they do not have a job and are either not actively looking for a job or are not immediately available to work (or both), i.e. they are neither employed nor unemployed. Most of them, but not all, are not interested in working. Persons who are outside the labour force have a varying degree of attachment to the labour force, which can be analysed from the point of view of their behaviour as regards the three interrelated main variables: Do they want to work? Are they actively seeking a job? Are they available to start immediately in a new job? For instance, some people who are not available to work do not even consider whether they want to work (this is the case for many students). Instead, for other jobless persons, the lack of immediate availability is not an impediment to seeking a job, which indicates a much stronger attachment to the labour force. Percentages of people outside the labour force that were interested in working observed for people aged 15-24 and 55-64 were 14.1 % and 11.9 %, respectively (see Figure 17). At the same time, this share was much higher for people aged 25-54 (37.6 %).
Source data for tables and graphs
Data sources
Source: All statistics presented in this article are derived from the European Union Labour Force Survey (EU-LFS). The EU-LFS is the largest European household sample survey providing quarterly and annual results on labour participation of people aged 15 and over as well as on persons outside the labour force. It covers residents in private households. Conscripts in military or community service are not included in the results. The EU-LFS is based on the same target populations and uses the same definitions in all countries, which means that the results are comparable between the countries.
Reference period: Yearly results are obtained as averages of the four quarters in the year. However, data on reason for being outside the labour force is annual, this variable not being collected on a quarterly basis.
Coverage: The results from the survey currently cover European Union Member States, the EFTA Member States of Iceland, Norway, Switzerland, as well as the candidate countries Montenegro, North Macedonia, Serbia and Turkey. For Cyprus, the survey covers only the areas of Cyprus controlled by the Government of the Republic of Cyprus.
Country note: In Germany, since the first quarter of 2020, the Labour Force Survey (LFS) has been integrated into the newly designed German microcensus as a subsample. Unfortunately, for the LFS, technical issues and the COVID-19 crisis has had a large impact on the data collection processes, resulting in low response rates and a biased sample. Changes in the survey methodology also led to a break in the data series. The published German data are preliminary and may be revised in the future. For more information, see here.
European aggregates: EU refers to the sum of the 27 EU Member States. Cases, where data are unavailable for a country, are indicated.
Definitions: The concepts and definitions used in the survey follow the guidelines of the International Labour Organization (ILO):
- People outside the labour force are those who are neither employed nor unemployed.
- Employed people comprise:
(a) persons who during the reference week worked for at least one hour for pay or profit or family gain; (b) persons who were not at work during the reference week but had a job or business from which they were temporarily absent.
- Unemployed people comprise persons who were:
(1) not employed according to the definition of employment above; (2) currently available for work, i.e. were available for paid employment or self-employment before the end of the two weeks following the reference week; (3) actively seeking work, i.e. had taken specific steps in the four week period ending with the reference week to seek paid employment or self-employment or who found a job to start later, i.e. within a period of at most three months from the end of the reference week.
- Reason for being outside the labour force is the main reason why somebody is not searching for employment. The main reason may or may not be the only reason. Only the main one is retained for analysis in this article.
- Level of education is defined according to the International standard classification of education, version 2011 (ISCED 2011). Eurostat’s online tables and databases present data on educational attainment for three aggregates (low, medium and high levels of education).
Context
The European Pillar of Social Rights has been jointly signed by the European Parliament, the Council and the Commission on 17 November 2017. Employment and social policies are the main fields of interest of the European Pillar of Social Rights, which is about delivering new and more effective rights for citizens. It has 3 main categories: (1) Equal opportunities and access to the labour market, (2) Fair working conditions and (3) Social protection and inclusion. In particular, today's more flexible working arrangements provide new job opportunities especially for the young but can potentially give rise to new precariousness and inequalities. Building a fairer Europe and strengthening its social dimension is a key priority for the Commission. The European Pillar of Social Rights is accompanied by a ‘social scoreboard’ which will monitor the implementation of the Pillar by tracking trends and performances across EU countries in 12 areas and will feed into the European Semester of economic policy coordination. The scoreboard will also serve to assess progress towards a social ‘triple A’ for the EU as a whole.
Although labour market economists tend to focus on the activities and characteristics of people in the labour force, there has been continued, if less visible, interest in individuals outside of the labour market, especially those who want to work but are not currently seeking work. Much of this growing interest stems from concern over improving the availability of decent and productive employment opportunities in developing and developed economies alike. Individuals are considered to be outside the labour force, if they are neither employed nor unemployed, that is, not actively seeking work. There is a variety of reasons why some individuals do not participate in the labour force; such persons may be occupied in caring for family members; they may be retired, sick or disabled or attending school; they may believe no jobs are available; or they may simply not want to work.
Direct access to
- Labour market in the light of the COVID 19 pandemic — online publication
- EU labour force survey — online publication
- Labour force survey in the EU, EFTA, United Kingdom and candidate countries — Main characteristics of national surveys, 2019, 2021 edition
- Quality report of the European Union Labour Force Survey 2019, 2021 edition
- LFS main indicators (t_lfsi)
- LFS series - Detailed annual survey results (t_lfsa)
- LFS main indicators (lfsi)
- LFS series - Detailed annual survey results (lfsa)
Publications
- EU labour force survey — online publication
- Labour force survey in the EU, EFTA, United Kingdom and candidate countries — Main characteristics of national surveys, 2019, 2021 edition
- Quality report of the European Union Labour Force Survey 2019, 2021 edition
ESMS metadata files and EU-LFS methodology
- Employment and unemployment (Labour Force Survey) (ESMS metadata file — employ_esms)
- LFS ad-hoc modules (ESMS metadata file — lfso_esms)
- LFS main indicators (ESMS metadata file — lfsi_esms)
- LFS series - detailed annual survey results (ESMS metadata file — lfsa_esms)
- LFS series - detailed quarterly survey results (from 1998 onwards) (ESMS metadata file — lfsq_esms)
- LFS regional series (ESMS metadata file — reg_lmk)
- Commission Regulation (EC) No 377/2008 of 25 April 2008 on the organisation of a labour force sample survey in the Community as regards the codification to be used for data transmission from 2009 onwards, the use of a sub-sample for the collection of data on structural variables and the definition of the reference quarters
- Commission Regulation (EC) No 1897/2000 of 7 September 2000 implementing Council Regulation (EC) No 577/98 on the organisation of a labour force sample survey in the Community concerning the operational definition of unemployment
- Council Regulation (EC) No 577/98 of 9 March 1998 on the organisation of a labour force sample survey in the Community (Summary)
- Regulation (EC) No 1372/2007 of the European Parliament and of the Council of 23 October 2007 on the organisation of a labour force sample survey in the Community
- Regulation (EC) No 2257/2003 of the European Parliament and of the Council of 25 November 2003 on the organisation of a labour force sample survey in the Community to adapt the list of survey characteristics
Notes
- ↑ The working age is conventionally set at 15-64 years of age.
- ↑ Young persons aged 15-24 are omitted from this comparison as many of them are still in education.
- ↑ On the interplay between participation in education and in the labour market for young people, see 'Participation of young people in education and the labour market'.
