Merging statistics and geospatial information, 2017 projects - Austria
LEARN4SDGis – machine learning for sample data geographic information systems; 2017 project; final report March 2020
This article forms part of Eurostat’s statistical report on the Integration of statistical and geospatial information.
Full article
Problem
Regional disaggregation is often required in order to monitor progress adequately for various SDG indicators. However, sample surveys do not provide sufficient detail and are limited by sampling error.
Objectives
This project addressed the question how to integrate geospatial data in sample surveys by joining resources from various organisational units. It thereby wanted to explore applications for machine learning, enhance resolutions of sample estimates and provide geographical disaggregation of SDG indicators, for example, for the risk of poverty at any regional level, such as grids, census districts, municipalities, districts or NUTS regions.
Method
The national sustainable development goals (SDG) indicator set was reviewed to identify indicators from sample surveys that would be suitable for the project. The sample frame used for social surveys includes geoinformation, although this was not traditionally provided for analysis.
A framework was developed to recombine sample survey data with geographic information, using identifiers.
Sample survey data were also linked with additional administrative data. The integration of already existing data provides valuable information for the required small area estimations. For example, in the case of poverty indicators there is information on income from income tax and other registers data. Other indicators, such as the number of unemployed persons, also show plausible relationships.
Due to the abundance of possible additional information, machine learning algorithms were applied to automatically recognise correlations in the sample data that were relevant for an improved estimate and to model them according to defined optimisation criteria. For each indicator (for example, the risk of poverty), the variable required for its calculation was modelled using various approaches. The following machine learning approaches were tested.
- Random Forest (RF)
- Boosting
- Support Vector Machines
- Neural Networks
The models were trained on sample data, the results were compared, and a model chosen. The selected models were then applied to information for the whole population in order to estimate the relevant characteristic for every individual in the population. This resulted in a synthetic census. Individual data were not published but various aggregations were produced for dissemination. The results of the machine learning estimates were smoothed regionally in order to avoid unexplained large differences between an area and four of its neighbouring areas (the areas were smoothed at the level of 8 800 enumeration districts); this had the overall impact of removing many outliers. The results were also scaled to fit the survey results at NUTS level 2.
Results
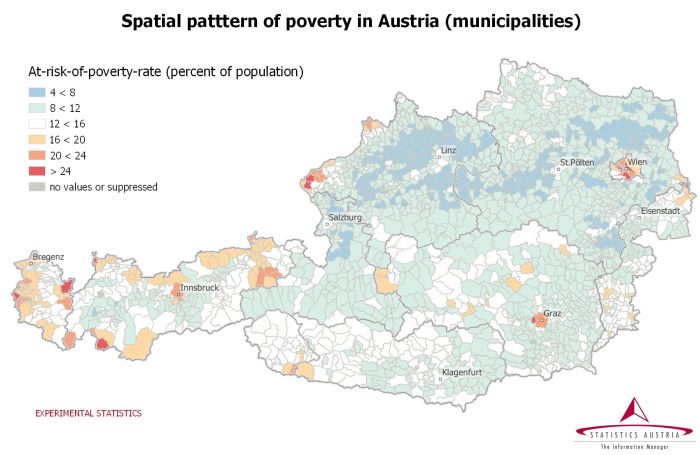
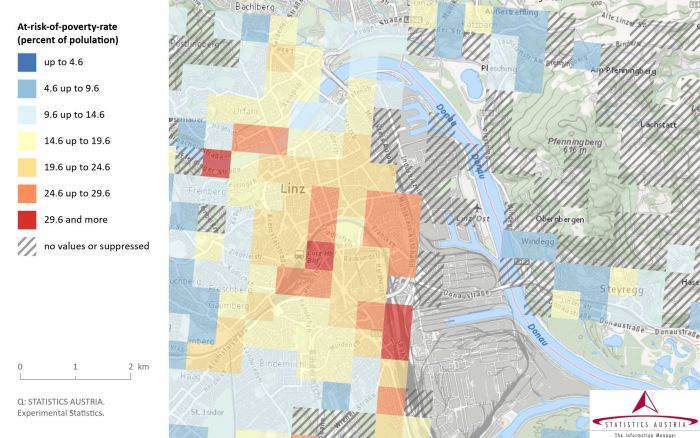
The project delivered maps for poverty, health and education at the small area level. This was achieved by machine learning and integration of different data sources.
The small area results are based on the available administrative data and therefore their quality is largely determined by the extent to which they represent reality.
Direct access to


