Freight transported in containers - statistics on unitisation
Data extracted in March 2024.
Planned article update: 26 March 2025.
Highlights
Containers transport by mode of transport, EU, 2012-2022 (% share of total freight transport, based on tonne-kilometres)
This article presents statistics on intermodal freight transport in the European Union (EU) and the EFTA countries. The statistics contain a set of indicators developed by Eurostat on goods transported in containers and other intermodal transport units (ITUs). Recent trends in the data clearly illustrate the importance and growing role of intermodal transport in Europe. The main focus is on the increasing share of unitisation in different modes of transport, in other words the share of goods that are transported in containers and other intermodal transport units (ITUs), such as swap bodies, trailers and semi-trailers. The article also covers the modal shift potential of long-distance road transport of containers, in line with the strategy to shift 30 % of transport over distances of 300 kilometres or more from road to transport modes with lower CO2 emissions. These indicators study the share of such long distance transport in the total road transport of containers.
Full article
Unitisation of goods in the EU is growing
Intermodal transport is becoming an increasingly significant part of the logistics sector and freight unitisation is a pre-requisite for intermodality. ‘Freight unitisation’ is defined as the use of standardised packaging units that can easily be transferred from one mode of transport to another without handling the goods themselves. In simple terms, ‘unitisation’ describes how much of the total freight transport has been transported in containers.
The main types of standardised packaging units, called intermodal transport units (ITUs), are:
- containers,
- swap bodies,
- trailers and semi-trailers.
The use of ITUs reduces the need for cargo handling and so improves security, reduces damage and loss and allows freight to be transported faster and more efficiently.
The share of unitisation in total freight transport has increased considerably in recent years. However, this growth in unitisation varies between the different modes of transport. Rail and maritime transport (deep sea shipping in particular, but also short sea shipping) have the highest shares of freight unitisation, both at EU level and in most Member States. By contrast, for road transport the unitisation rate at EU level has slightly decreased over the last few years.
Comparing road, rail, maritime (deep sea shipping and short sea shipping) and inland waterways transport across all EU Member States, rail transport had the highest unitisation rates in 14 EU Member States. Deep sea shipping or short sea shipping had the highest unitisation rate in 12 EU Member States (only 22 Member States have a coastline). Due to data availability at national level, the unitisation rate for maritime transport is calculated on the basis of tonnes of goods transported, whereas for the other transport modes it is based on tonne-kilometres.
Differing trends in road container transport across Europe
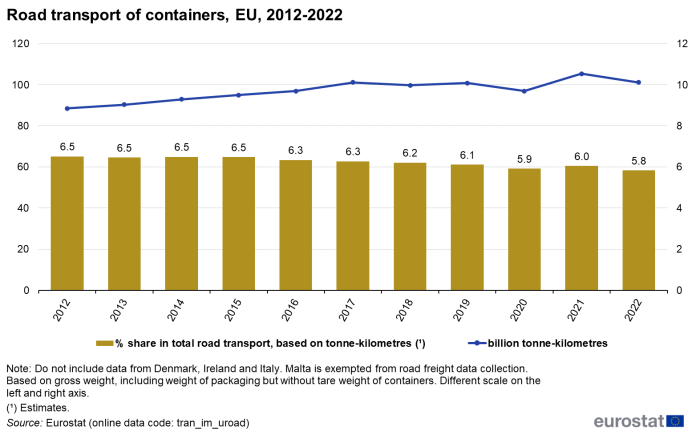
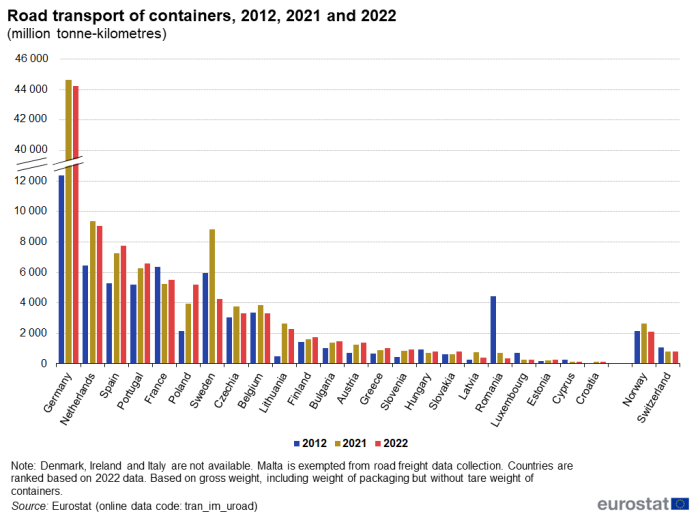
Over the period 2012-2022, the share of container transport in total road transport performance in the EU varied between 6.5 % in 2012-2015, and 5.8 % in 2022 (Figure 1). From 2012 to 2022, the volume of freight transport in containers by road decreased in seven EU Member States (Figure 2), as well as in the EFTA countries Norway and Switzerland. Lithuania stands out with a sharp increase in road transport of containers over this period (more than 300 %). This may reflect the significant increase in the share of containers recorded in Lithuanian ports over this period, in particular for short sea shipping.
In 10 EU Member States, the tonne-kilometres for container transport by road fell in 2022 from the previous year. The largest decreases were recorded in Romania (-52.1 %), Sweden (-52.0 %), Latvia (-49.7 %), Belgium, Croatia (both -14.6 %), Lithuania (12.5 %) and Czechia (-11.1 %). The EFTA country Norway also substantially decreased over the same period (-19.7 %). By contrast, the most noticeable growth was observed in Poland (+31.9 %), followed by Slovakia (+25.6 %), Cyprus (+14.0 %), Estonia (+13.9 %), Greece (+11.7 %) and Slovenia (+10.1 %). Germany, with more than 44 billion tonne-kilometres, was by far the EU Member State with the highest level of container transport.
(million tonne-kilometres)
Source: Eurostat, (tran_im_uroad)
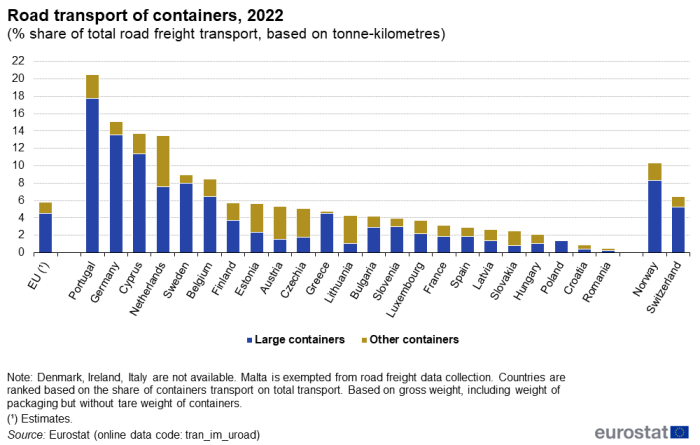
Six EU Member States had shares of freight unitisation in road transport higher than the estimated EU average in 2022. These were: Portugal (20.5 %), Germany (15.1 %), Cyprus (13.7 %), the Netherlands (13.5 %), Sweden (9.0 %) and Belgium (8.4 %). The EFTA countries Norway (10.3 %) and Switzerland (6.5 %) also had a unitisation rate for road higher than the EU average in 2022. Large containers made up the main part of road freight unitisation in most EU Member States (Figure 3). Exceptions in 2021 were, Czechia, Estonia, Croatia, Lithuania, Austria, Romania and Slovakia, where the largest part of container transport by road was carried out in other containers.
(% share of total road freight transport, based on tonne-kilometres)
Source: Eurostat, (tran_im_uroad)
In Estonia, Cyprus, Portugal, Sweden and the EFTA country Norway, maritime transport plays an important role. Belgium, Germany and the Netherlands all have major container ports serving as entry points for goods to the EU (Antwerp-Bruges in Belgium, Hamburg and Bremen/Bremerhaven in Germany and Rotterdam in the Netherlands). The fact that containers arriving or departing by sea tend to be forwarded by road, in particular to and from the direct hinterland of the sea ports, might be one of the explanations for the high unitisation rates observed for road transport in these countries.
High unitisation rates in rail transport statistics
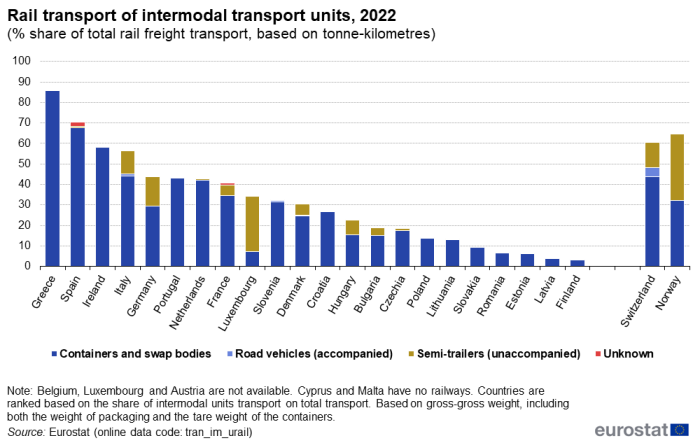
In 2022, the highest unitisation rates in rail transport were recorded in Greece (85.8 %), Spain (70.3 %), Ireland (58.0 %), Italy (56.3 %), Germany (43.9 %), Portugal (43.1 %), ,the Netherlands (42.6 %) and France (40.5 %) as well as in the EFTA countries Norway (64.5 %) and Switzerland (60.5 %) (Figure 4). The unitisation rate for rail freight covers not only containers and swap bodies, but also accompanied road vehicles (with driver) and unaccompanied semi-trailers (without driver). There are no railways in Cyprus and Malta.
(% share of total rail freight transport, based on tonne-kilometres)
Source: Eurostat, (tran_im_urail)
In most of the countries, the unitisation rate is substantially higher for rail than for road. In 2022, taking into account only containers, only Finland had a higher unitisation rate for road than for rail. It should be noted that containers and swap bodies are grouped together for rail, as the data are reported without distinction between them, whereas the road unitisation rate covers only containers. This comparison should thus be treated with some care.
Unitisation in inland waterway transport remained relatively stable in 2021
Only 17 EU Member States have significant freight transport by inland waterways (navigable lakes, rivers and canals). In 2022, the unitisation rate in inland waterway was 9.2 % at EU level, a slight decrease by 0.2 percentage points (pp) compared with 2021 (Figure 5). When comparing with 2012, there was an increase by 0.7 pp. At country level, the highest unitisation rate was observed in the Netherlands (12.9 %), followed by Germany (9.8 %), Belgium (7.9 %) and France (7.3 %).
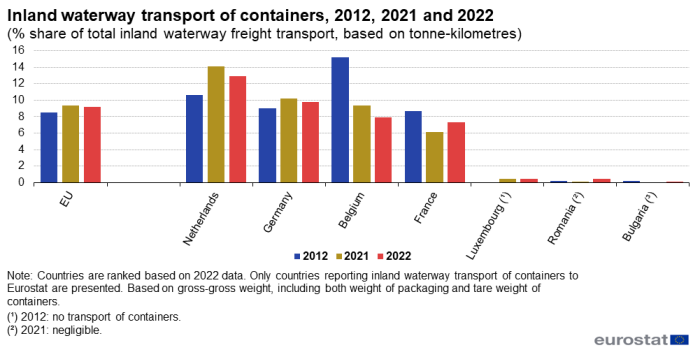
(% share of total inland waterway freight transport, based on tonne-kilometres)
Source: Eurostat, (tran_im_uiww)
Between 2021 to 2022, the inland waterway unitisation rate decreased in Belgium by 1.5 pp, the Netherlands by 1.1 pp and Germany by 0.4 pp. By contrast, the inland waterway unitisation rate increased in France by 1.1 pp, in Romania by 0.4 pp. In Bulgaria, there was no container transport in 2021 and the unitisation rate was 0.1 % in 2022. In Luxembourg it remained stable. From 2012 to 2022, the increase in the inland waterway unitisation rate was the highest in the Netherlands and Germany, by 2.3 and 0.7 pp, respectively. In Belgium and France, the unitisation rate fell by 7.3 pp and 1.4 pp over the same period. There was no transport of containers recorded by Luxembourg in 2012, while it represented 0.5 % in 2022.
Unitisation rates in short sea shipping and deep sea shipping
The unitisation rates for maritime transport are calculated on the basis of tonnes transported, as data on maritime tonnes-kilometres at country level are not available. Maritime transport is only relevant for the 22 EU Member States that have a coastline. At EU level, goods transported in containers made up 16.0 % of the transport volume (in tonnes) in short sea shipping in 2022, representing an increase of 1.8 pp compared with 2012 but a decrease by 0.5 pp compared with 2021. The unitisation rate for maritime transport varies considerably between EU Member States and between short sea shipping and deep sea shipping. In Slovenia, goods transported in containers made up 35.95 % of the transport volume in short sea shipping in 2022 (Figure 6). High shares of unitisation in short sea shipping were also recorded in Portugal (35.8 %), Belgium, Germany (both 27.0 %), Lithuania (25.8 %), Cyprus (23.8 %), Spain (23.7 %), Greece (22.4 %) and Poland (21.7 %). Several of these countries have major container ports serving as trans-shipment points for containers. In these countries, the high unitisation rates in short sea shipping reflect a large volume of feeder services to and from these hub ports. Compared with 2012, Lithuania recorded the highest increase in the share of containers transport in short sea shipping, with +14.9 pp. Croatia and Portugal followed with respective growth of 11.5 pp and 10.7 pp respectively. For the same period, six EU Member States recorded a decrease: Cyprus (-7.8 pp), Malta (-6.9 pp), Belgium (-6.3 pp), Finland (-1.0 pp) and Sweden (-0.9 pp).
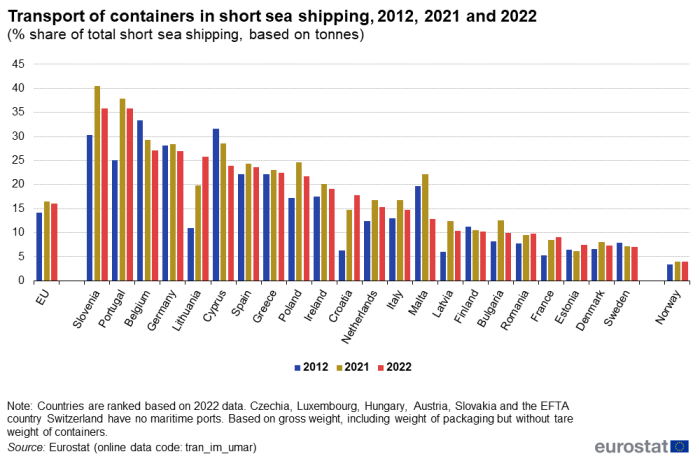
(% share of total short sea shipping, based on tonnes)
Source: Eurostat, (tran_im_umar)
The EU Member States with high unitisation rates in deep sea shipping are generally those with major container ports, handling high levels of intercontinental transport (Figure 7). In particular, these countries are Malta (67.9 % in 2022) with the port of Marsaxlokk which serves as a trans-shipment point for containers in the Mediterranean, Germany (58.3 %) with the ports of Hamburg and Bremen/Bremerhaven, Belgium (49.3 %) with the port of Antwerp-Bruges, Cyprus (48.8 %) with the port of Lemesos which also serves as a trans-shipment point for containers in the Mediterranean, Greece (47.4 %) with the port of Piraeus, Slovenia (44.4 %) with the port of Koper and Spain (39.7 %) with the ports of Valencia and Algeciras. At EU level, goods transported in containers made up 33.3 % of the transport volume (in tonnes) in deep sea shipping in 2022, representing a decrease of 1.2 pp compared with 2012 and of 4.4 pp compared with 2021. In 2022, Cyprus recorded the highest increase in the share of containers transport in deep sea shipping compared with 2012, with +30.6 pp. Slovenia and Denmark followed with growths of 22.7 pp and 11.6 pp, respectively. For the same reference period, 10 EU Member States recorded a decrease; the highest were for Poland (-11.3 pp), Sweden (-8.9 pp), Germany (-8.1 pp), Malta (-6.5 pp) and Italy (-5.9 pp).
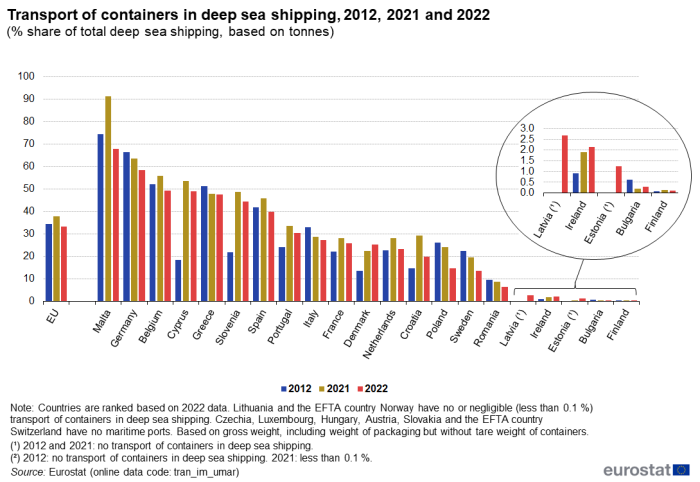
(% share of total short deep shipping, based on tonnes)
Source: Eurostat, (tran_im_umar)
Trends in unitisation across modes
To enable comparison of unitisation rates across the different modes of transport, Eurostat has estimated unitisation rates for short sea shipping in terms of tonne-kilometres. For comparability, the data for rail and inland have also been estimated in gross weight, by subtracting the weight of containers typically used from the original gross-gross weight data. Deep sea shipping mainly concerns intercontinental transport and is thus not included in this comparison of transport within Europe.
The unitisation rates for short sea shipping and for rail transport were roughly at the same level between 2012 and 2016. Over the period 2017-2021, unitisation rates for rail transport were higher by more than 1.7 pp, to reach a difference of 5.0 pp in 2022. The unitisation rate for rail freight was 16.9 % in 2012 and fluctuated up and down over the years, reaching a peak of 22.2 % in 2022. For rail transport, in order to facilitate comparison with other modes, only containers and swap bodies are included. For short sea shipping, the unitisation rate grew from 16.9 % in 2012 to 18.2 % in 2014, before falling quite substantially to 15.6 % in 2017 and rebounding to 17.5 % in 2020 and 2021. In 2022, the unitisation rate fell again to 17.2 %.
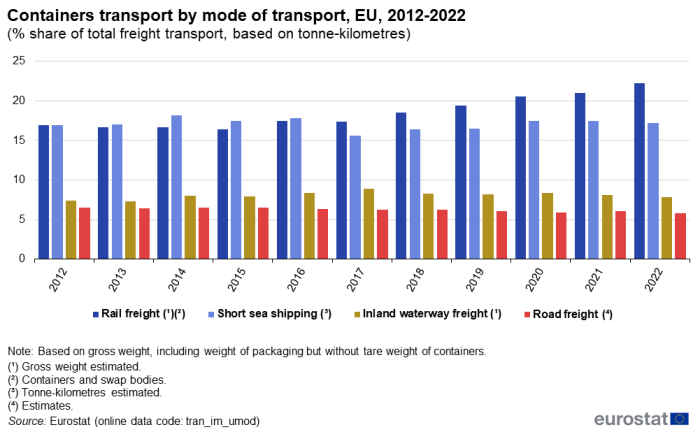
(% share of total freight transport, based on tonne-kilometres)
Source: Eurostat, (tran_im_umod)
The unitisation rates for freight transport by road and by inland waterways are substantially below the rates for short sea shipping and rail transport. For freight transport by inland waterways there were ups and downs between 2012 to 2022. The unitisation rate was 7.4 % in 2012 and reached a peak at 8.9 % in 2017. The rate almost constantly decreased until 2022 to 7.8 %. Only four EU Member States have significant inland waterways transport of containers. For road freight transport, the unitisation rate was estimated at 6.5 % in the period 2012-2015 and has remained between 5.8 % and 6.3 % since 2016. In 2020, the rate fell to below 6 % for the first time, at 5.9 %. In 2022, it reached a low point at 5.8 %. The EU unitisation rates for each mode of transport in Figure 8 are Eurostat estimates, based on the data currently available from the EU Member States.
Modal shift potential from road to rail and inland waterways
A key target of European transport policy is to achieve a 60 % reduction in greenhouse gas (GHG) emissions from transport by 2050 compared with 1990 levels. One of the strategies to achieve this is to shift 30 % of transport over distances of 300 kilometres and longer from road to transport modes with lower CO2 emissions, including shifting containers and other ITUs from road to rail and inland waterways.
The indicator ‘modal shift potential’ provides information on the share of container transport by road that is transported over distances of 300 kilometres or more. This container transport could be shifted to rail or inland waterways transport, thus contributing to the reduction of CO2 from the transport sector. An overview of the development in the volumes of long-distance container transport by road from 2012 to 2022 is given in Table 1 and Figure 9 (in tonne-kilometres) as well as in Table 2 and Figure 10 (in tonnes).
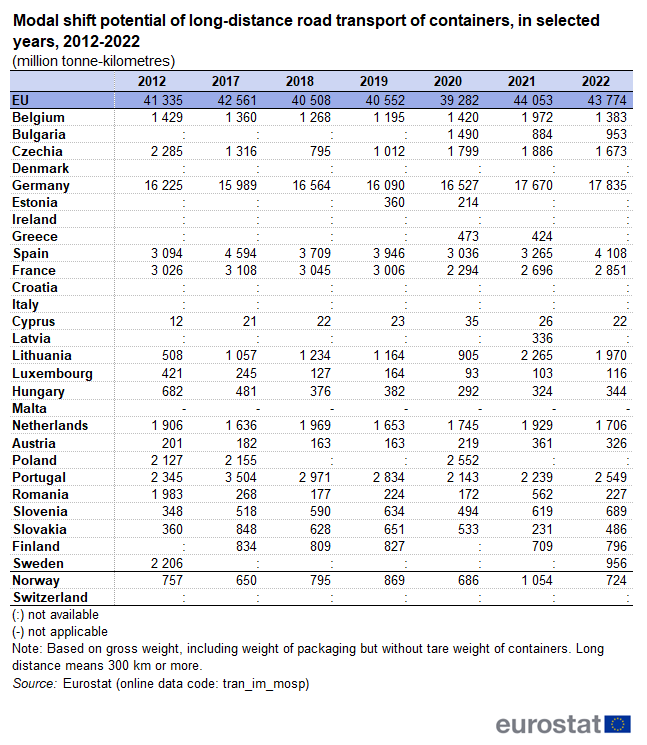
(million tonne-kilometres)
Source: Eurostat, (tran_im_mosp)
The majority of long-distance container transport was carried out by German trucks. In 2022, they achieved 17.8 billion tonne-kilometres, corresponding to 40.7 % of the estimated EU total for that year. Long-distance container transport by road increased for Germany, by 0.9 % between 2021 and 2022. Far behind Germany followed Spain (4.1 billion tonne-kilometres), France (2.9 billion tonne-kilometres), Portugal (2.5 billion tonne-kilometres), Lithuania (2.0 billion tonne-kilometres), the Netherlands and Czechia (each 1.7 billion tonne-kilometres), and Belgium (1.4 billion tonne-kilometres).
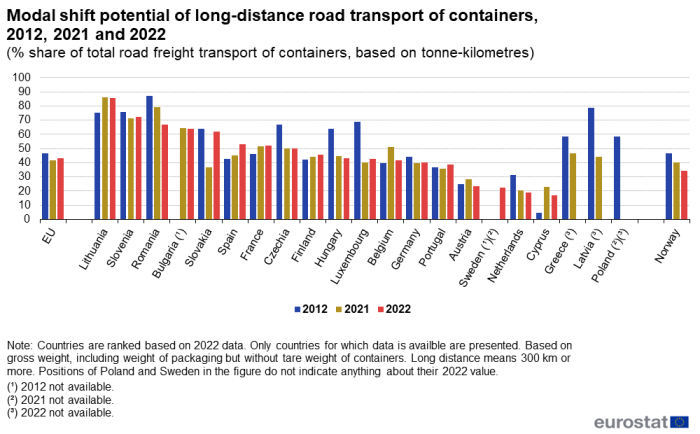
(% share of total road freight transport of containers, based on tonne-kilometres)
Source: Eurostat, (tran_im_mosp)
Out of the 16 EU Member States for which comparable data for both 2012 and 2022 are available, nine recorded a reduction in long-distance container transport in terms of tonne-kilometres (Figure 9). Particularly strong decreases were observed for Romania (-88.6 % to 227 million tonne-kilometres), Luxembourg (-72.4 % to 116 million tonne-kilometres), Sweden (-56.7 % to 956 million tonne-kilometres), Hungary (-49.6 % to 344 million tonne-kilometres) and Czechia (-26.8 %). The countries where such long-distance container transport increased the most between 2012 to 2022 were Lithuania (+287.8 %), Slovenia (+98.0 % to 689 million tonne-kilometres), Cyprus (+83.3 % to 22 million tonne-kilometres), Austria (+62.2 % to 326 million tonne-kilometres), Slovakia (+35.0 % to 486 million tonne-kilometres) and Spain (+32.8 %).
At EU level, long-distance road transport of containers represented 43.3 % of the total road freight transport of containers in 2022, showing a decrease by 3.4 pp compared with 2012, but an increase by 1.5 pp compared with 2021. Among the EU Member States for which data are available, the highest share of long-distance road transport of containers on total road freight transport of containers was recorded by Lithuania (85.8 %) in 2022, followed by Slovenia (72.4 %), Romania (67.0 %), Bulgaria (64.0 %), Slovakia (61.9 %), Spain (53.0 %), France (51.9 %) and Czechia (50.2 %). The lowest shares were observed in Cyprus (16.9 %) and the Netherlands (18.8 %). This share decreased in nine of the 16 EU Member States for which data are available for 2012 and 2022. The largest decrease was observed for Luxembourg (-26.1 pp), followed by Hungary (-20.6 pp), Romania (-20.4 pp), Czechia (-16.9 pp) and the Netherlands (-12.5 pp).
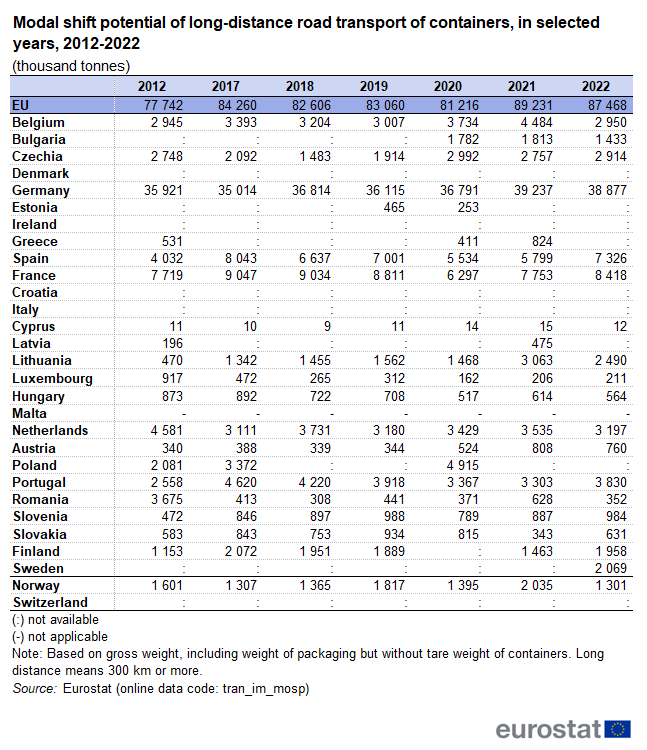
(thousand tonnes)
Source: Eurostat, (tran_im_mospt)
Germany also dominated in terms of tonnes, with 38.9 million tonnes in 2022 (Table 2). All other EU Member States followed far behind, France and Spain being the closest with 8.4 and 7.3 million tonnes respectively. Out of the 16 EU Member States with data for both 2012 and 2022, four recorded a decrease in long-distance container transport in terms of tonnes over this period. Based on tonnes, long-distance road transport of containers represented 9.1 % of the total road freight transport of containers in 2022, at EU level, showing a decrease by 0.3 pp compared with 2012 and an increase by 0.7 pp compared with 2021 (Figure 10). Among the EU Member States for which data are available, the highest share of long-distance road transport of containers on total road freight transport of containers, based on tonnes, was recorded by Lithuania (44.4 %) in 2022, followed by Romania (35.9 %), Slovenia (21.0 %) and Bulgaria (20.7 %). The lowest shares were observed in Cyprus (0.7 %), Sweden ( 2.8 %), the Netherlands (3.1 %), and Austria (3.9 %). Between 2012 and 2022, this share decreased substantially for Luxembourg (-22.0 pp) and Hungary (-6.7 pp) while it grew significantly for Lithuania (+19.9 pp) and Finland (+6.2 pp).
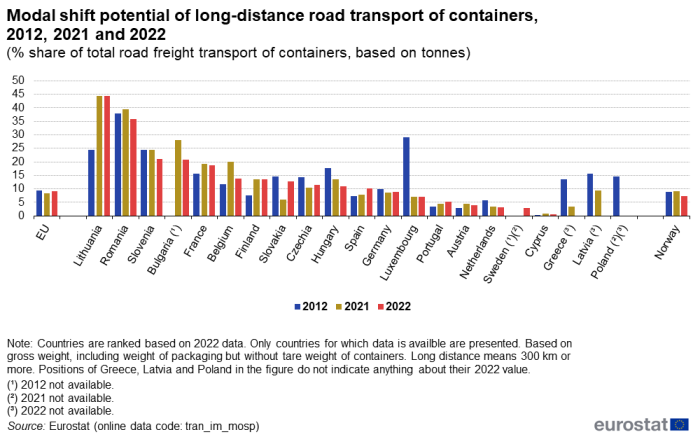
(% share of total road freight transport of containers, based on tonnes)
Source: Eurostat, (tran_im_mospt)
Source data for tables and graphs
Data sources
All figures presented in this article are available in the Eurostat online database. All data used are collected under the relevant EU legal acts for individual transport modes (road transport, rail transport, inland waterways transport and maritime transport).
Data coverage
Generally, the data cover all 27 EU Member States and the two EFTA countries Norway and Switzerland.
However, please note the following for individual modes of transport:
- Rail transport: Cyprus, Malta and Iceland have no railways, while Liechtenstein only has a 9.5 km railway line passing through it.
- Inland waterways transport: 17 EU Member States provide data on a mandatory or voluntary basis: Belgium (BE), Bulgaria (BG), Czechia (CZ), Germany (DE), France (FR), Croatia (HR), Italy (IT), Lithuania (LT), Luxembourg (LU), Hungary (HU), the Netherlands (NL), Austria (AT), Poland (PL), Romania (RO), Slovakia (SK), Finland (FI), Sweden (SE). Italy, Lithuania and Sweden provide a reduced dataset.
- Maritime (sea) transport: Czechia, Luxembourg, Hungary, Austria, Slovakia and Switzerland are landlocked countries and so have no maritime transport.
Definitions
Except for the definitions below, all definitions and concepts in this article are described in the Eurostat/ITF/UNECE Illustrated Glossary for Transport Statistics, 4th edition. This glossary can be found here on the Eurostat website:
Unitisation in freight transport: ‘Unitisation’ expresses the share of goods that are transported in intermodal transport units (ITUs), i.e. standardised transport units suitable for being transported by different modes of transport. ITUs comprise containers, swap bodies and other standardised (in terms of size) packaging, which can be moved with simple equipment (e.g. cranes). In the case of rail freight transport, ITU covers ‘containers and swap bodies, road vehicles (accompanied) and semi-trailers (unaccompanied)’, while for other modes of transport only ‘containers’ are covered. The unitisation shares in this article are calculated based on tonne-kilometres for all modes. The unitisation shares are calculated as the share of goods transported in ITUs in relation to the total goods transport of the respective mode of transport.
Unitisation indicators: Eurostat currently compiles a set of five indicators on the unitisation rate of the different modes of transport, i.e. transport in containers and other ‘intermodal transport units’ as a share of the total freight transport performance by the respective mode of transport. Common to these indicators is the fact that they use data already available from existing statistics and so do not create any additional response burden for the EU Member States. These logistics indicators are:
- freight unitisation as share of total road transport performance
- freight unitisation as share of total rail transport performance
- freight unitisation as share of total inland waterways transport performance
- freight unitisation as share of total short sea shipping freight transport performance
- freight unitisation as share of total deep sea shipping freight transport performance
Short sea shipping: Maritime transport of freight between ports within Europe, on the Mediterranean Sea and the Black Sea, including ferry and feeder traffic.
Deep sea shipping: Maritime freight transport other than short sea shipping, including intercontinental sea transport.
Rail and inland waterway transport data are based on the gross-gross weight of the goods, including both the weight of packaging and of the ITU tare weight.
Maritime and road data are based on the gross weight of the goods, including packaging but without the ITU tare weight.
Symbols
- ':' not available
- '-' not applicable or real zero
- '0' less than half of the unit used and thus rounded to zero
- Italics: estimated value
Context
This article is based on a set of unitisation indicators developed to improve the statistical coverage and analysis of intermodal freight transport in the EU. The data used to compute these indicators are collected under the relevant European legal acts on compilation of statistics for individual modes of transport.
The European Commission White Paper 'Roadmap to a Single European Transport Area — Towards a competitive and resource efficient transport system' (2011) is a cornerstone of European transport policy. Key aims of the White Paper include the consumption of less energy and the use of cleaner energy in transport. It sets out the target of achieving a 60 % reduction in greenhouse gas (GHG) emissions from transport by 2050 compared with 1990 levels. This has strongly increased the interest in and the need for statistics on the transport sector in Europe.
One important strategy to reduce energy consumption and CO2 and GHG emissions of freight transport is to move freight from transport modes with high consumption and emissions to other modes of transport with higher energy efficiency and lower CO2 and GHG emissions. Transporting goods in standardised containers and other ITUs, which can easily be moved from one mode of transport to another (e.g. from road to rail transport), makes it much easier to create efficient ‘intermodal transport chains’ with lower energy consumption and emissions. Intermodal transport also facilitates the establishment of efficient transport corridors.
Direct access to
Other articles
Publications
- Goods transport by road (ttr00005)
- Goods transport by rail (ttr00006)
- Goods transport by inland waterways (ttr00007)
- Sea transport of goods (ttr00009)
- Multimodal data (tran)
- Intermodal transport — unitisation in freight transport (tran_im)
- Unitisation in the different modes of transport (based on tkm for gross weight of goods) (tran_im_umod)
- Unitisation in road freight transport (based on tkm for gross weight of goods) (tran_im_uroad)
- Unitisation in rail freight transport (based on tkm for gross-gross weight of goods) (tran_im_urail)
- Unitisation in inland waterways freight transport (based on tkm for gross-gross weight of goods) (tran_im_uiww)
- Unitisation in maritime freight transport (based on tonnes for gross weight of goods) (tran_im_umar)
- Modal shift potential of long-distance road freight of containers (based on tkm) (tran_im_mosp)
- Modal shift potential of long-distance road freight of containers (based on tonnes) (tran_im_mospt)
- Intermodal transport — unitisation in freight transport (tran_im)
Methodological documents
ESMS Metadata file
- Rail: Regulation (EU) No 2018/643 recast of Regulation (EU) No 2016/2032.
- Road: Regulation (EU) No 70/2012 concerning statistical returns in respect of the carriage of goods by road
- Summaries of EU legislation: Rules for the compilation of statistics regarding goods carried by road
- Inland waterways: Regulation (EU) No 2018/974 of the European Parliament and of the Council on statistics of goods transport by inland waterways
- Maritime: Directive 2009/42/EC on statistical returns in respect of carriage of goods and passengers by sea, and the amendments of this Directive by Commission Decision 2010/216/EU, Regulation (EU) No 1090/2010 and Commission Delegated Decision 2012/186/EU
- Summaries of EU legislation: Statistical returns in respect of carriage of goods and passengers by sea
