1.png)
1.png&body=Statistics Explained - Value of sold production by group of manufacturing activity, EU, 2013 and 2023 (% share of total sold production)1.png %0A https%3A%2F%2Fec.europa.eu%2Feurostat%2Fstatistics-explained%2Findex.php%3Ftitle%3DFile%3AValue_of_sold_production_by_group_of_manufacturing_activity%2C_EU%2C_2013_and_2023_%28%2525_share_of_total_sold_production%291.png)
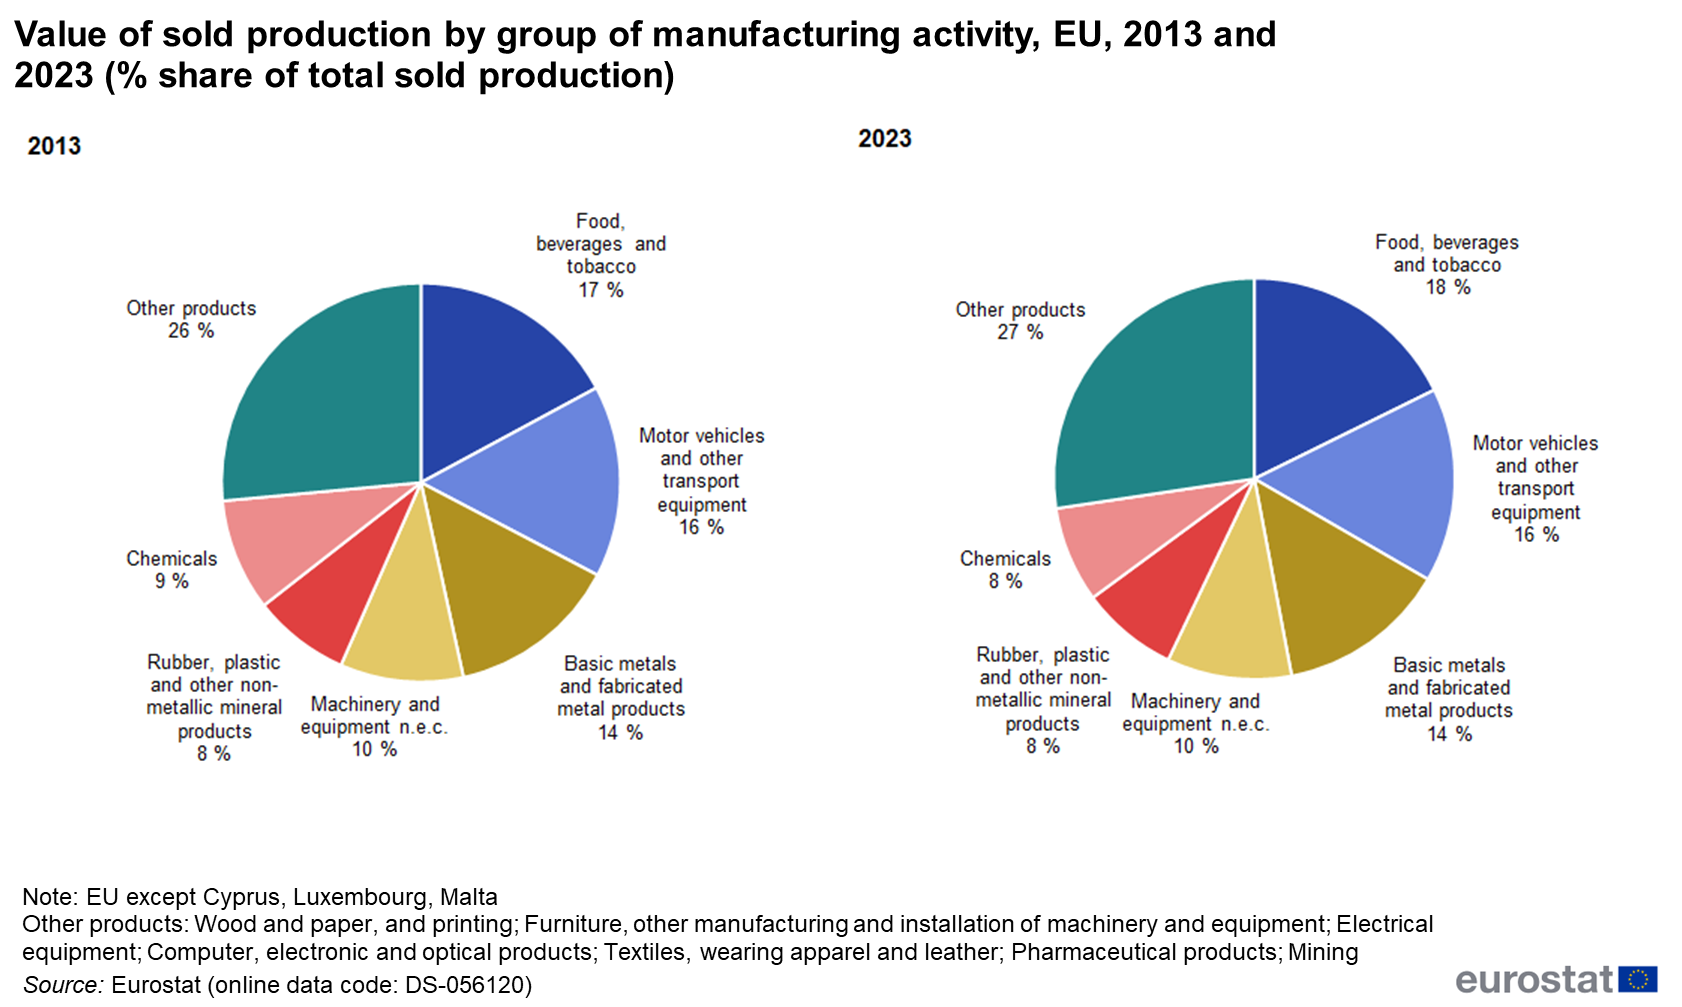
File:Value of sold production by group of manufacturing activity, EU, 2013 and 2023 (% share of total sold production)1.png
Size of this preview: 800 × 479 pixels. Other resolutions: 320 × 192 pixels | 1,682 × 1,007 pixels.
Original file (1,682 × 1,007 pixels, file size: 311 KB, MIME type: image/png)
File usage
The following page uses this file:
1.png&oldid=646212)
1.png)
1.png&action=edit&redlink=1)
1.png&action=history)