_(number)_YB15-de.png)
 (number) YB15-de.png&body=Statistics Explained - Top 30 metropolitan areas in terms of total patent applications to the EPO, 2012 (¹) (number) YB15-de.png %0A https%3A%2F%2Fec.europa.eu%2Feurostat%2Fstatistics-explained%2Findex.php%3Ftitle%3DFile%3ATop_30_metropolitan_areas_in_terms_of_total_patent_applications_to_the_EPO%2C_2012_%28%25C2%25B9%29_%28number%29_YB15-de.png)
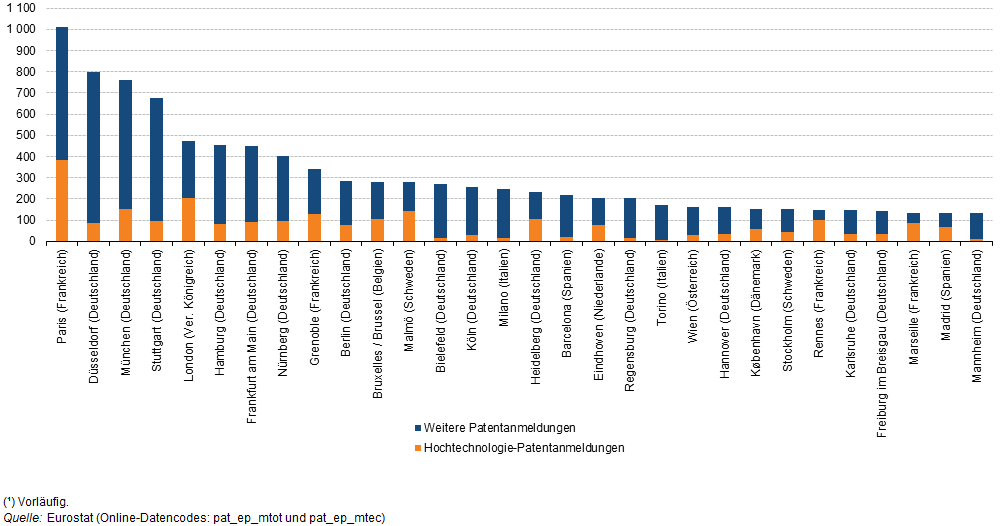
File:Top 30 metropolitan areas in terms of total patent applications to the EPO, 2012 (¹) (number) YB15-de.png
Size of this preview: 800 × 419 pixels. Other resolutions: 320 × 167 pixels | 1,005 × 526 pixels.
Original file (1,005 × 526 pixels, file size: 30 KB, MIME type: image/png)
File usage
The following page uses this file:
_(number)_YB15-de.png&oldid=260551)
_(number)_YB15-de.png)
_(number)_YB15-de.png&action=edit&redlink=1)
_(number)_YB15-de.png&action=history)