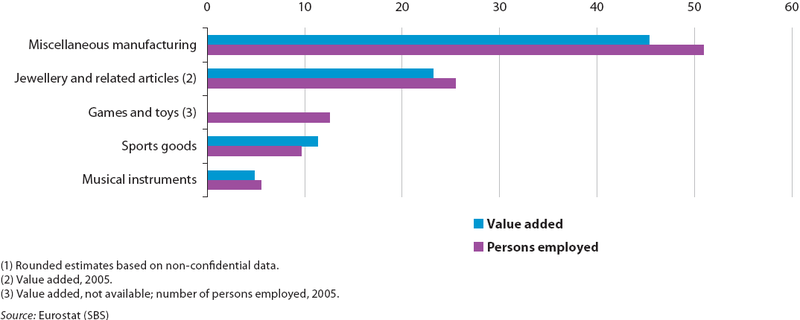
File:Other manufacturing activities (NACE Groups 36.2 to 36.6) Relative weight within other manufacturing activities, EU-27, 2006 (%) (1).PNG

Size of this preview: 800 × 320 pixels. Other resolutions: 320 × 128 pixels | 1,074 × 430 pixels.
Original file (1,074 × 430 pixels, file size: 27 KB, MIME type: image/png)
Other manufacturing activities (NACE Groups 36.2 to 36.6) Relative weight within other manufacturing activities, EU-27, 2006
- (%)
Figure created with data from January 2009
File usage
The following page uses this file: