.png)
.png&body=Statistics Explained - Figure 4 - Evolution of cultural employment in the EU by sex, 2012-2022 (thousands).png %0A https%3A%2F%2Fec.europa.eu%2Feurostat%2Fstatistics-explained%2Findex.php%3Ftitle%3DFile%3AFigure_4_-_Evolution_of_cultural_employment_in_the_EU_by_sex%2C_2012-2022_%28thousands%29.png)
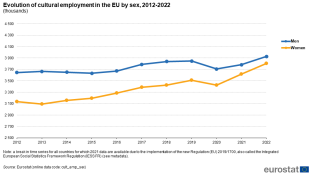
File:Figure 4 - Evolution of cultural employment in the EU by sex, 2012-2022 (thousands).png

Size of this preview: 800 × 440 pixels. Other resolutions: 320 × 176 pixels | 1,048 × 576 pixels.
Original file (1,048 × 576 pixels, file size: 43 KB, MIME type: image/png)
null
File usage
The following page uses this file:
.png&oldid=610321)
.png)
.png&action=edit&redlink=1)
.png&action=history)