_YB17-fr.png)
 YB17-fr.png&body=Statistics Explained - Change in deflated price indices of agricultural input and output, 2010–2015 (average annual rate of change, %) YB17-fr.png %0A https%3A%2F%2Fec.europa.eu%2Feurostat%2Fstatistics-explained%2Findex.php%3Ftitle%3DFile%3AChange_in_deflated_price_indices_of_agricultural_input_and_output%2C_2010%25E2%2580%25932015_%28average_annual_rate_of_change%2C_%2525%29_YB17-fr.png)
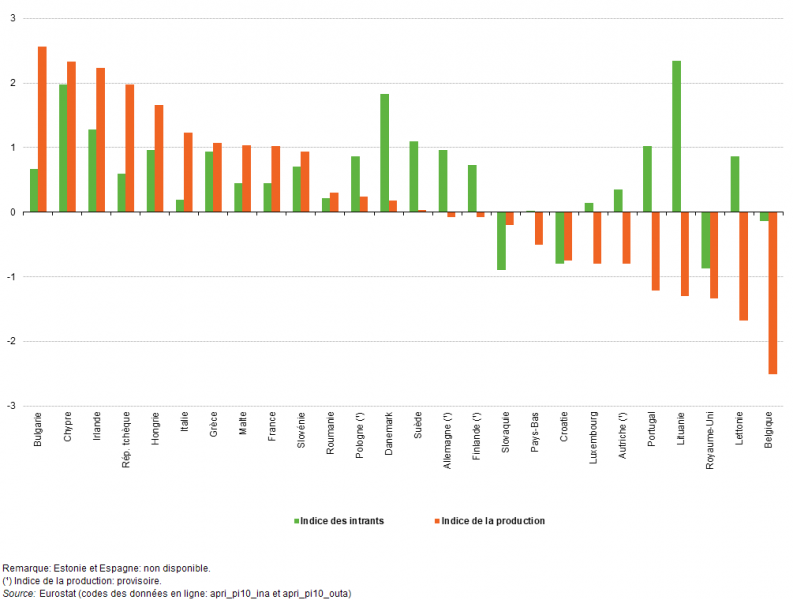
File:Change in deflated price indices of agricultural input and output, 2010–2015 (average annual rate of change, %) YB17-fr.png

Size of this preview: 793 × 600 pixels. Other resolutions: 318 × 240 pixels | 1,005 × 760 pixels.
Original file (1,005 × 760 pixels, file size: 30 KB, MIME type: image/png)
File usage
The following page uses this file:
_YB17-fr.png&oldid=342497)
_YB17-fr.png)
_YB17-fr.png&action=edit&redlink=1)
_YB17-fr.png&action=history)