European Neighbourhood Policy - East - education statistics
Data extracted in January 2023.
Planned article update: April 2024.
Highlights
Among the European Neighbourhood Policy-East countries, public expenditure on education as a percentage of GDP ranged from 2.7 % in Armenia (2021 data) to 5.4 % in Ukraine (2020 data) and 5.6 % in Moldova (2018 data). In 2020, EU public spending on education was 5.0 % of GDP.
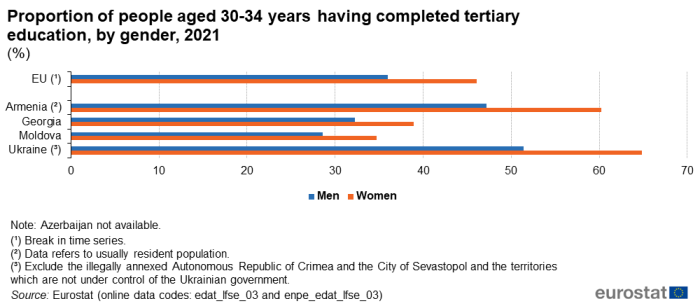
A higher proportion of women aged 30-34 had completed tertiary education in 2021 in Ukraine (65 %) and Armenia (60 %) than in the EU (46 %).
Among the European Neighbourhood Policy-East countries, more than 90 % of young adults aged 20-24 years in Ukraine and Georgia had completed at least an upper secondary education in 2021, compared with 85 % in the EU.
Public expenditure on education as a share of GDP, 2011-2021
This article is part of an online publication; it presents information on five European Neighbourhood Policy-East (ENP-East) countries, namely, Armenia, Azerbaijan, Georgia, Moldova and Ukraine, compared with the European Union (EU). Georgia, Moldova and Ukraine also all became enlargement countries in 2022. The European Council gave the three a European perspective and granted Moldova and Ukraine candidate status on 23 June 2022. This article does not contain any data on Belarus, as statistical cooperation with Belarus has been suspended as of March 2022.
Data shown for Georgia exclude the regions of Abkhazia and South Ossetia over which Georgia does not exercise control. The data managed by the National Bureau of Statistics of the Republic of Moldova does not include data from Transnistria over which the government of the Republic of Moldova does not exercise control. Since 2014, data for Ukraine generally exclude the illegally annexed Autonomous Republic of Crimea and the City of Sevastopol and the territories which are not under control of the Ukrainian government. The latest statistics in this Statistics Explained article cover the calendar year 2021, before Russia's invasion of Ukraine. Data on Ukraine for the year 2021 is limited due to exemption under the martial law from mandatory data submission to the State Statistics Service of Ukraine, effective as of 3 March 2022.
The article includes information relating to public expenditure on education, numbers of pupils and students, educational attainment among young adults, and tertiary education.
Full article
Expenditure on education
Figure 1 shows the share of public expenditure on education relative to gross domestic product (GDP) over the period 2011-2021. This ratio can be affected by government policy on educational expenditure, the number of school-age children and overall economic performance as measured by GDP. During an economic recession, the share of education within GDP might rise if governments attempt to maintain educational expenditure. Inter-country comparisons can, in particular, be affected by the proportion of school-age children in the population.
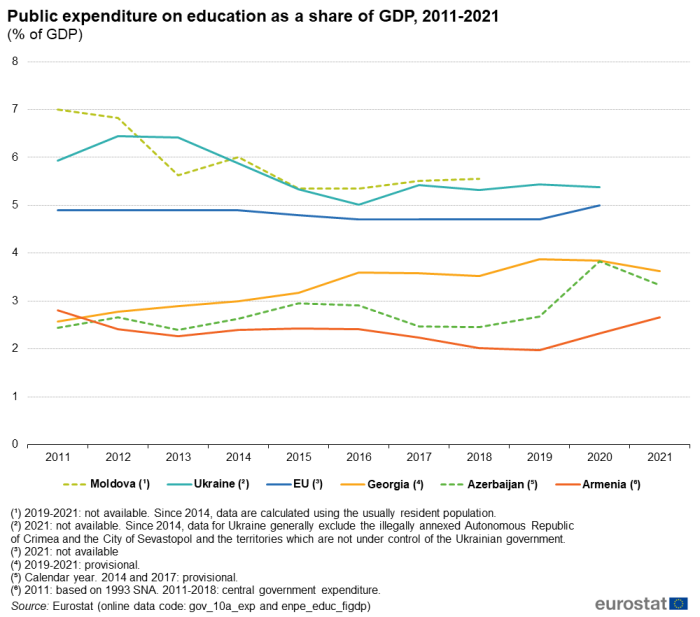
(% of GDP)
Source: Eurostat (gov_10a_exp) and (enpe_educ_figdp)
The proportion of GDP spent on education by general government fell in Moldova and Ukraine, comparing 2011 with the latest year for which data is available. In Moldova, public expenditure on education fell from 7.0 % of GDP in 2011 to 5.6 % in 2018 (the most recent year available). In both years this was the highest share of GDP in any ENP-East country. Ukraine's public expenditure on education fell from 5.9 % of GDP in 2011, the second highest ENP-East country, to 5.4 % in 2020 (most recent data). This was still higher than most of the other ENP-East countries.
Armenia saw its public expenditure on education remain approximately stable (although the data definition has changed) over the period in question. The share of GDP was 2.8 % in 2011 (central government expenditure only) and 2.7 % in 2021, the lowest among the ENP-East countries. Azerbaijan's expenditure on education as a share of GDP was consistently low until recently: 2.4 % of GDP in 2011 and 2.7 % in 2019. It then rose to 3.3 % in 2021, although a fall in GDP may be the main factor. Georgia also showed an increase in the share of education expenditure, from 2.6 % of GDP on education in 2011 to 3.6 % (provisional data) in 2021. For comparison, the share of education expenditure in EU GDP was 4.9 % in 2011 and 5.0 % in 2020, the most recent data available.
Figure 2 shows public expenditure on education as a share of total public expenditure, 2011-2021. This statistic abstracts from the overall economic cycle - the graph in Figure 2 should be read together with the graph in Figure 1. Public expenditure on education as a share of total public expenditure can show an increase if overall government expenditure is being reduced but education is protected from budget cuts. Since the definitions of expenditure often differ between countries, analyses over time for each country are often more useful than inter-country comparisons for this indicator.
Armenia's expenditure on education was 10.5 % of central government expenditure in 2011. It was 9.0 % of total public expenditure in 2021 – the two data points are not strictly comparable. Ukraine's public expenditure on education started at 13.6 % of total public spending in 2011, but declined to 12.0 % in 2020, the most recent data. From an even higher figure of 21.6 % in 2011, Moldova's estimated expenditure fell to 17.6 % of total public spending in 2018, the most recent data available. This was still the highest recorded in the region that year.
Azerbaijan's share of public spending on education was essentially the same in 2011 at 10.0 % as in 2021 at 10.5 %. Georgia's educational expenditure increased as a share of public expenditure from 11.3 % in 2011 to a provisional figure of 14.2 % in 2021. This was the highest recorded in the ENP-East region in 2021, although definitions differ and 2021 data are not yet available for Moldova and Ukraine.
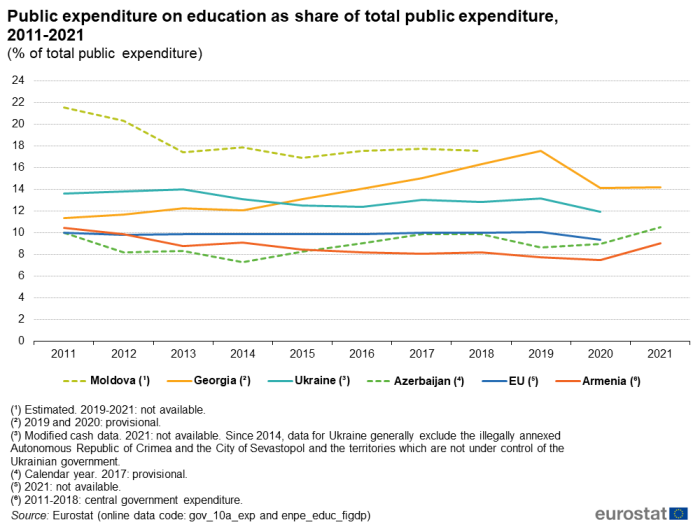
(% of total public expenditure)
Source: Eurostat (gov_10a_exp) and (enpe_educ_figdp)
The EU's expenditure on education as a proportion of public expenditure remained close to constant for most of the period, at 10.0 % in 2011 and 10.1 % in 2019. It then fell to 9.4 % in 2020, the most recent year for which data is available.
Numbers of pupils and students
Figure 3 presents data showing the distribution of pupils and students across the various educational levels (classified according to the International Standard Classification of Education (ISCED 2011)).
Based on the latest available data for each country, there were 11.0 million pupils and students attending educational establishments from pre-primary to tertiary education in the ENP-East countries in 2021. The shares of the various education bands are largely determined by the numbers of pupils and students attending upper secondary, post-secondary non-tertiary education and tertiary education. Demographic change in the relevant age groups may also play a role.
In 2021, the share of pupils in pre-primary and primary education of total pupils / students in the ENP-East countries was 38.2 % in Armenia (estimated); 39.4 % in Azerbaijan (estimated); 39.9 % in Ukraine; and 43.6 % in Georgia. Moldova was a slight outlier on the upper side with its share of pupils in pre-primary and primary education at 45.9 %.
Taking lower and higher secondary education together, Georgia had the smallest proportion of pupils at secondary level with 34.9 %, reflecting that it had a slightly higher proportion of students in tertiary and other post-secondary education than most of the other ENP-East countries, at 21.4 %. In Ukraine, 38.4 % of students attended secondary education, while the share of tertiary and other post-secondary education was at 21.7 %. Azerbaijan had an estimated 47.5 % of its pupils /students in secondary education; Armenia 46.1 %; and Moldova 39.9 %.
Other ENP-East countries reported lower levels of students in tertiary and other post-secondary education in 2021 than Georgia and Ukraine: in Armenia, 15.7 % of students studied at this level, while the share was 14.2 % in Moldova and 13.1 % in Azerbaijan.
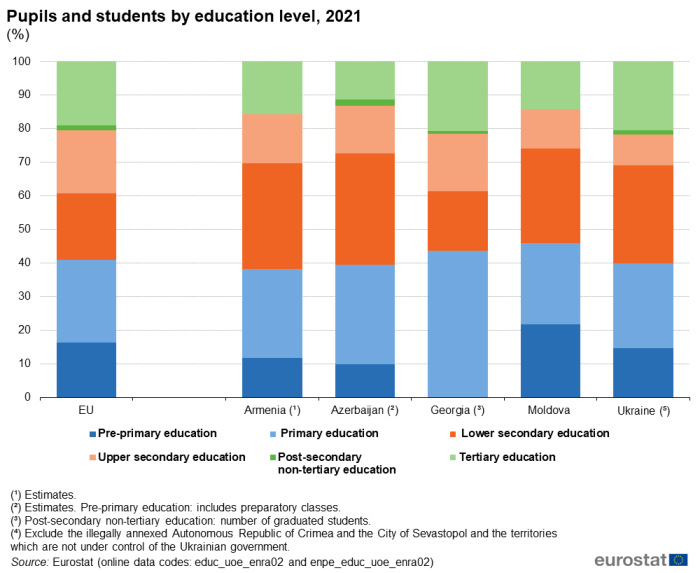
(%)
Source: Eurostat (educ_uoe_enra02) and (enpe_educ_uoe_enra02)
There were more than 95 million pupils and students in the EU in 2021. One-fifth, 20.4 %, of these were in tertiary and other post-secondary education. 40.8 % of all EU students and pupils attended primary or pre-primary education, and 38.8 % of pupils were in secondary school.
Educational attainment among people aged 20-24 years
Figure 4 shows the proportion of the population group aged 20-24 years who achieved at least an upper secondary educational level — otherwise referred to as the youth education attainment level — in 2011 and 2021 for the ENP-East countries and the EU.
Among the ENP-East countries there were considerable differences in the education attainment levels among these young adults. In Ukraine 97.5 % of women and 97.1 % of men aged 20-24 years had completed at least an upper secondary level of education in 2021. This was an improvement on the situation in 2011, when the levels were 95.7 % and 94.2 % respectively. Georgia also had high levels of youth education attainment in 2021: 91.9 % of young men and 92.5 % of young women had completed upper secondary school. Ten years earlier, the figures had been 91.5 % for men and 95.2 % for women. Note the decline in female education attainment over the period.
Moldova saw a small increase in male education attainment from 70.6 % having completed upper secondary school in 2011 to 72.7 % in 2021. Over the same period, female attainment declined marginally from 80.8 % to 80.6 %. Larger increases for both sexes occurred in Armenia, although at a much lower level: male education attainment increased from 46.3 % (2009 data) to 57.6 %; and female education attainment from 34.2 % (2009 data) to 44.5 %. Armenia was the only country in the region where the share of young men completing upper secondary school was higher than the corresponding share of young women, so that there was a male-led education gender gap.
No recent data on educational attainment is available for Azerbaijan.
In the EU, 82.1 % of young men and 87.3 % of young women had completed upper secondary school in 2021. Both data had increased by around 5 percentage points compared with the situation in 2011.
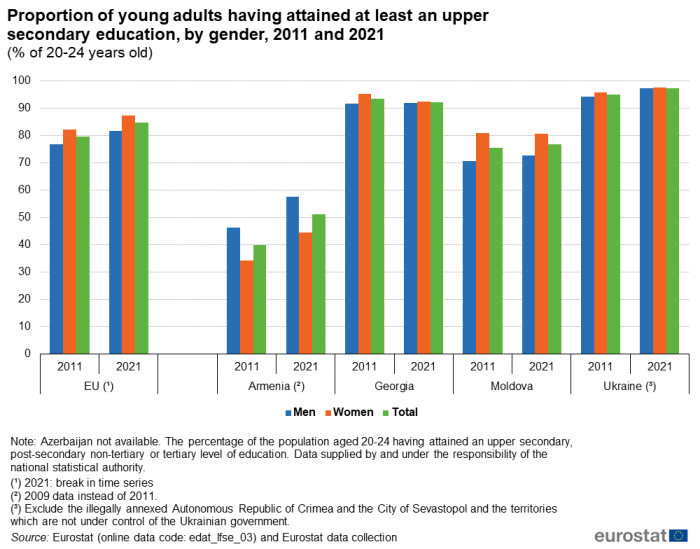
(% of 20-24 years old)
Source: Eurostat (edat_lfse_03) and Eurostat data collection
Tertiary education
Tertiary education is defined by ISCED 2011 levels 5 to 8 – see the Data Sources section for more information. Figure 5 shows the proportion of 30–34-year-olds in 2021 who had completed a tertiary level of education.
Ukraine had the highest overall proportion of tertiary qualification holders among ENP-East countries, with 2021 figures of 51.4 % of men and 64.8 % of women, in total 58.0 %. In Armenia, the figures were 47.2 % of men and 60.2 % of women, 54.0 % in all.
In Georgia, 35.5 % among the 30-34 years age group had completed tertiary education in 2021, comprising 32.3 % of men and 38.9 % of women. Moldova had 28.6 % of men and 34.7 % of women qualified at tertiary level in 2021, for a total of 31.8 %. At tertiary level, there is a substantial female-led tertiary education gender gap in all ENP-East countries reporting, with higher shares of women achieving this education level than men. Data are not available for Azerbaijan.
In comparison, in the EU 41.0 % of young people aged 30-34 years had completed tertiary education in 2021; this corresponded to 46.1 % among women and 36.0 % among men.
(%)
Source: Eurostat (edat_lfse_03) and (enpe_edat_lfse_03)
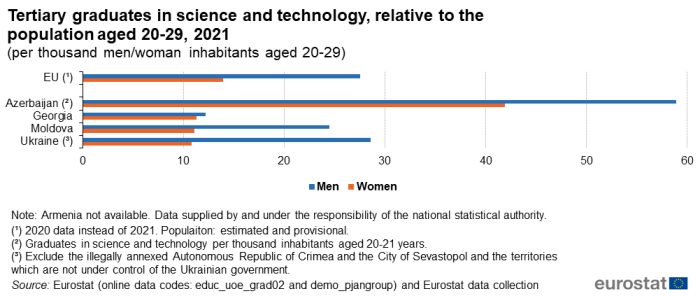
Figure 6 shows the ratio of people graduating with a tertiary science or technology degree relative to the total population aged 20-29 years in 2021. The ratio of men having graduated from a science or technology discipline per 1 000 male inhabitants aged 20-29 years was higher in Azerbaijan and Ukraine than in the EU (2020 data), being 58.9, 28.6 and 27.6 respectively. The corresponding ratios for women were 41.9 in Azerbaijan and 10.8 in Ukraine, lower than the ratio in the EU, at 13.9. Note that the footnote to Figure 6 shows the different data definition used by Azerbaijan. Note also that the ratio of male tertiary graduates in science and technology in the EU to the age group population was almost twice as high as for females.
In Georgia in 2021, 12.2 of males aged 20-29 years and 11.3 of females per thousand population graduated with science and technology degrees. These data are not available for Armenia.
(per thousand men and women aged 20-29)
Source: Eurostat (educ_uoe_grad02), (demo_pjangroup) and Eurostat data collection
Source data for tables and graphs
Data sources
The data for ENP-East countries are supplied by and under the responsibility of the national statistical authorities of each country on a voluntary basis. The data result from an annual data collection cycle that has been established by Eurostat. These statistics are available free-of-charge on Eurostat's website, together with a range of additional indicators for ENP-East countries covering most socio-economic topics.
Education statistics cover a range of subjects, including: expenditure, personnel, participation and attainment. The standards for international statistics on education are set by three organisations:
- the United Nations Educational, Scientific, and Cultural Organisation (UNESCO) Institute for Statistics (UIS);
- the Organisation for Economic Cooperation and Development (OECD);
- Eurostat, the statistical office of the European Union.
The main source of data for the EU aggregate is a joint UNESCO/OECD/Eurostat (UOE) questionnaire on education systems. This is the basis for the core components of the Eurostat database on education statistics; Eurostat also collects data on regional enrolments and foreign language learning. EU data on educational attainment are mainly provided through household surveys, in particular the EU labour force survey (LFS).
Note that the collection of data on education underwent a considerable change as a result of the introduction of a new version of ISCED, namely ISCED 2011, replacing ISCED 1997. Longer time series are generally available on the basis of ISCED 1997, while data for the EU and its Member States are often available on the basis of ISCED 2011 from the 2014 reference year.
Tables in this article use the following notation:
| Value in italics | data value is forecasted, provisional or estimated and is therefore likely to change; |
| : | not available, confidential or unreliable value; |
| – | not applicable. |
Context
Each EU Member State is responsible for its own education and training systems. As such, EU policy in this area is designed to support national action and address common challenges, by providing a forum for exchanging best practices.
The strategic framework for European cooperation in education and training was adopted by the Council in May 2009, with the following common objectives for 2020:
- Making lifelong learning and mobility a reality
- Improving the quality and efficiency of education and training
- Promoting equity, social cohesion, and active citizenship
- Enhancing creativity and innovation, including entrepreneurship, at all levels of education and training
In 2021, a new 'Strategic framework for European cooperation in education and training towards the European Education Area and beyond (2021-2030)' was adopted by Council Resolution 2021/C 66/01. This sets the following strategic priorities:
- Improving quality, equity, inclusion and success for all in education and training.
- Making lifelong learning and mobility a reality for all.
- Enhancing competences and motivation in the education profession.
- Reinforcing European higher education.
- Supporting the green and digital transitions in and through education and training.
On 2 July 2021, the European Commission and the EU's High Representative for Foreign Affairs and Security Policy presented the Eastern Partnership: a Renewed Agenda for cooperation with the EU's Eastern partners. This agenda is based on the five long-term objectives, with resilience at its core, as defined for the future of the Eastern Partnership in the Joint Communication Eastern Partnership policy beyond 2020: Reinforcing Resilience – an Eastern Partnership that delivers for all in March 2020. It is further elaborated in the Joint Staff Working Document Recovery, resilience and reform: post 2020 Eastern Partnership priorities. It will be underpinned by an Economic and Investment plan. The Joint Declaration of the Eastern Partnership Summit 'Recovery, Resilience and Reform' of 15 December 2021 reaffirms strong commitment to a strategic, ambitious and forward-looking Eastern Partnership.
In cooperation with its ENP partners, Eurostat has the responsibility 'to promote and implement the use of European and internationally recognised standards and methodology for the production of statistics, necessary for developing and monitoring policy achievements in all policy areas'. Eurostat undertakes the task of coordinating EU efforts to increase the statistical capacity of the ENP countries. Additional information on the policy context of the ENP is provided here.
Direct access to
Books
- Statistics on European Neighbourhood Policy countries: East — 2018 edition
- Basic figures on the European Neighbourhood Policy-East countries — 2023 edition
Leaflets
- Basic figures on the European Neighbourhood Policy — East countries — 2020 edition
- Basic figures on the European Neighbourhood Policy — East countries — 2019 edition
- Basic figures on the European Neighbourhood Policy — East countries — 2018 edition
- Basic figures on the European Neighbourhood Policy — East countries — 2016 edition
- Basic figures on the European Neighbourhood Policy — East countries — 2015 edition
- Basic figures on the European Neighbourhood Policy — East countries — 2014 edition
- International trade for the European Neighbourhood Policy — East countries — 2016 edition
- European Neighbourhood Policy-East countries — Statistics on living conditions — 2015 edition
- European Neighbourhood Policy — East countries — Key economic statistics — 2014 edition
- European Neighbourhood Policy — East countries — Labour market statistics — 2014 edition
- European Neighbourhood Policy — East countries — Youth statistics — 2014 edition
- Population and social conditions (enpe_pop)
- Education (enpe_educ)
- Participation in education (enpe_educ_part)
- Expenditure on education (enpe_educ_fine)
- Educational attainment level (enpe_edat_lfs)
- Early leavers from education and training (enpe_edatt)
- Education (enpe_educ)
- Participation in education and training (educ_part)
- Education finance (educ_uoe_fin)
- Education and training outcomes (educ_outc)
- Eastern European Neighbourhood Policy countries (ENP-East) (ESMS metadata file — enpe_esms)
- Education administrative data from 2013 onwards (ISCED 2011) (ESMS metadata file — educ_uoe_enr_esms)
- European External Action Service — European Neighbourhood Policy
- Joint Communication JOIN(2020) 7 final: Eastern Partnership policy beyond 2020: Reinforcing Resilience - an Eastern Partnership that delivers for all (18 March 2020)
- Joint Staff Working Document SWD(2021) 186 final: Recovery, resilience and reform: post 2020 Eastern Partnership priorities (2 July 2021)
- Joint Declaration of the Eastern Partnership Summit: 'Recovery, Resilience and Reform' (15 December 2021)
- Directorate-General for Education and Training
- Education, training and youth
- Strategic framework for European cooperation in education and training (ET 2020)
- Education and Training Monitor – annual publication on national education and training systems in the EU
- Erasmus+