Concepts for household consumption - comparison between micro and macro approach
Data extracted in March 2018.
No planned article update.

Source: Eurostat (nama_10_co3_p3)
Income, consumption and wealth (ICW) determine the financial situation and material well-being of households and individuals. National Accounts (NA) and Social statistics are two separate statistical sources of data available to users and policy-makers. ICW aggregates (NA), which describe the situation of households as an institutional unit in the macroeconomic context, are used in macroeconomic policy analysis; while distributions of ICW based on micro data (Household Budget Survey (HBS)) are used to measure inequality in social policies. This article discusses some of the comparability issues surrounding household consumption concepts and data.
Although both data sources show the level and patterns of household consumption expenditure, there are conceptual and data collection differences (see ‘Data sources’). The reason for comparing micro and macro statistics on household consumption expenditure is the need to understand the two data sources and build strong links between them. Both data sources use the Classification of Individual Consumption According to Purpose (COICOP). For more information; see ‘Data sources’.
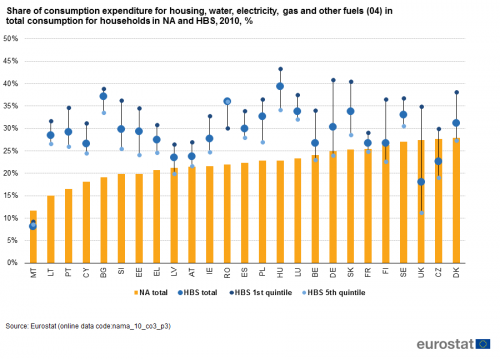
Figure 1 contains an example of a complimentary analysis of consumption expenditure as measured in NA and in HBS. It shows the share of household consumption expenditure in terms of total consumption for housing, water, electricity, gas and other fuels (04). This consumption category contributes the most to total consumption in both sources. While the macro aggregates only show the average share of consumption components, HBS data can provide detailed information on sub-population groups. Both data sources are first compared at aggregated level; HBS data are then used to show the distribution patterns across income quintiles. The results of the first step reveal a disparity in data consistency across countries: for Finland, France, Latvia, Austria and Belgium, both sources (NA and HBS) indicate similar shares; for Bulgaria, Hungary, Lithuania, Romania, Portugal and the United Kingdom, the differences between the data sources are considerable. It highlights the need to gain a better understanding of both data sources and reasons for the existing data gaps. On distributions, Figure 1 shows inequality in the consumption shares for the 1st and 5th income quintile in HBS data: the largest being for the United Kingdom (29 percentage points), Germany (19 percentage points), and Slovakia (21 percentage points).
Total consumption and its components is compared across both sources by describing the data gaps in terms of coverage rates (calculated as the HBS and NA ratio) and possible reasons for such gaps. The results reflect differences between the methodologies used for the HBS and NA, and differences in implementation across the EU countries. The information is provided for the countries that have available data (see ‘Data sources’).
Full article
Relevance and coverage rates for household consumption
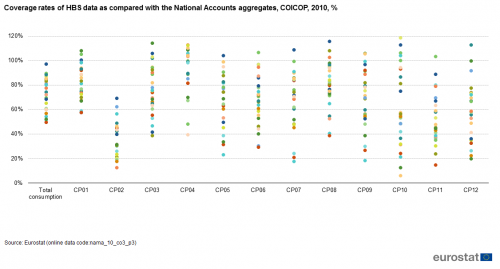
Figure 2 shows the coverage rate for each consumption item. Coverage rates are computed — for each consumption category — as a percentage ratio between HBS aggregated data and NA. For total consumption, the coverage rates are between 50 % and 97 %, with consistent differences among consumption items. The highest coverage rates are detected for housing, water, electricity, gas and other fuel (04; between 40 % in the United Kingdom and 128 % in Cyprus), while the lowest rates are for alcoholic beverages, tobacco and narcotics (02; between 13 % in Luxembourg and 69 % in Denmark). Dispersion of coverage rates also differs considerably among consumption categories: between 58 % and 108 % for food (01), and between 6 % and 119 % for education(10).

Source: Eurostat (nama_10_co3_p3)
The coverage rate for each consumption category together with the corresponding weight of this category in the total consumption determines the impact on the overall data gap.
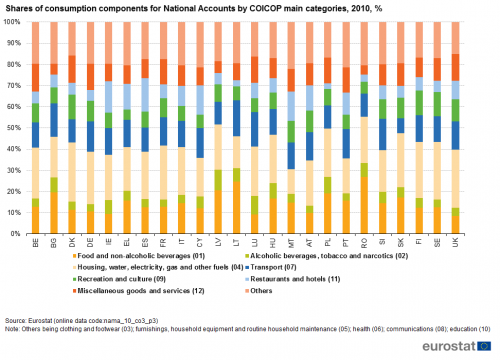
Figure 3 shows the share of the consumption components as measured in National Accounts, which corresponds to the data collection year in the HBS (see ‘Data sources’). The largest shares of consumption are for housing, water, electricity, gas and other fuels (04); food and non-alcoholic beverages (01); transport (07); and miscellaneous goods and services (12), making up 60 % of total consumption for the countries that have available data. It means that the overall data gap is largely determined by the coverage rates of those consumption categories.

Source: Eurostat (nama_10_co3_p3)
Figure 4 shows the data gap between the HBS and NA (defined as the difference between HBS and NA data expressed in per cent) together with the relative contribution of each consumption component to the gap. The data gap for total household consumption is 27 % on average. Although the categories contributing to the data gap vary from country to country, there are several common patterns: for the countries with the largest data gaps between sources, the biggest contributors (in absolute terms) to the gaps are housing (04), transport (07), restaurants and hotels (10),and miscellaneous goods and services (12) consumption. The housing (04) item includes imputed rents that some countries (e.g. the United Kingdom) did not provide in the HBS, which could explain the data gap for this consumption item.

Source: Eurostat (nama_10_co3_p3)
Conclusions
- The average coverage rate between the HBS and National Accounts for household consumption is around 73 %; the smallest differences and disparities among the countries are for food and non-alcoholic beverages (01).
- The largest shares of household consumption in National Accounts are for housing, water, electricity, gas and other fuels (04); food and non-alcoholic beverages (01); transport (07) and miscellaneous goods and services (12), making up 60 % of total consumption for available countries.
- The household consumption comparison between sources was carried out for reference year 2010; the exercise will be repeated once the 2015 data become available.
- In this article, household total consumption in National Accounts and in the HBS is compared centrally on an experimental basis. Given that some differences in the gap are country-specific, the EU countries are encouraged to repeat the exercise nationally, possibly using more detailed data or other data, and investigate the potential sources for data gaps, in particular that results largely differ from one country to another.
Feedback
To help Eurostat improve these experimental statistics, users and researchers are kindly invited to give us their feedback by email
Source data for tables and graphs
Data sources
Both National Accounts and the HBS use COICOP for household consumption. Total household consumption is obtained by adding the following consumption categories together:
- food and non-alcoholic beverages (01);
- alcoholic beverages, tobacco and narcotics (02);
- clothing and footwear (03);
- housing, water, electricity, gas and other fuels (04);
- furnishings, household equipment and routine household maintenance (05);
- health (06);
- transport (07);
- communications (08);
- recreation and culture (09);
- education (10);
- restaurants and hotels (11);
- miscellaneous goods and services (12).
COICOP does not include individual consumption expenditures such as health, education and social protection that government or non-profit institutions provide to households. Imputed transitions that are imputed rents of owner-occupied dwellings are included in both sources in the housing, water, electricity, gas and other fuels (04) category; however, the imputation methods in micro and macro sources might be different at national level.
In the National Accounts, the households sector data follow the sequence of accounts and the accounting methodology set out in the National Accounts framework. The interaction between the households sector and other institutional sectors is recorded in a closed framework. It is important to maintain both horizontal consistency across the accounts — among institutional sectors — and vertical consistency between the non-financial and financial parts of the accounts within the institutional unit. National accounts are not specifically intended to cover aspects of households’ material well-being. In the National Accounts, various sources could be used to derive household consumption, and HBS data can be part of them; however, other sources exist, such as retail data, administrative data source on value added tax, etc. Moreover balancing process of National Accounts could have relevant impact on consumption.
The HBS is a sample survey of private households carried out regularly by the National Statistical Institutes (NSIs) on a voluntary basis as it is currently not regulated at EU level. HBS data are transmitted to Eurostat every 5 years, although data are collected more frequently in some countries. In cooperation with the NSIs, Eurostat has worked on the quality and comparability of HBS statistics within the EU. The HBS describes the amounts and structure of household expenditures in EU countries. Due to the nature of data collection, the consumption item spending is defined by households themselves by way of diaries. The outcome of the survey is the structure of household consumption by income quintile, age of reference person or household type. In general, the structured HBS is partially used to calculate consumer price indices, including the harmonised consumer price index.
Although both data sources collect information on household consumption expenditure, there are notable differences in some methodological and data collection aspects that are general and specific to item differences. General differences include: reference population, domestic versus national concept of consumption; and measurement errors. Specific differences relate to specific consumption categories.
General differences
Reference population
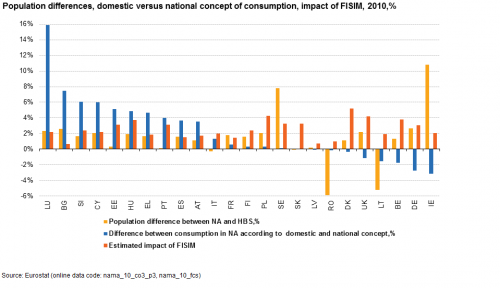
In the HBS, the reference population includes all private households residing in the country that have a registered place of residence; people living in institutional households or without a registered place of residence are therefore excluded (e.g. hospitals, prisons etc.). Moreover, in some countries the sample of HBS does not include population above specific age. Practical solutions to overcome this issue in the analysis of the data range — from a ‘naïve’ adjustment of National Accounts consumption by proportionally removing the consumption of the population not covered in the micro source to a more precise analysis — could be performed at national level based on additional information. In this article, the population in both sources has been adjusted (see Figure 5). However, the differences between the HBS population and National Accounts population may also include some country-specific issues.
Domestic vs national concept of consumption
In the National Accounts COICOP tables, individual consumption expenditure refers to consumption (P.3- Final consumption expenditure by purpose; ESA 2010) in the national territory; non-resident consumption in the national territory is included, whereas resident consumption abroad is not included (domestic concept). The micro data collected in the HBS cover resident (private household) expenditures both nationally and abroad and do not include non-resident consumption in the national territory (national concept). These differences could be one reason for data gaps between both sources, in particular for transport (07), restaurants and hotels (11), and recreation services (09). Figure 5 provides a comparison between consumption in National Accounts according to the national and domestic concept. The largest difference is observed for Luxembourg — this may be explained by the large number of cross-border commuters. The adjustment for taking into account the domestic/national consumption concept is complex and has not been carried out as Eurostat does not have the required level of data detail.
Measurement errors
The information is collected by the HBS and could be biased due to estimation and measurement errors, in particular for demerit goods (e.g. alcoholic beverages, tobacco and narcotics (02)). The consumption of the wealthiest part of the population might not be reflected fully in the HBS survey data. Under-coverage of the wealthiest population could cause significant data gaps. However, it is expected that the impact of this phenomena is less pronounced for consumption than it is for income.
Specific differences
Specific differences are related to particular consumption items. National Accounts household consumption includes Financial Intermediation Services Indirectly Measured (FISIM), insurance services, and wages in kind that are not included in the HBS. In the National Accounts COICOP, the FISIM item is included in consumption category miscellaneous goods and services (12; financial services not elsewhere classified (12.6)). Figure 5 shows approximate estimation (corresponding to 12.6) of the impact of FISIM on total consumption in National Accounts, more detailed data are needed for precise estimation. These expenditures are imputed in the National Accounts; however, they are not collected (or imputed) in the HBS.
In turn, HBS includes second-hand goods that are domestically traded from one family to another (e.g. cars, clothes etc.), however they are not included in National Accounts household consumption, as they are cancelled out in aggregates. HBS also includes expenditure on repairs on owner occupied dwellings that are considered as intermediate (not final) consumption in the National Accounts.

Source: Eurostat (nama_10_co3_p3)
Methods used in this article
2010 is used as the reference year in this article. The HBS differs from the reference year for some countries: 2008 — Malta, Germany, Lithuania; 2009 — Cyprus, Denmark and Sweden; 2012 —Finland. The corresponding data are used for National Accounts for the purpose of the analysis; the National Accounts data for consumption are adjusted according to the population differences between the HBS and National Accounts. Coverage rates between the HBS and National Accounts: aggregated data from the HBS are divided by corresponding National Accounts aggregates, expressed in per cent.
In this article, the comparison between household consumption in the National Accounts and in the HBS is carried out centrally on an experimental basis. International statistical organisations have encouraged countries to carry out the exercise nationally, possibly using other additional micro data sources available nationally (for example, national surveys and administrative registers).
Context
Several international statistical initiatives are ongoing to coordinate and produce consistent data for distributions of ICW. In close cooperation with Eurostat and the ECB, the OECD is coordinating the work of G-20 Recommendation I.9 ‘to encourage the production and dissemination of distributional information (such as information by income quintile), for the household sector’. In 2011, the OECD and Eurostat created a joint Expert Group on disparities in National Accounts. In 2014, the OECD relaunched the expert group to produce household distributional information on income, consumption and savings. The relevance of the distributive indicators for households’ ICW in the EU was highlighted by the Vienna Memorandum signed by the European Statistical System Committee on 28 September 2016 in Austria. In 2016, Eurostat launched two experimental statistical work streams: (i) joint distributions of ICW by using the existing micro data sources and statistical matching techniques; and (ii) developing robust bridges between micro and macro statistics in order to develop distributional indicators.
This article is based on the second work stream — developing robust bridges between micro and macro statistics. It shows how well the data line up for consumption, and its components from HBS and National Accounts. Further steps will include analysis of the household consumption data as measured in the HBS and National Accounts and the experimental production of distributive indicators according to internationally agreed guidelines, including development of the quality framework and data imputations.
Direct access to
The first experimental results for the joint distributions of ICW have been already published on Eurostat website, in the section dedicated to experimental statistics: