Archive:Weekly absences from work
Data extracted in January 2021
Planned article update July 2021
Highlights
To respond to the need for a more thorough analysis of the labour market situation during the recent COVID-19 pandemic, Eurostat developed an experimental indicator “Weekly absences from work”. This indicator focuses on employed persons who are temporarily absent from work in a reference week.
This article presents the main results from this indicator and complements the article Absences from work - quarterly statistics. Both articles are part of the publication Labour market in the light of the COVID-19 pandemic.
Full article
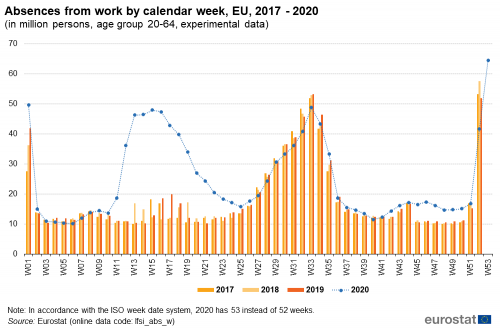
Weekly absences from work spiked in April 2020, and also although a bit milder, in November 2020
In the EU, weekly absences from work typically peak in weeks 1, 33 and 52 (or 53) of the year, which correspond to early January, mid-August and late December (see Figure 1). However, after the first week of March 2020 (week 10), weekly absences sharply increased because of the first confinement measures implemented by governments against the spread of the COVID-19 pandemic. In particular, weekly absences steeply increased from 13.6 to 46.3 million from early to late March 2020 (weeks 10 to 13). This trend continued in the first and second week of April 2020 (weeks 14 and 15), when 46.5 and 48.0 million people were absent from work, respectively. As a comparison, the number of people absent from work in the second week of April is more than 90 % higher than the previous peaks in late December 2019 (week 52, 2019) and early January 2020 (week 1, 2020), when 51.9 and 49.7 million people were absent from work, respectively.
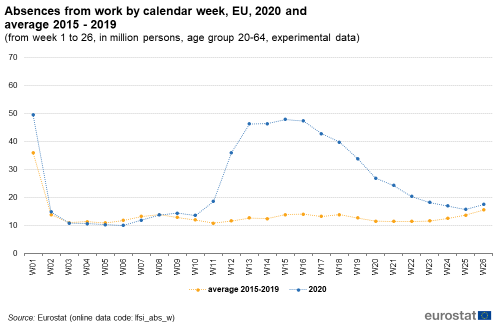
Figures 2a and 2b compare absences from work in the EU in 2020 with the average of the corresponding weeks in the period 2015-2019. The number of weekly absences from January to early March 2020 (weeks 1 to 10) appears to be comparable with previous years (see Figure 2a). Despite the fact that the number of absences for week 1 of 2020 (30th of December 2019 - 5th of January 2020) was much higher than the average over 2015-2019, it was still below the maximum (so far) for this week, which was recorded in 2015 (49.7 million in 2020 versus 54.2 million in 2015).
Source: Eurostat (lfsi_abs_w)
Absences from work increased significantly beginning in the second week of March 2020 (week 11). In this week, the number of people absent from work was 5.0 million more compared with the previous week (week 10, 2020) and with 73 % more compared with the average number of absences for the 11th week during the previous years (average 2015-2019). The increase was even more noticeable in weeks 12 and 13, which correspond to mid and late March 2020, where the number of absences went up by 17.4 and 10.2 million respectively. The increase continued in April 2020, and weekly absences reached 48.0 million in week 15. In the following week (week 16 2020), the number of people absent from work declined, with 0.6 million. Nevertheless, the number of weekly absences from work was exceptionally high (47.4 million) in comparison with the previous years (14.1 million) in that week (week 16), as was the case in the last week of March and the first two weeks of April 2020 (weeks 13-15). In these four weeks (weeks 13-16), the number of absences in 2020 was around three and a half times more than the average over 2015-2019. The gap between 2020 and the previous years was the widest for the first week of April (week 14), when absences from work amounted to 46.5 million in 2020, compared with 12.5 million over the previous years.
Absences from work began to decline in mid-April 2020 (week 16). Their decrease, however, was not as rapid as their increase. On average, weekly absences decreased by 4.2 million per week until mid-May 2020 (week 20), when their number reached 27.0 million. This figure was, nevertheless, still more than double the average for the 20th week of the previous half-decade, which was 11.6 million.
The number of people absent from work continued to fall over the next five weeks (weeks 21-25). This time, there was a more moderate drop of 2.2 million absences per week on average. Absences from work reached 15.8 million in mid-June 2020 (week 25), the lowest level since the March 2020 expansion. However, this figure was 2.1 million higher than the average number of absences for the 25th week from 2015 to 2019, and also 2.1 million higher than in early March 2020 (Week 10).
The number of people absent from work increased again in the last week of the first half of 2020, namely the week spanning the end of June (week 26), this time by 1.8 million in comparison with the previous week, reaching 17.6 million. For comparison, the average number of absences for the same week during the previous years was 15.6 million.
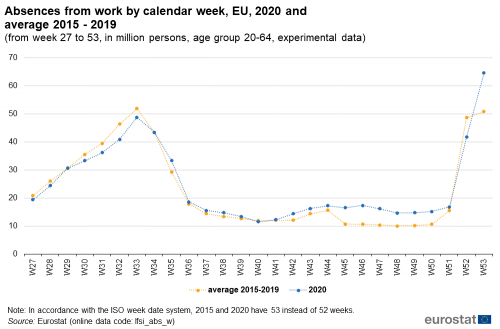
The number of weekly absences continued to rise from the beginning of July to the middle of August 2020 (weeks 27-33), as shown in Figure 2b. Its evolution however followed a similar pattern as in the previous years, although a bit milder: the number of absences during these weeks in 2020 was lower than the average over 2015-2019. Especially, at the beginning of August 2020 (week 32), 40.9 million people were absent from work while on average 46.4 million were in this situation in the corresponding week of 2015-2019.
Source: Eurostat (lfsi_abs_w)
Following its peak in week 33, the number of weekly absences in 2020 began to decline towards the end of September, as it had in previous years. Nonetheless, the 2020 downward path was also milder than in the previous years, resulting in more absences in 2020 than over the period 2015-2019 for each of the weeks 34-39. More tangibly, 33.3 million people were absent from work in the last week of August 2020 (week 35) whereas the average over the previous years for the same week was 29.2 million.
October 2020 began with slightly fewer absences from work than in the past: 11.5 million in week 40 2020, compared with 11.8 on average for the same week over 2015-2019. In the following four weeks, the number of absences gradually increased to reach 17.2 million at the end of the month (week 44). The distance with the number recorded over the previous years widened as well, most notably in the third week of October 2020 (week 42) when absences from work were 20.0 % more with reference to the past.
In November 2020, the number of absences was even more distinctly diverging from the pattern of the previous years, especially during its first three weeks, when the number of absences was more than 50 % higher compared with the average 2015-2019. In detail, there were 16.5, 17.3 and 16.2 million absent from work people in weeks 45-47 in 2020, whereas during the corresponding weeks during the previous years this number was with respectively 5.9, 6.7 and 5.8 million lower. In the last week of November and during the first two weeks of December 2020 (weeks 48-50), the distance with the previous years shortened a bit but still, the number of absences in 2020 was substantially higher than the number recorded over 2015-2019, precisely with 4.7, 4.6 and 4.5 million.
December 2020 continued with two weeks (week 51 and 52) with levels of absences from work closer to the one recorded in the previous years. Even in week 52 2020, absences were less: 41.7 million compared with 48.6 million on average for the week with the same number in 2015-2019.
The year 2020 finished in week 53 (28th December 2020 - 3rd January 2021). Previously available data for a 53rd week could be found only for 2015. The comparison between these two points in time shows substantially more absences in 2020 than in 2015: 64.5 million compared with 50.8 million.
Impact of the COVID-19 crisis on the gender distribution of weekly absences
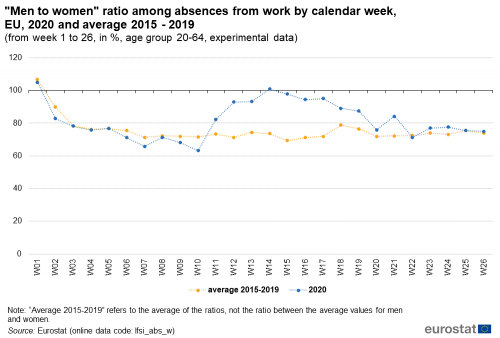
In this section of the article, the focus is on the ratio between men and women absent from work in all the weeks of 2020. Figures 3a and 3b present a comparison of this ratio with its average for the last five years (2015-2019). A ratio of 100 % suggests a gender equilibrium, whereas a ratio above this threshold implies that men were preponderated among people absent from work (a ratio below 100 % corresponds to an over-representation of women among people absent from work).
The "men to women" ratio for the first week of 2020 was 105.1 %, slightly less than the 2015-2019 average for the same week, which was 106.7 % (see Figure 3a). In other words, there were 5.1 % more male than female absences from work in the first week of 2020, while there were on average 6.7 % more men absent from work than women for the same week over the years 2015-2019.
Source: Eurostat (lfsi_abs_w)
All in all, up to early March 2020 (week 10), the "men to women" ratio for 2020 went down, closely following the average for the previous five years. More specifically, it fell from 105.1 % in the first week of 2020 to 82.8 % in the second week of the year. Following that, it gradually declined (with the exception of week 5) and reached its lowest point for 2020 in early March (week 10), when the "men to women" ratio accounted for 63.2 %, implying that men were with more than one third less than women (-36.8 %) among those absent from work in week 10.
From the second week of March 2020 (week 11), alongside the outbreak of the COVID-19 pandemic, the "men to women" ratio started to increase steeply. The development of this ratio in March 2020 was as follows: from 63.2 % in its beginning (week 10) to 93.3 % by its end (week 13). In the first week of April 2020 (week 14), the number of men slightly exceeded those of women among people absent from work. The "men to women" ratio for this week amounted to 100.9 %. Indeed, during this week, marked by one of the greatest peaks of total absences in 2020, the number of men absent from work was 23.3 million, whereas the corresponding number for women was 23.1 million. From the first week of March 2020 to the first week of April 2020 (weeks 10 to 14), male absences rose by 18.1 million, compared with an increase of 14.8 million for women. For reference, the average number of men and women absent from work for week 14 during the previous five years was 5.3 million and 7.2 million respectively, corresponding to an average "men to women" ratio of 73.6 %.
After its peak in early April 2020 (week 14), the "men to women" ratio decreased to levels below 100 % and gradually declined (with some fluctuations) over the weeks up to the end of June 2020 (week 26), when it reached 75.0 %. Nevertheless, for the whole period from week 11 to week 21 2020, the "men to women" ratio was above its average over the previous five years. Most prominently, in April 2020 (weeks 14 to 17), the "men to women" ratio was more than 20 percentage points (p.p.) higher than the average for 2015-2019. The greatest difference can be observed for week 15: the "men to women" ratio for this week in 2020 reached 97.8 % while its average for this week during the previous five years only amounted to 69.4 % (28.4 p.p. difference).
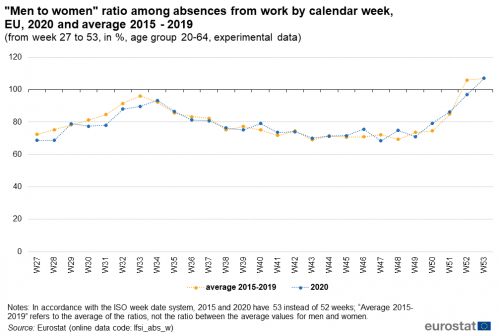
The decline of the “men to women” ratio continued to the second week of July 2020 (week 28), when it reached 68.6 %. However, from mid-July 2020 (week 29), it started to go up again (see Figure 3b). The rise reached its peak in the penultimate week of August 2020 (93.3 % in week 34). For reference, the 2015-2019 average of the “men to women” ratio for the 34th week was 92.3 %.
Source: Eurostat (lfsi_abs_w)
Following its peak in August 2020, the “men to women” ratio took a downward path. The decrease continued throughout the autumn of 2020 and the ratio reached 68.4 % in the penultimate week of November (week 47). Hereafter, the ratio started to increase again and in the final week of 2020 (week 53) reached 106.9 %, i.e. in this week among the population of absent from work people, men were 6.9 % more than women. For a benchmark, in 2015 during the 53rd week, with 107.1 %, the ratio was very similar.
It is also worth noting that the evolution of the “men to women” ratio from July to December 2020 followed the pattern from the previous years. There were some fluctuations though, like for example most of the weeks in July and the first two weeks of August 2020, when the ratio was below its levels from the previous years. The biggest differences considering this period were in the second and last week of July 2020 (weeks 28 and 31), when the ratio was respectively 6.7 p.p. and 6.6 p.p. below its average values over 2015-2019. Furthermore, the increase of the overall absences from work in autumn 2020 was not accompanied by an unusual increase in the “men to women” ratio, as it was the situation previously during the spring.
Disparities among countries of the COVID-19 impact on weekly absences
The objective of this section of the article is to illustrate the situation in regard to weekly absences from work across European countries. Indeed, because the timing and strictness of the COVID-19 containment measures differ between countries, the effects on weekly absences are likely to vary from week to week and country to country.
A separate graph is presented for every country with information available for more than 50 % of the weeks from 2015 to 2020. Each graph contains information about the level of absences from work for every calendar week in 2020, as well as the average of the number of absences recorded for the same sequence of weeks during the period 2015-2019. Every graph is created in both linear and logarithmic scales to better visualize the wide range of values between the lowest and highest. The graphs with their accompanying data can be found ![]() here.
here.
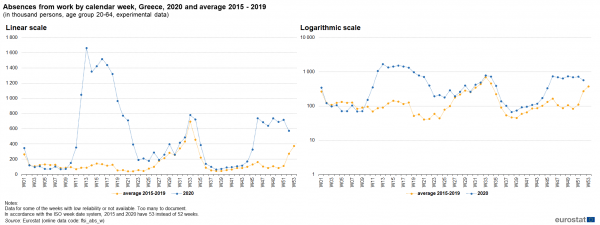
Overall, in 2020, Greece was the EU Member State recording the largest increase in the number of absences from work. In this country, the number of employed people who were absent from work during 2020 was the most persistently higher than the number recorded over the previous years (average 2015-2019). Over eleven weeks from mid-March until the end of May 2020 (weeks 12 to 22), the number of people absent from work in Greece was at least nine times higher than in the corresponding weeks in the previous years (see Figure 4). Moreover, 14 to 19 times more people were absent from work in Greece in the last week of March 2020 (week 13) and during the first three weeks of May 2020 (weeks 19 to 21) than in the same weeks of 2015-2019.
Source: Eurostat (lfsi_abs_w)
In June 2020 (weeks 23 to 26), the number of absences in Greece reduced the distance with its average recorded during the past half-decade. Nevertheless, the values were still far from recovery, as the number of absences in June 2020 was still three times (in weeks 23 and 26), and even five times (in week 24), higher than in the previous years.
During the period from July to October 2020 (weeks 27 to 44), the number of absences in Greece, albeit higher, followed a similar development as in previous years. Nevertheless, some of the weeks during this period stand out with more significantly higher levels, namely week 35 and 37, corresponding to late August and the second week of September 2020, when absences from work were respectively 74.6 % and 88.2 % more than the 2015-2019 average.
During the last two months of 2020, November and December, the number of absences from work in Greece surged, and the weekly development in 2020 split ways again from its average from the previous years. Furthermore, from mid-November to mid-December 2020 (weeks 47 to 51), the number of absences in Greece was six to eight times higher than the average of the number recorded over 2015-2019.
As mentioned already, in 2020, Greece was the EU Member State recording the largest increase in the number of weekly absences from work. However, comparing the different periods of 2020, during the first and bigger surge of weekly absences in spring, Greece was followed by Romania and Cyprus, whereas during the increase in the late autumn, following Greece were Ireland and Slovenia.
Romania and Cyprus recorded during March, April and May at least five times more absences from work in 2020 than the average over 2015-2019 (Romania: from week 13 to week 22, and Cyprus: from week 12 to week 22). Moreover, in Romania, in April and early May (weeks 14-19, 2020) absences from work exceeded 9 to 17 times their values from the past five years. In addition, in Cyprus, the number of weekly absences in late March, early April, mid-April and the first two weeks of May (weeks 12-14, 16, 19 and 20 of 2020) was 9 to 13 times higher than in previous years.
Throughout November up to mid-December 2020 (weeks 45 to 51), the number of weekly absences in Ireland was two to four times, and in Slovenia, two to three times higher than the number in previous years. Moreover, in Ireland, already from the last week of September and during October 2020 (weeks 39 to 44), absences were near twice as many as previous years.
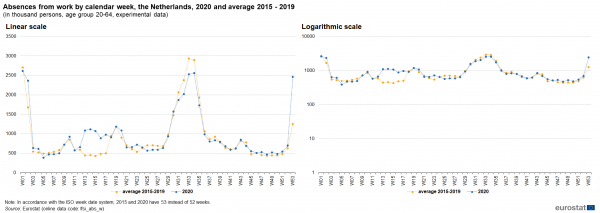
All Member States with available data experienced an increase in the number of weekly absences in comparison with the previous years at some point during 2020. However, in some countries, such as Finland and the Netherlands, the increase was smaller. The example of the Netherlands is shown in Figure 5.
Source: Eurostat (lfsi_abs_w)
In the Netherlands, the number of people absent from work during 2020 increased rather moderately in comparison with the other Member States. Furthermore, following the outbreak of the COVID-19 pandemic in Europe in spring 2020, the number of absences was significantly higher than the number recorded in previous years only for a short period, significantly shorter than in the other Member States. Indeed, this was the case only in the five weeks from the end of March to the week before the last week of April 2020 (weeks 13 to 17), when people absent from work were around twice as many as during the previous years. Following its peak in the first week of April 2020 (week 14), the number of weekly absences in the Netherlands began to decline towards the end of April 2020 (week 18), when it returned close to its 2015-2019 average values and then continued to follow the pattern from the previous years almost until the end of 2020. In many weeks the number in 2020 was even slightly lower than the corresponding 2015-2019 average, like for example during most of the weeks from June to September 2020 (weeks 23 to 39). The final week of 2020 (week 53), distinguished considerably from the previously recorded level, as the number of absences for this week in 2020 was twofold the number observed in 2015, the previous year with available data for a week with this sequential number.
Source data for tables and graphs
Data sources
All figures in this article are derived from the European Union Labour Force Survey (EU-LFS).
Source: The European Union Labour Force Survey (EU-LFS) is the largest European household sample survey providing mostly quarterly and annual results on labour participation of people aged 15 and over as well as on persons outside the labour force. It covers residents in private households. Conscripts in military or community service are not included in the results. The EU-LFS is based on the same target populations and uses the same definitions in all countries, which means that the results are comparable between countries.
European aggregates: EU refers to the sum of EU-27 Member States. If data are unavailable for a country, the calculation of the corresponding aggregates is computed with estimates. Such cases are indicated.
Coverage: Data are not available for Sweden for the whole time series (2015 – Q3 2020), as well as for Germany for 2020 (see below).
Country note: In Germany, from the first quarter of 2020 onwards, the Labour Force Survey (LFS) is part of a new system of integrated household surveys. Unfortunately, technical issues and the COVID-19 crisis has had a large impact on data collection processes, resulting in low response rates and a biased sample. For this reason, additional data from other integrated household surveys has been used in addition to the LFS subsample, to estimate a restricted set of indicators for the first three quarters of 2020, for the production of LFS Main Indicators. These estimates have been used for the publication of German results, but also in the calculation of EU and EA aggregates. By contrast, EU and EA aggregates published in the Detailed quarterly results (showing more and different breakdowns than the LFS Main Indicators) have been computed using only available data from the LFS subsample. As a consequence, small differences in the EU and EA aggregates in tables from both collections may be observed. For more information, see here.
Definitions: The notion of temporary absence from work refers to situations in which a period of work is interrupted by a period of absence. This implies that persons are generally to be considered as having been temporarily absent from work and therefore employed if they had already worked at their current activity and were expected to return to their work after the period of absence. Persons without work who had made arrangements to take up paid employment or to engage in some self-employment activity at a date subsequent to the reference period, but who had not yet started work, are not to be considered as temporarily absent from work. For more information on absences from work, please consult pages 22 to 28 from the EU Labour Force Survey Explanatory Notes
Also, five different articles on detailed technical and methodological information are available from the overview page of the online publication EU Labour Force Survey.
Context
The COVID-19 pandemic hit Europe in January and February 2020, with the first cases confirmed in Spain, France and Italy. COVID-19 infections have now been diagnosed in all European Union (EU) Member States. To fight the pandemic, EU Member States have taken a wide variety of measures. From the second week of March, most countries closed retail shops apart from supermarkets, pharmacies and banks. Bars, restaurants and hotels have also been closed. In Italy and Spain, non-essential production was stopped and several countries imposed regional or even national lock-down measures which further stifled the economic activities in many areas. In addition, schools were closed, public events were cancelled and private gatherings (with numbers of persons varying from 2 to 50) were banned in most Member States.
The large majority of the prevention measures were taken during mid-March 2020 and most of the prevention measures and restrictions were kept for the whole of April and May 2020. The first quarter 2020 is consequently the first quarter in which the labour market across the EU has been affected by COVID-19 measures taken by the Member States.
Employment and unemployment as defined by the ILO concept are, in this particular situation, not sufficient to describe the developments taking place in the labour market. In this first phase of the crisis, active measures to contain employment losses led to absences from work rather than dismissals, and individuals could not search for work or were not available due to the containment measures, thus not counting as unemployed.
Direct access to
<maintables>
Main tables
<maintables>
