Archive:Energy from renewable sources
- Data from July 2013. Most recent data: Further Eurostat information, Main tables and Database. Planned article update: August 2014.
Spurred on by the adoption of the 2009 Renewable Energy Directive and the legally binding renewable energy targets, renewable energy in the EU grew strongly in recent years. The energy statistics and analysis of renewable energy sources shows that while the EU as a whole is on its trajectory towards the 2020 targets, some Member States need to undertake additional efforts to meet their national targets.
Data presented in this article are calculated according to accounting rules prescribed in Directive 2009/28/EC on the promotion of the use of energy from renewable sources.


Main statistical findings
<description and/or analysis of most important statistical data, illustrated by tables and/or figures and/or maps>
Text with Footnote [1]
Primary production of energy from renewable sources
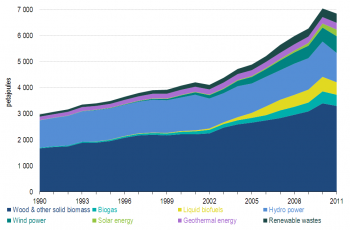
Primary production of renewable energies is on its long term increasing trend. Between 1990 and 2011 the total primary production of energy from renewable sources increased by 130% (average annual growth rate over this period is 4.1%). In 2011 the primary production of renewables decreased (-2.8%) mainly due annual variation from hydro power production. This is only the second decrease recorded since 1990 – the first decrease was recorder in year 2002 (-2.4%) and this was also as a consequence of hydro variation. Directive 2009/28/EC requires that for the accounting purposes the production from hydro and wind is normalised for annual variations. Primary production of renewable energies is shown in Figure 1 (in this figure electricity production is not normalised).
Electricity generation from renewable sources
In 2011 the actual gross electricity generation from renewables decreased by 2% when compared to 2010. Hydro power plants account for by far the largest share of electricity generation from renewable energy sources. While between 1990 and 2011 the electricity generation from hydro slightly increased, its share of total renewable electricity shrank from 94 % in 1990 to 46% in 2011 (55 % in 2010). This is due to the more rapid expansion of electricity generation from other renewable sources. Wind generation more than doubled over the period 2005-2011. In fact, since 2002 wind power has been the second largest contributor to renewable electricity, replacing solid biomass that had been in second position since 1990. Solar-based electricity generation increased very rapidly in recent year and in 2011 accounted for 7% of all renewable electricity. Combustible renewables are also used in conventional thermal generation power plants. Since 1990, when the contribution of solid renewables was 4 % their shares grew to 13 %. Electricity generation from liquid biofuels and biogas was negligible in 1990 and reached 6 % in 2011.
Installed capacity for renewable electricity generation
include elaboration on capacity of renewables in the context of all electricity generation from all fuels F3
Production of liquid biofuels in the EU
F4
Imports & Exports of liquid biofuels
Imports and exports of renewable energy products are very difficult to analyse and it is even more difficult to provide figures corresponding to import dependency that would be comparable with fossil fuels (coal, crude oil, natural gas). The major obstacle for detailed import/export analysis is that primary feedstock for solid, liquid and gaseous biofuels often compete for other non-energy uses. For example wood can be also used as material for furniture production as well as at the construction sites as building material. Energy statistics is tracking only quantities of renewable products for energy purposes, quantities of renewable products for non-energy purposes are not part of energy balances. Another complication however comes from the missing data on the actual transformation sector feed stock input (for example the raw materials input into bio-refinery for production of biofuels). Therefore in the energy balances solid, liquid and gaseous biofuels produced in the EU appear under the "Primary production" heading contrary to production of fossil based fuels which appear under "Transformation output" heading (for example the "Primary production" of motor gasoline or automotive diesel is zero in energy balances). However we can focus in the analysis on the trade of liquid biofuels, concretely liquid biofuels that can be blended with gasoline/diesel or used as substitute for gasoline/diesel (for example ethanol for the E85 fuel specification to be used in so called flex fuel vehicle). Trade volumes of liquid biofuels (blended part within mineral fuel plus pure biofuels) shipped between EU Member States as well as in the international context are increasing. In 2011, EU-28 net imports of liquid biofuels accounted for 26% of their gross inland consumption. Net imports of biodiesel were at 24% and biogasoline at 41% of their consumption (accounts for the blended part within mineral fuel plus all amounts of pure biofuels). Compared to situation 2 years ago, net imports of biogasolines and biodiesels have doubled. This trend indicates that issue of import dependency for liquid biofuels might be of as valid concern as import dependency for fossil fuels.
including elaboration on normalized vs. not-normalized electricity
The energy data collection is harmonized on international level in the joint OECD/IEA-Eurostat-UNECE questionnaires. This allows to certain extend comparison of the share of energy from renewable sources between EU Member States and OECD/IEA countries. However, as not all information is available, certain additional assumptions are made in this comparison: all biofuels and bioliquids are counted towards the renewable share and are counted without multipliers, heat pumps are not counted, all pumped hydro is assumed to be pure pumped hydro and mixed hydro is assumed to be zero, electricity in road transport is counted without multiplier. This allows harmonized comparison of EU-28 aggregate with other OECD countries; however in this comparison EU-28 values is not equivalent to the values presented earlier in this article.
Data sources and availability
<description of data sources, survey and data availability (completeness, recency) and limitations>
Context
Directive 2009/28/EC on the promotion of the use of energy from renewable sources established a European framework for the promotion of renewable energy, setting mandatory national renewable energy targets for achieving a 20% share of renewable energy in the final energy consumption and a 10% share of energy from renewable sources in transport by 2020. These goals are headline targets of the European 2020 strategy for growth, since they contribute to Europe's industrial innovation and technological leadership as well as reducing emissions, improving the security of our energy supply and reducing our energy import dependence.
Further Eurostat information
Publications
Main tables
- Title(s) of second level folder (if any)
- Title(s) of third level folder (if any)
Database
- Title(s) of second level folder (if any)
- Title(s) of third level folder (if any)
Dedicated section
Methodology / Metadata
<link to ESMS file, methodological publications, survey manuals, etc.>
- Name of the destination ESMS metadata file (ESMS metadata file - ESMS code, e.g. bop_fats_esms)
- Title of the publication
Source data for tables, figures and maps (MS Excel)
Other information
- Regulation (EC) No 1099/2008 on energy statistics
- Directive 2009/28/EC on the promotion of the use of energy from renewable sources
- Renewable Energy: a major player in the European energy market
- Renewable energy progress report
External links
- European Commission - Energy - Renewable energy
- International Energy Agency - Renewables
- EurObserv'ER
- Concerted Action on the Renewable Energy Sources Directive
See also
Notes
- ↑ Text of the footnote.

