Archive:Urban Europe — statistics on cities, towns and suburbs — the urban paradox
Data extracted in February–April 2016
This Statistics Explained article has been archived on 3 December 2020.
Highlights
Although a higher proportion of people living in EU cities were in employment in 2014, the highest levels of job satisfaction were found among people living in towns and suburbs or rural areas.
Source: Office for National Statistics (London Datastore, available at: http://data.london.gov.uk/publisher/ons)
This chapter is part of an online publication that is based on Eurostat’s flagship publication Urban Europe — statistics on cities, towns and suburbs (which also exists as a PDF).
Definitions of territorial units
The various territorial units that are presented within Urban Europe — statistics on cities, towns and suburbs are described in more detail within the introduction. Readers are encouraged to read this carefully in order to help their understanding and interpretation of the data presented in the remainder of the publication.
Full article
The urban paradox
Urban areas are often characterised by their high concentrations of population, economic activity, employment and wealth with the daily flow of commuters into many of Europe’s largest cities suggesting that opportunities abound in these hubs of innovation, distribution and consumption, many of which act as focal points within their national economies and in some cases within Europe or even globally.
Although cities are motors for economic growth, they are also confronted by a wide range of problems, like crime, traffic congestion, pollution and various social inequalities. Furthermore, within many cities it is possible to find people who enjoy a comfortable lifestyle living in close proximity to others who may face considerable challenges, for example, in relation to affordable/adequate housing or poverty — herein lies the ‘urban paradox’.
Urban–rural paradoxes
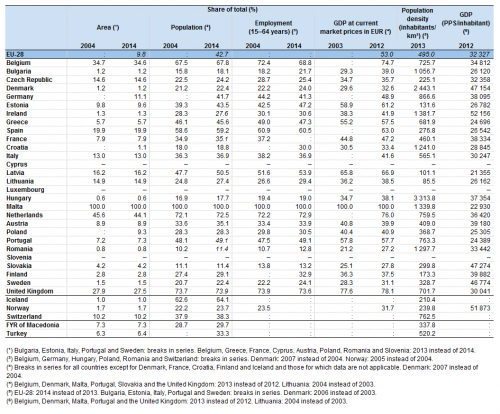
An analysis based on the urban–rural typology shows that the EU-28’s economic activity is concentrated in predominantly urban regions, as these regions generated more than half (53.0 %) of all gross domestic product (GDP) in 2012 (see Table 1). A per capita measure of GDP in PPS terms can be used as an indicator of living standards: this ratio was considerably higher in predominantly urban regions (PPS 32 327 per inhabitant) than in either intermediate regions (PPS 23 664 per inhabitant) or predominantly rural regions (PPS 19 230 per inhabitant). As such, predominantly urban regions may be identified as economic hubs that (in aggregate terms) provide relatively high levels of wealth creation.
Policy initiatives for sustainable urban developments
Given the growing number of people who are living in cities and the fact that cities are often the source of and can potentially provide the solution to many of today’s economic, social and environmental challenges, these urban territories are increasingly under the spotlight of policymakers.
The revised 2014–20 cohesion policy framework introduced a set of 11 thematic objectives to support growth. European structural and investment funds were re-assessed, and additional recognition was given to the role that urban territories can play in economic development, as well as the linkages that exist between urban and rural regions. Some 10 billion EUR of European Regional Development Fund (ERDF) resources were foreseen for initiatives linked to sustainable urban development, covering areas such as urban mobility, the regeneration of deprived communities, improving research and innovation capacity, or tackling climate change.
The European Union’s (EU’s) urban agenda involves cities in the design of policies, so they may play a key role in translating national and EU policy objectives into specific actions. Signed during the Dutch presidency in 2016, the Pact of Amsterdam established the operational framework for the EU’s urban agenda and it also set-up four thematic partnership projects relating to: air quality; migrants and refugees; housing; urban poverty.
Predominantly urban regions accounted for 44.1 % of the total area of the Netherlands
Outside of Malta — considered as a single region within the urban–rural typology — the most concentrated urban regions of the EU were located in the Netherlands (where 44.1 % of the total area was classified as predominantly urban in 2014), Belgium (34.6 %) and the United Kingdom (27.5 %). By contrast, predominantly rural regions extended over the vast majority of the Nordic Member States, Ireland and several eastern EU Member States — notably, Hungary, Romania, Croatia and Bulgaria — accounting for at least 97.0 % of their total surface area. As such, the area occupied by predominantly urban regions across the EU was generally quite small, highlighting the concentration of economic activity in these regions.
In some ways the relative importance of predominantly urban regions was greater in the most sparsely populated EU Member States
The considerable differences that exist in the territorial distribution of populations across the EU Member States clearly impact on a range of indicators. For example, an analysis for GDP reveals that there were nine EU Member States where more than 50.0 % of economic activity was concentrated in predominantly urban regions in 2012/13. However, there was a paradox insofar as the relative influence of predominantly urban regions was in some ways greater in some of the most thinly populated regions of the EU. For example, while predominantly urban regions accounted for 1.5 % or less of the total area of Bulgaria, Denmark, Ireland, Croatia, Hungary, Romania or Sweden, their share of national GDP was at least 20 times as high. This could be contrasted with the situation in the most densely populated EU Member States, such as the Netherlands, Belgium or the United Kingdom, where the share of predominantly urban regions in national GDP was nevertheless between 1.7 and 2.8 times as high as their share of the total area.
In several western and southern EU Member States, employment rates were often lower in predominantly urban regions
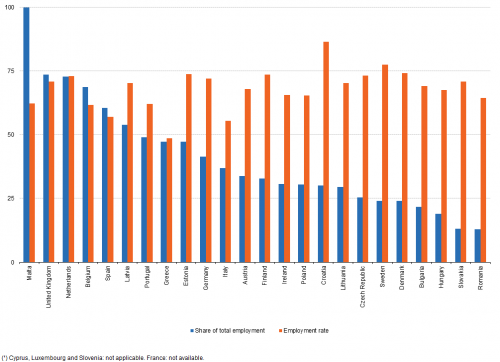
In 2014, almost three quarters of people employed in the densely populated Netherlands and United Kingdom were living in a predominantly urban region. Aside from the special case of Malta (100.0 %), the only other EU Member States to report that more than half of their workforce was living in predominantly urban regions were Belgium (68.8 %), Spain (60.5 %) and Latvia (53.9 %) — see Figure 1.
Historically, there have been widespread population movements from rural to urban regions, with an increasing number of people living in urban areas; this development is often driven by the search for work. In 2014, the share of the total population residing in predominantly urban regions was higher than the employment share of predominantly urban regions in Austria, the United Kingdom, Germany, Portugal, Italy and the Netherlands. Given that urban regions are often characterised as having relatively young populations who may be attracted by a wide range of employment opportunities, it is perhaps surprising to find that a lower share of the population was in work in these six EU Member States, although this may reflect the diversity of urban regions, with some being dynamic, prospering regions and others in decline.
A closer analysis reveals that employment rates in 2014 were lower for predominantly urban regions (compared with predominantly rural regions) in Austria, Portugal, Germany, Greece, Belgium, the United Kingdom and the Netherlands. As such, in several western and southern EU Member States predominantly urban regions appeared to generate considerable economic wealth and provided large numbers of associated job opportunities, yet they were also characterised by relatively high levels of unemployment. This apparent paradox may be explained, at least in part, by some jobs in urban regions being taken by people who live in intermediate or predominantly rural regions — in other words, commuters. Indeed, it is relatively common in western Europe for large numbers of people to commute to work, sometimes this is a lifestyle choice whereby people choose to move out of larger cities in search of a better quality of life in more suburban or rural locations (for more information on commuting, please refer to Chapter 9).
In most of the eastern and the Baltic Member States which have relatively recently transformed themselves into market-based economies, the pull-effects of predominantly urban regions and the employment opportunities that they (are perceived to) offer were such that urban regions accounted for higher shares of total employment and higher employment rates than predominantly rural regions; this was particularly true in Croatia, Bulgaria, the Baltic Member States, Hungary and Poland, as well as in Finland and Ireland.
Source: Eurostat (urt_d3area), (urt_pjanaggr3), (urt_lfe3emp), (urt_10r_3gdp) and (urt_d3dens)
(% of total employment; employment rate, %)
Source: Eurostat (urt_lfe3emprt)
Although economic activity and wealth are often concentrated in urban regions, it is important to note that these figures are averages and, for example, they do not reflect the distribution of income between different groups of people living in each type of region. Indeed, there are a range of apparent paradoxes/contradictions, as while predominantly urban regions:
- generally recorded higher levels of GDP per inhabitant than predominantly rural regions, this was often due to performance of the capital city alone (see Chapter 4 for more details);
- offered a wide range of employment opportunities that attracted large numbers of people looking for work, some urban territories were also characterised by high levels of unemployment or large numbers of jobless households (see Chapter 9 and Chapter 12 for more details);
- were usually resource-efficient in relation to their environmental impact (a low amount of space per person and high-density buildings), people who lived in urban regions were often exposed to some of the highest levels of pollution (see Chapter 6 for more details).
Paradoxes by degree of urbanisation
Some 41.6 % of the EU-28 population lived in a city in 2014, with a further 31.0 % living in towns and suburbs; as such, almost three quarters of the EU-28 population was living in an urban area (as defined by the degree of urbanisation), while 27.5 % lived in rural areas.
There were four EU Member States with particularly high concentrations of people living in cities in 2014: their share was more than half of the total number of inhabitants in Malta (89.5 %), the United Kingdom (57.2 %), Cyprus (51.2 %) and Spain (51.1 %). By contrast, people living in cities accounted for less than one in five of the total population in Slovenia and Luxembourg — the lowest shares in the EU.
Employment rates tended to be higher, but job satisfaction was no greater in cities …
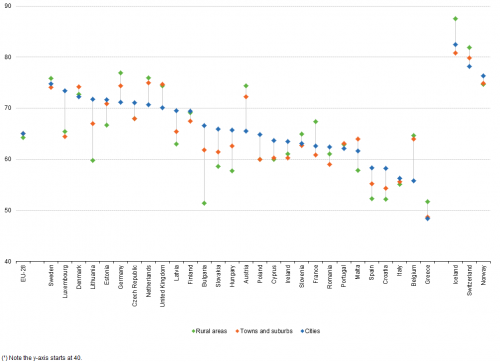
In 2014, the EU-28 employment rate was just less than two thirds (65.0 %) for people aged 15–64 living in cities and in towns and suburbs, while the share of people living in rural areas who were in employment was slightly lower, at 64.3 %. A closer analysis reveals that, by degree or urbanisation, people living in cities recorded the highest employment rates in 16 of the EU Member States, including all of the eastern (except for Slovenia) and Baltic Member States. There were eight Member States where the highest employment rate was recorded for people living in rural areas (five of which were located in western Europe), leaving four others where the highest employment rates were recorded among people living in towns and suburbs — see Figure 2.
(%)
Source: Eurostat (lfst_r_ergau)
Although a higher proportion of people living in cities were in employment, this did not necessarily translate into job satisfaction. Indeed, it was more common to find the highest levels of job satisfaction (on a scale of 0–10) among people living in towns and suburbs or rural areas (see Figure 3). This may reflect, at least in part, structural differences in the type of occupations available in each of these locations; higher levels of job satisfaction for those living in rural areas may also be synonymous with a more relaxed pace of life. By contrast, in many of the western and Nordic EU Member States, city-dwellers recorded the lowest levels of job satisfaction, perhaps reflecting the pressures of work, time lost travelling to work, or the monotony of office work in big cities. There was a somewhat different pattern in several of the eastern Member States, where city-dwellers were more inclined to be satisfied with their job, perhaps as a result of higher earnings or a wider choice of occupations relative to the situation in rural areas.
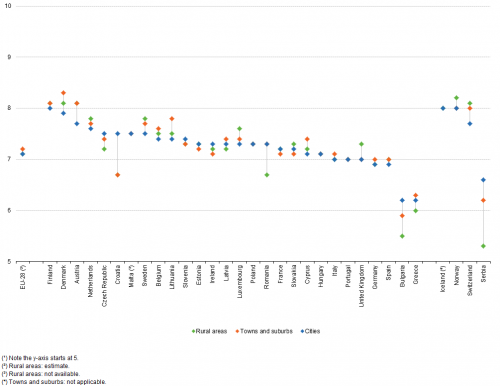
(rating, 0–10)
Source: Eurostat (ilc_pw02)
A higher share of people living in cities reported having an income that was 150 % or more of the national median …
In 2014, almost one quarter (24.9 %) of the EU-28 population living in cities had an income that was at least 150 % of the national median level (see Figure 4), this may in part reflect the higher cost of living (especially for housing) in some urban areas. A comparison by degree of urbanisation reveals that inequalities (at the top end) of the income distribution were most pronounced in cities, as a lower proportion of the population living in towns and suburbs (20.8 %) and in rural areas (14.5 %) had an income that was at least 150 % of the national median income.
While a larger proportion of city-dwellers were fortunate enough to have relatively high levels of income, this also meant that there were considerable numbers of people living in cities who faced significant challenges to make ends meet (with considerably lower incomes); see Chapter 12 for more details. Such income disparities may, at least in part, explain the lower levels of job satisfaction in cities, even if, at first sight, this may appear contradictory given that a higher proportion of well-paid people living in cities.
In Belgium, Denmark, Germany and the United Kingdom a higher proportion of people living in towns and suburbs (compared with cities) declared that they had an income that was at least 150 % of the national median; this was also the case for those living in rural areas in the United Kingdom. These figures may be linked to commuting patterns, insofar as each of these relatively densely populated EU Member States had high shares of people commuting to work, and those with relatively high incomes were more likely to be able to choose to relocate away from the congestion and deprivation evident in some (inner) cities.
Income disparities, by degree of urbanisation, were widest in some of the eastern and Baltic Member States. For example, 42.4 % of the population living in the cities of Romania had an income that was at least 150 % of the national median (compared with 9.0 % for people living in rural areas). With such a wide difference, it is perhaps unsurprising to find that greater levels of job satisfaction existed among those living in cities in most of the eastern and Baltic Member States, in contrast to those living in rural areas which were largely characterised by limited job opportunities (often restricted to manual labour in agriculture).
… but a greater share of people living in cities were unemployed
While cities provide a considerable range and number of employment opportunities, these jobs are not always taken by people who live in cities. Indeed, as noted above, it is relatively common for people to move out of inner city areas to suburban and rural locations once they have settled into a career and start raising a family, even if they continue to work in a city.
In 2014, the EU-28 unemployment rate was 10.9 % for people living in cities, compared with 9.8 % for those living in towns and suburbs or in rural areas (see Figure 5); this pattern was repeated in almost half (13) of the EU Member States. In Belgium, Austria, Greece, France, Portugal and the United Kingdom, the unemployment rate for people living in cities was at least 3.0 percentage points higher than that recorded for people living in rural areas, confirming that some of the widest disparities, by degree of urbanisation, were visible in western Europe. By contrast, unemployment rates in most of the eastern and Baltic Member States tended to be higher in rural areas; this was particularly the case in Slovakia, Lithuania and Bulgaria.
Again it is important to note that these figures are averages and they may mask considerable differences between cities within the same EU Member State. For example, while unemployment rates in the northern French cities of Calais, Saint-Quentin and Lens - Liévin were within the range of 21–23 % in 2012, much lower rates — less than 8 % — were recorded closer to Paris in the cities of Versailles, Sénart en Essonne or the Communauté d’agglomération du Plateau de Saclay. Such diversity between cities in the same Member State may be explained — at least to some degree — by the considerable differences that exist between local urban economies, with some characterised as dynamic, prosperous areas, while others may be in decline (often former industrial heartlands that have failed to attract new investment). These disparities in unemployment rates are rarely isolated and are often found alongside other forms of social, cultural, political and environmental inequalities, thereby reinforcing patterns of deprivation and social exclusion — see Chapter 12 for more details.
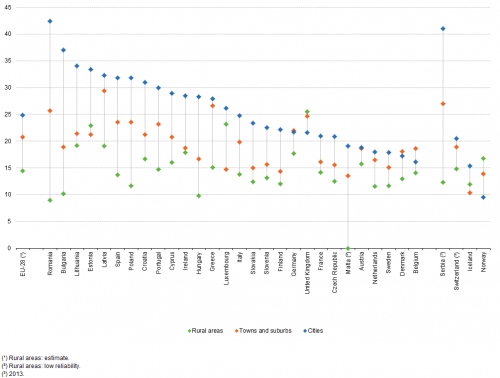
(%)
Source: Eurostat (ilc_di23)
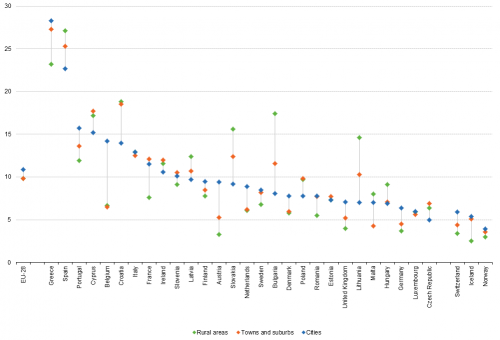
(%)
Source: Eurostat (lfst_r_urgau)
Although people living in cities generally paid more for their housing they got less space for their money
A lack of space for urban developments, with cramped living conditions and poor quality housing has resulted in some inner city areas becoming relatively deprived, which may in turn have an impact on increasing the likelihood of crime, poverty and/or social exclusion. As such, housing is a pressing issue for many Europeans and this is particularly true among those living in cities, where the gap between supply and demand is often most noticeable — a lack of housing may result in rising property prices, both for the rental market and properties that are for sale.
The housing cost burden is defined as the share of total housing costs in disposable household income (both net of any housing allowances). Its median value across the EU-28 in 2014, analysed by degree of urbanisation, ranged from 17.9 % in cities down to 15.8 % in rural areas (see Figure 6). There were only five EU Member States where the median housing cost burden was higher in rural areas than in cities (Bulgaria, Slovakia, Croatia, Romania and Ireland), while there was no difference for this ratio between cities and rural areas in Hungary. However, the median housing cost burden was considerably higher in cities (than in rural areas) in Denmark, Germany, Belgium, Luxembourg and Austria. As such, people living in cities spent, on average, a higher proportion of their income on housing. Perhaps unsurprisingly, although they paid more for their housing, in return they had to live in properties that had, on average, less floor space. In 2012, the average size of a dwelling in rural areas of the EU-28 was 104 m², which was 5 m² larger than in towns and suburbs, and 15 m² larger than in cities.

(%)
Source: Eurostat (ilc_lvho08b)
Dwellings in cities were, on average, smaller than those in rural areas in each of the EU Member States for which data are available. Aside from Ireland, the average size of dwellings in cities was also consistently smaller than those located in towns and suburbs. The difference in the average size of dwellings between those found in cities and rural areas was most marked in Luxembourg, Poland, Germany and Austria, where dwellings in cities were, on average, 60–70 % of the average size of dwellings in rural dwellings. There was, on the other hand, little difference in the average size of dwellings between the cities and rural areas of Italy, Romania, Ireland, Cyprus and Bulgaria, with dwellings in cities having at least 90 % of the average area of dwellings in rural areas (see Figure 7).
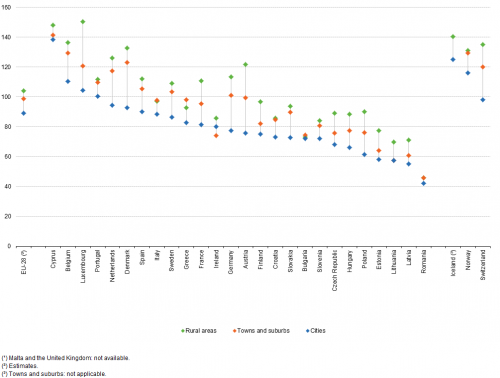
(m²)
Source: Eurostat (ilc_hcmh02)
While cities have a highly educated population, they were also characterised by problems related to crime, violence or vandalism
Figure 8 shows that in 2014 more than one third (37.4 %) of the EU-28 population aged 25–64 and living in cities had a tertiary level of educational attainment (as defined by ISCED 2011 levels 5–8); this was considerably higher than the corresponding shares recorded among those living in towns and suburbs (26.2 %) or rural areas (20.7 %). The proportion of people aged 25–64 with a tertiary level of educational attainment was higher among those living in cities, compared with those living in rural areas, in each of the EU Member States, except for the United Kingdom (where the difference was less than a single percentage point in favour of those living in rural areas). The biggest differences in the proportion of people with a tertiary level of educational attainment between those living in cities and rural areas were recorded in Bulgaria, Luxembourg and Lithuania.

(%)
Source: Eurostat (edat_lfs_9913)
While the concentration of economic activity in cities may contribute towards attracting a highly-educated workforce in search of diverse work opportunities, the gathering together of large numbers of people also leads to a number of negative externalities, including crime. In 2014, the proportion of people in the EU-28 who were living in an area with problems related to crime, violence or vandalism was considerably higher among those living in cities (19.9 %) than it was for the inhabitants of towns and suburbs (11.8 %) or rural areas (7.3 %). City-dwellers in the EU-28 were, on average, 2.7 times as likely as people living in rural areas to be living in an area with problems related to crime, violence or vandalism (see Figure 9).
The share of people living in cities with problems related to crime, violence or vandalism peaked at close to one third (33.4 %) in Bulgaria and around one quarter in Belgium (26.9 %), Austria (24.6 %), Greece (24.1 %) and the Netherlands (24.0 %). The likelihood that city-dwellers were exposed to problems related to crime, violence or vandalism was 3.6 times as high as for those living in rural areas in Austria, rising to 4.2 times as high in Germany, 5.0 times as high in Poland and 6.7 times as high in Croatia.

(%)
Source: Eurostat (ilc_mddw06)
Paradoxes at the city level
The analysis presented in this section is sourced from a perception survey on the quality of life in 79 European cities; note that the statistics presented for Athina (Greece), Paris (France), Lisboa (Portugal), London, Manchester and the Tyneside conurbation (all United Kingdom) refer to the concept of the greater city (which stretches beyond administrative city boundaries), while the information presented for the remainder of the cities is restricted to their city centres.
People living in cities with dynamic labour markets often faced great difficulties in finding adequate housing at a reasonable price
Figure 10 covers two areas already discussed above, namely, it contrasts the relationship between the ease with which respondents thought they could find a job and the ease with which they thought they could find good housing at a reasonable price. For example, while a majority (61 %) of respondents from the Greek capital (Athina) agreed they could find good housing at a reasonable price in 2015, only 10 % agreed that it was easy to find a job. Conversely, while a majority (62 %) of respondents from the German city of München thought it was easy to find a job, only 3 % agreed they could find good housing at a reasonable price. As such, there appears to be some evidence of a trade-off, insofar as people living in cities with the most dynamic labour markets appeared to face difficulties in locating adequate housing at a reasonable price, whereas in those cities where housing was relatively easy to find, the local labour market was often depressed. Nevertheless, this was not a situation observed in all cities and there are examples where only a small proportion of respondents regarded it as easy to find either a job or good housing at a reasonable price (such as Roma in Italy) and others where both proportions were high (such as Cluj-Napoca in Romania or Aalborg in Denmark).

(%)
Source: Eurostat (urb_percep)
Externalities associated with living in cities
While cities are often upheld as examples of modernity and human progress, some are also characterised by a range of detrimental issues, largely concentrated on economic, social and environmental ills. As already indicated above, cities are more prone to crime, violence or vandalism than rural areas. Indeed, most city-dwellers are aware of particular areas in their city which are believed to have higher degrees of lawlessness or insecurity.
Figure 11 presents data from 2015 relating to the perceived safety of those living in cities, a subjective measure that has the potential to undermine an individual’s quality of life. It shows that at least 19 out of every 20 respondents from Aalborg and København (Denmark), Groningen (the Netherlands), München (Germany), Oviedo (Spain) and Zürich (Switzerland) declared that they felt safe in their city. At the other end of the range, a majority of the respondents from Marseille (France), Roma (Italy), Liège (Belgium), Sofia (Bulgaria) and Athina (Greece) disagreed and said that they did not feel safe in their city; this was also the case in Istanbul (Turkey).

(%)
Source: Eurostat (urb_percep)
While cities are often cited as being environmentally efficient ways of organising resources (a low amount of space per person and high-density buildings), they are also frequently characterised by high levels of congestion and/or pollution, or a lack of green spaces. Some of the most notable urban transport problems include: traffic congestion and parking difficulties, long commuting times, the inadequacy of public transport systems, pollution and noise. On the other hand, people who live in cities are more likely to walk, cycle or take public transport to work each day.
Figure 12 shows levels of satisfaction in relation to public transport services and air quality. In the Italian cities of Palermo, Roma and Napoli, less than 40 % of respondents were satisfied with their public transport services and a similar share (less than 40 %) were satisfied with the quality of the air in their city. At the other end of the range, in excess of 90 % of respondents living in the Austrian and Finnish capitals of Wien and Helsinki reported that they were satisfied with public transport services, while in excess of 85 % of respondents in these two cities were satisfied with the quality of the air.

(%)
Source: Eurostat (urb_percep)
Paradoxes at the subcity level
All cities are characterised, to some degree, by differences between affluent and less affluent neighbourhoods. Indeed, there can be considerable disparities between different parts of the same city (intra-urban differences) and these are made all the more apparent given their close proximity. This final section looks at urban paradoxes from the perspective of the subcity; it focuses on the EU’s largest city, London (the United Kingdom).
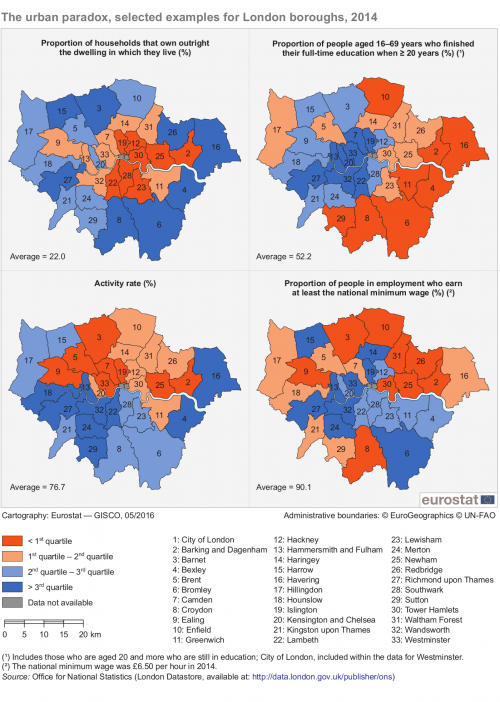
In London, a group of relatively wealthy boroughs stretch to the west of the centre, from Kensington and Chelsea, through Hammersmith and Fulham, into Richmond upon Thames, while some of the poorest areas of London are found to the east, from Tower Hamlets, through Newham and into Barking and Dagenham. That said, even at this more detailed subcity level, the gentrification (displacement of lower-income families as a result of rising property prices, with an influx of artistic types, fashionable restaurants and shopping) of boroughs such as Camden, Islington, Hackney or Southwark has led to considerable changes in their demographic and social make-up, as young, upwardly mobile professionals have moved into regenerated housing stock.
Those living in the suburbs of London were more likely to own their dwelling …
Table 2 presents a range of indicators for all 32 London boroughs, providing evidence of the diversity that exists in the United Kingdom’s capital city. For example, male life expectancy at birth ranged from a low of 77.6 years in Barking and Dagenham to a high of 83.3 years in Kensington and Chelsea, while the corresponding extremes for female life expectancy were a low of 82.1 years (again) in Barking and Dagenham and a high of 86.7 years in Camden.
In 2014, far fewer people living in London (22.0 %) were likely to own outright their own home than the average recorded across the whole of the United Kingdom (32.3 %). There were, however, six boroughs where home ownership rates were above the national average; these were generally located in Outer London, aside from the rather distinctive case of the City of London (where very few people actually live). As can be seen in the first example presented as part of Map 1, people who had purchased their own home outright (rather than renting or having a mortgage) tended to live in the suburbs. On the other hand, less than 1 in 10 households owned outright the dwelling in which they lived in eastern boroughs of Tower Hamlets or Newham, both of which have high shares of foreign-born residents.
… while people living in Inner London were more likely to remain in full-time education after reaching the age of 20
In 2014, the share of the London population aged 16–69 that had completed their continuous full-time education before the age of 20 was considerably lower, at 47.0 %, than the national average for the United Kingdom as a whole (66.2 %). Among other factors, these figures could reflect a relatively high number of opportunities in the capital city for tertiary education, as well as the wide range of graduate job opportunities (some of which are highly concentrated in the capital, for example, jobs in some parts of the financial services sector).
The share of people aged 16–69 who finished their full-time education after reaching the age of 20 was at least two thirds in the boroughs of Wandsworth, Hammersmith and Fulham, Camden, Kensington and Chelsea, and Westminster, where it peaked at 71.7 %. By contrast, the share was below the national average for the United Kingdom in the boroughs of Bexley and Havering. The second example presented as part of Map 1 shows a clear division between Inner and Outer London, with higher levels of educational attainment for the former; this was also the case among those living in the western boroughs of London.
Although London may act as a magnet for young graduates keen to get a first step on the career ladder, the overall activity rate for those working in London (76.7 %) was slightly less than the national average for the United Kingdom (77.2 %). In 2014, some of the highest activity rates in London were located to the south of the river Thames, peaking at 85.4 % in Lambeth, while most of the boroughs to the north of the river tended to report lower activity rates; see the third example presented as part of Map 1.
One measure that may be used to analyse the precarious nature of employment is the proportion of people who receive at least the national minimum wage (GBP 6.50 per hour in 2014). Across the whole of the United Kingdom this share stood at 85.4 %, while it was higher in London, at 90.1 %, indicating that just less than one tenth of people in London who were in work received less than the minimum wage; note that it is legally possible to receive less than the minimum wage, for example, the following list of people may be excluded — apprentices, the self-employed, volunteers and voluntary workers, those on government employment schemes, people under the age of 16). The relatively low share of people in work and receiving less than the minimum wage in London reflects, at least to some extent, that the cost of living in London was considerably higher than in many other parts of the United Kingdom, pushing up wages. Here again there were wide ranging differences between London boroughs, as more than 19 out of 20 of people in Wandsworth, Richmond upon Thames and Islington who were employed earned at least the minimum wage, while considerably lower shares were recorded in Enfield, Redbridge and Barnet, falling to as low as 78.9 % in Newham. The proportion of people who earned at least the national minimum wage was generally higher among those living south of the river Thames; see the final example presented as part of Map 1.
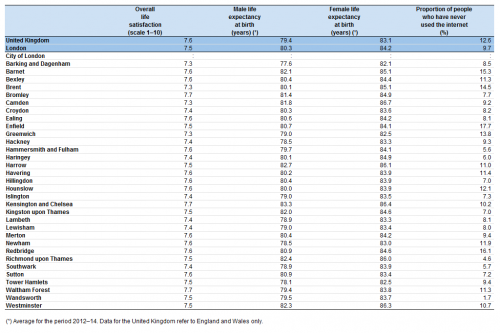
Source: Office for National Statistics (London Datastore, available at: http://data.london.gov.uk/publisher/ons)

Source: Office for National Statistics (London Datastore, available at: http://data.london.gov.uk/publisher/ons)
Source data for tables and graphs
Direct access to
- Urban Europe — statistics on cities, towns and suburbs (online publication)
- Degree of urbanisation classification - 2011 revision
- Eurostat regional yearbook
- Statistics on regional typologies in the EU
- Regions and cities (all articles on regions and cities)
- Territorial typologies
- Territorial typologies for European cities and metropolitan regions
- What is a city?
- Perception survey on quality of life in 79 European cities
- Urban audit (ESMS metadata file — urb_esms)
- Regional statistics by typology (ESMS metadata file — reg_typ_esms)
- European Commission, Directorate-General for Regional and Urban Policy, Urban development
- European Commission, Directorate-General for Regional and Urban Policy, A harmonised definition of cities and rural areas: the new degree of urbanisation
- OECD, Redefining urban: a new way to measure metropolitan areas