Archive:Urban Europe — statistics on cities, towns and suburbs — satisfaction and quality of life in cities
Data extracted in February–April 2016
This Statistics Explained article has been archived on 4 December 2020.
Highlights
In 2015, satisfaction with schools and other educational facilities among EU city-dwellers peaked at 88 % in the western French city of Rennes and the Dutch city of Groningen.
In 2015, the share of city-dwellers in the EU satisfied with healthcare services, doctors and hospitals peaked at 93 % in Antwerpen (Belgium), Groningen (the Netherlands) and Graz (Austria).
(rating, 0–10)
Source: Eurostat (ilc_pw02)
This chapter is part of an online publication that is based on Eurostat’s flagship publication Urban Europe — statistics on cities, towns and suburbs (which also exists as a PDF).
Definitions of territorial units
The various territorial units that are presented within Urban Europe — statistics on cities, towns and suburbs are described in more detail within the introduction. Readers are encouraged to read this carefully in order to help their understanding and interpretation of the data presented in the remainder of the publication.
Full article
Satisfaction and quality of life in cities
Economic output has traditionally been measured by gross domestic product (GDP), while GDP per capita is often used as a proxy for analysing living standards. However, the prominence given to GDP has resulted in a number of critiques that a wider range of indicators are needed to capture social developments, welfare, or environmental aspects of (sustainable) growth.
Moving beyond GDP
Following the publication of work done by the Commission on the Measurement of Economic Performance and Social Progress and a range of studies grouped under the heading of ‘GDP and beyond’, the measurement of economic and social progress has been refocused on a range of issues. This broader approach provides a means of measuring well-being and prosperity while considering environmental sustainability, focusing on distributional aspects of income, consumption and wealth, as well as the quality of life. These pillars are interlinked: for example, a household’s disposable income affects its level and patterns of consumption, which in turn may affect the environment, which will likely impact on well-being.
While overall economic output in the European Union (EU) has continued to rise, many commentators point out that higher overall living standards and prosperity have failed to deliver a better quality of life, especially with respect to the distributional aspects of income and wealth, which is increasingly concentrated in the hands of globalised business and the super-rich. Furthermore, studies have shown that if an individual receives an increase in his/her material wealth this does not necessarily imply that they will also experience an increase in well being, happiness or overall life satisfaction.
European policy initiatives linked to the quality of life
The EU’s renewed sustainable development strategy aims to identify and develop actions that enable the EU to achieve continuous improvements in the quality of life for both current and future generations, through the creation of sustainable communities that are able to manage and use resources efficiently, while promoting the ecological and social innovation potential of the economy, thereby ensuring prosperity, environmental protection and social cohesion.
The Leipzig charter on sustainable European cities aims to deliver ‘… high quality in the fields of urban design, architecture and environment’, so as to promote sustainable communities as places where people want to live and work, now and in the future: safe and inclusive places that are planned, built and run well, which offer equality of opportunity and good services for all.
The EU’s 2014–20 cohesion policy and more specifically its urban agenda are designed to invest heavily in urban areas, with EUR 15 billion directly managed by city authorities for sustainable urban development. They aim to deliver smart, sustainable and inclusive urban growth via initiatives for: smart cities, green cities and inclusive cities.
Analysing the quality of life: Eurostat’s approach
Eurostat and representatives of the EU Member States have designed an overarching framework for analysing the quality of life through eight dimensions which feed into the measurement of the overall experience of life. This multidimensional data has the potential to provide a detailed picture of how Europeans feel about their day-to-day lives and the societies they live in. It seeks to capture and balance objective measures of income, living conditions, education or health, with subjective measures such as an individual’s appreciation of their living environment, how safe they feel, or whether they can rely on friends/family.
This final chapter is divided into two parts. The first provides a selection of data based on the EU’s statistics on income and living conditions (EU-SILC) which are analysed by degree of urbanisation, highlighting urban challenges that result from the interplay between quality of life issues and sustainable development issues. The second half focuses more on subjective measures and is based on results from a perception survey on the quality of life in 79 European cities in 2015; note that the statistics presented for Athina (Greece), Paris (France), Lisboa (Portugal), London, Manchester and the Tyneside conurbation (all in the United Kingdom) relate to the concept of the greater city.
Satisfaction and quality of life by degree or urbanisation
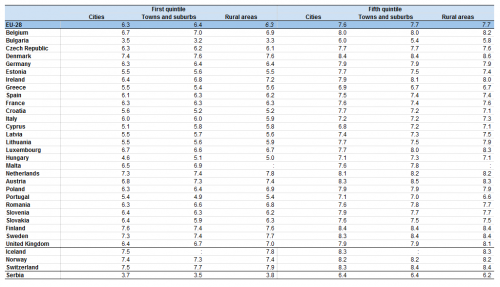
Table 1 provides an overview of overall life satisfaction with contrasting data on the highest and lowest income quintiles (in other words, the top and bottom 20 % of the population in terms of their income). Life satisfaction is a measure of how respondents evaluate or appraise their life as a whole. It does not aim to gauge the current emotional state of the respondent, but rather to capture a reflective judgement on their current level of satisfaction, based on a broad appraisal of life; the indicator is measured on a scale of 0–10 for each respondent.
In 2013, an analysis for the EU-28 for both the highest and the lowest income quintiles reveals the difference in overall life satisfaction between those living in the three different degrees of urbanisation was no more than 0.1 (on the basis of a scale from 0–10), in other words minimal. The highest earners living in cities had an overall level of life satisfaction of 7.6, which was 0.1 lower than in towns and suburbs or rural areas. The lowest earners living in cities had an overall level of life satisfaction of 6.3, which was the same as that recorded in rural areas, and 0.1 lower than in towns and suburbs.
High earners recorded a higher level of overall life satisfaction than those with the lowest incomes
Overall life satisfaction tended to be lower in some of the eastern EU Member States, the Baltic Member States and some of the Member States most affected by the financial and economic crisis, while it was generally higher (irrespective of the degree of urbanisation) in the Nordic Member States, the Netherlands and Austria. In all of the EU Member States, the top income quintile had higher levels of overall life satisfaction than the lowest income quintile for all three degrees of urbanisation; suggesting, at least in part, that money alleviates some of the challenges in life and help individuals to be more satisfied.
An analysis by degree of urbanisation reveals that people living in the cities of Croatia, Portugal, Estonia, Bulgaria, Greece and Slovenia generally had a higher level of overall life satisfaction than their compatriots living in towns and suburbs or rural areas. The opposite was true in Denmark, Ireland, Cyprus, Luxembourg and the United Kingdom, where those living in rural areas recorded the highest levels of overall life satisfaction.
Concentrating on people living in cities, the difference in overall life satisfaction between those in the highest and lowest income quintiles was 1.0 or less in Denmark, Luxembourg, Sweden, Finland and the Netherlands — all of which are characterised by their relatively high levels of expenditure on social policies and cohesion. By contrast, there were larger differences in levels of life satisfaction between those at either end of the income distribution in Bulgaria and Hungary (those in the upper quintile recorded a level of satisfaction that was 2.5 higher than for those in the lowest quintile), Estonia and Lithuania (2.2) and Croatia (2.1), where income differentials appeared to have a greater impact on overall life satisfaction.
(rating, 0–10)
Source: Eurostat (ilc_pw02)
Single persons living in cities tended to record a higher level of overall life satisfaction than those living alone elsewhere
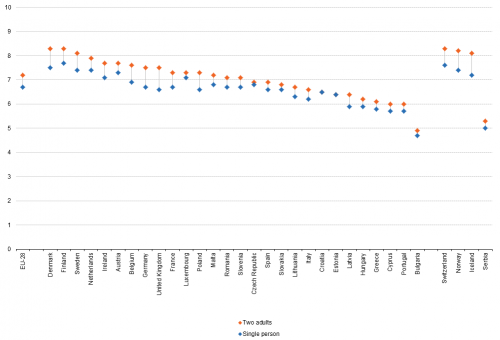
The data presented in Figure 1 details the overall rating for life satisfaction in cities according to household type; information is presented for those living alone (single persons) and for households composed of two adults (without children).
In 2013, life satisfaction among those living in the cities of the EU-28 stood at 6.7 for single persons and 7.2 for those living in a household composed of two adults; this pattern of higher levels of satisfaction for households composed of two adults was repeated consistently in each of the EU Member States. The biggest difference was recorded in United Kingdom (0.9), while those living in households composed of two adults also recorded a relatively high level of overall life satisfaction in Germany and Denmark (0.8 difference compared with those living alone), Belgium, Poland and Sweden (0.7).
In a majority of the EU Member States, the level of life satisfaction among single persons living in cities was higher than the national average recorded for those living alone; this was particularly the case in Bulgaria and Croatia (a difference of 0.6), as well as Romania, Slovakia and Hungary (0.3). These figures might suggest that single people living in cities profited from the wide range of opportunities that exist in many European cities for education, work, entertainment, culture, or friendship, while those living alone in the two other types of areas might feel more isolated and disconnected from life. There were six Member States where overall life satisfaction among single persons living in cities was lower than for the whole population living alone (although their differences were not very large), they were: Denmark, Sweden, Ireland, Belgium, Cyprus (a difference of 0.1) and the United Kingdom (0.2).

(rating, 0–10)
Source: Eurostat (ilc_pw02)
Satisfaction with accommodation tended to be somewhat lower among those living in cities
Housing is an important dimension for measuring the quality of life, as appropriate shelter is one of the most basic human needs. The quality of housing can be measured in an objective manner by recording the existence of structural problems, a lack of space, or a lack of basic amenities (see Chapter 10 for more details), or in a subjective manner, through the respondent’s satisfaction, on a scale of 0–10, in relation to whether their accommodation: meets the household’s needs; is of sufficient quality; is a financial burden; provides adequate space; is in a desirable neighbourhood; is a relatively short distance to work.
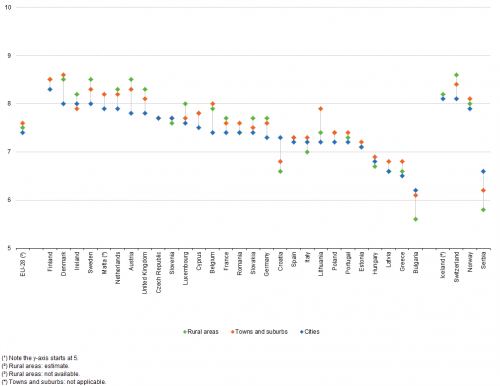
One may imagine that overall levels of satisfaction with accommodation might be lower in cities, given that city-dwellers generally have less space to live in, tend to live much closer to their neighbours and may therefore be more affected by issues such as noise, and often pay higher rent or prices. Average levels of satisfaction with accommodation were highest in the EU-28 (7.6 on a scale of 0–10) among those living in towns and suburbs, while the corresponding values for people living in rural areas (7.5) and cities (7.4) were slightly lower. This pattern of people living in cities recording lower levels of satisfaction with their accommodation was particularly evident in Austria, Belgium, Denmark, Lithuania, Sweden, the United Kingdom, Germany, the Netherlands and Cyprus. On the other hand, in Croatia and Bulgaria those living in cities were more satisfied with their accommodation than people living in towns and suburbs or rural areas.
(rating, 0–10)
Source: Eurostat (ilc_pw02)
City-dwellers in most of the western Member States were relatively unsatisfied with their living environment
An indicator on a person’s satisfaction with their living environment aims to measure access to a range of services (for example, shops or public transport) and the presence of entertainment in the form of cinemas, museums or theatres. It refers, within the context of EU-SILC, to an area within close proximity of the respondent’s home (where they usually go shopping, for a walk, or their route/journey home).
In 2013, the satisfaction of EU-28 city-dwellers with their living environment was rated with an average score of 7.2 for cities; by contrast, slightly higher ratings were recorded for both towns and suburbs (7.3) and rural areas (7.4).
The level of satisfaction among city-dwellers with their living environment was higher than for those living in rural areas in 12 of the 27 EU Member States for which data are available (Malta, incomplete data); this was particularly the case in Croatia, the southern Member States of Cyprus, Portugal and Italy and the Nordic Member States. However, city-dwellers recorded a lower level of satisfaction (than those living in rural areas) with their living environment in 14 EU Member States; this was particularly the case in the Czech Republic, Romania and the United Kingdom, as well as Germany, France and Belgium.

(rating, 0–10)
Source: Eurostat (ilc_pw02)
Bulgarians and Greeks living in cities were least satisfied with their commute to/from work
The average satisfaction with commuting time is an indicator that refers to the respondent’s opinion/feeling about their degree of satisfaction with the time it takes to commute to work. While it may be expected that the indicator is lower in cities if commuters face congestion and delays on intra-urban transport, this may be balanced against people living closer to their place of work in cities. Rated on a scale of 0–10, those living in cities across the EU-28 in 2013 gave an average score of 7.3 in terms of their satisfaction with their commuting time, which was slightly lower than the ratings for those living in rural areas (7.4) or towns and suburbs (7.5).
There were 9 out of 27 EU Member States for which data are available (Malta, incomplete data), where the level of satisfaction with commuting time was higher in cities than it was in rural areas, while there were 10 Member States where the level of satisfaction was higher among those living in rural areas. Those living in the cities of Bulgaria and Greece were particularly unsatisfied with their commute to work, and this was also the case (although to a lesser degree) for those living in the cities of Spain and the United Kingdom (see Figure 4). On the other hand, those living in the cities of Croatia, Cyprus, the Czech Republic, Slovenia, Estonia, Luxembourg, Romania, Germany and France were more satisfied than people living in rural areas with their commuting time.

(rating, 0–10)
Source: Eurostat (ilc_pw02)
Self-perceived satisfaction and quality of life in European cities
When individuals search for a better quality of life their choices can often be summarised as trade-offs, for example: they could pay less for a much bigger house in the suburbs, but then lose easy access to a range of cultural amenities and need a longer commute to work. This final section presents information on a range of issues and the perceptions that Europeans have in relation to each of these.
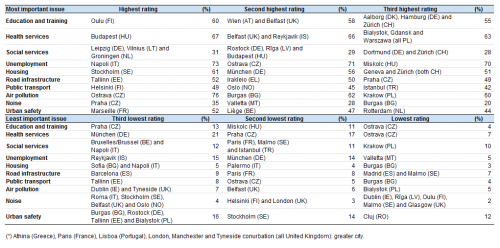
Some of the most common concerns of city-dwellers include having a decent job with a regular income and access to good quality health and education services
Table 2 provides information based on results of a 2015 perception survey for 79 cities across Europe; it shows the three factors that city-dwellers considered as being the most/least important in terms of their impact on the city where they lived. While a high proportion (76 %) of city-dwellers from Ostrava (the Czech Republic) considered air pollution to be the most important item for their city, some 73 % of inhabitants from Napoli (Italy) named (un)employment, while around two thirds (67 %) of respondents from the Hungarian capital of Budapest cited health services. There are clearly trade-offs in each city: for example, while housing was considered an important item in cities including Stockholm, München, Geneva or Zürich, this could, at least in part, reflect low levels of unemployment and high-quality education and health services in each of these cities, as well as relatively high property prices and a shortage of supply for accommodation.
(% of respondents naming the issue as one of the three most important items for their city)
Source: Eurostat (urb_percep)
People living in Antwerpen, Groningen and Graz recorded the highest levels of satisfaction among EU cities in relation to the provision of healthcare services, doctors and hospitals …
Ill health can undermine an individual’s quality of life, while at a collective level it may hinder economic and social developments. Living a long and healthy life is therefore not just a personal aim, as it also has the potential to impact upon societal well-being, which is particularly important given Europe’s ageing population. While health conditions are often measured using objective indicators such as life expectancy, healthy life years or infant mortality, a subjective evaluation of health issues can provide important information in relation to an individual’s well-being.
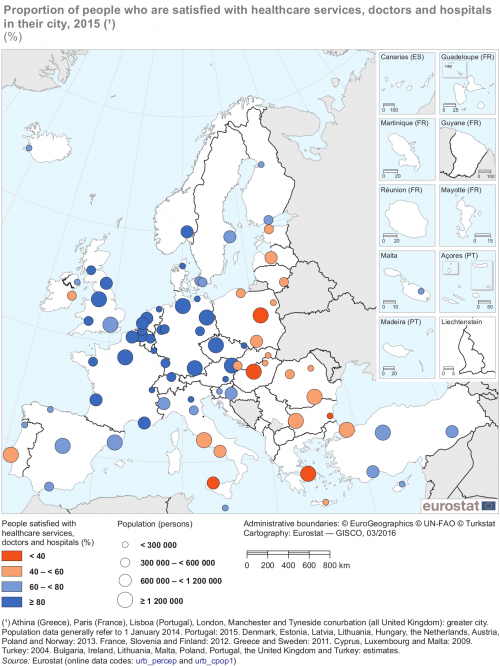
Maps 1–5 are based on results from the perception survey, with the circles for each city having been scaled proportionally to reflect their total number of inhabitants; note that the same classes have been used to classify the cities for the first four maps. In relation to health issues (see Map 1), respondents were asked to what degree they were satisfied with healthcare services, doctors and hospitals in their city. In 2015, the share of the city-dwellers who were satisfied with healthcare services, doctors and hospitals peaked in the EU at 93 % in Antwerpen (Belgium), Groningen (the Netherlands) and Graz (Austria); an even higher share was recorded in the Swiss city of Zürich (97 %).
A majority of respondents in most cities were generally satisfied with their healthcare services, doctors and hospitals. However, there were 16 cities in the EU where the satisfaction rate fell below 50 %. The lowest level of satisfaction was recorded in the Greek capital of Greater Athina (32 %), while seven other capitals reported that their satisfaction rate was lower than 50 % — Warszawa, Budapest, Bucureşti, Rīga, Bratislava, Roma and Sofia. It was relatively common (among those countries for which multi-city data are collected) to find that the capital city had the lowest proportion of people who were satisfied with their healthcare services, doctors and hospitals; the only exceptions where a city other than the capital city had the lowest levels of satisfaction were Burgas in Bulgaria, Ostrava in the Czech Republic, Palermo in Italy, Rotterdam in the Netherlands, Oulu in Finland, and Malmö in Sweden.
(%)
Source: Eurostat (urb_percep) and (urb_cpop1)
… while people living in Rennes and Groningen recorded the highest levels of satisfaction in relation to the provision of education and training
Education can also play an important role in determining life chances and has the potential to increase the quality of life for individuals, while increasing overall human capital; by contrast, a failure to invest in educational skills and qualifications may impact upon the variety of jobs that are open to particular individuals; while also lowering the skills and productivity of the workforce. As with health, education can be measured using objective indicators (such as the number of early school leavers, participation rates in lifelong learning and educational attainment), but may alternatively be analysed in relation to the proportion of people who are satisfied with schools and other educational facilities in their city.
In 2015, satisfaction with schools and other educational facilities peaked at 88 % in the western French city of Rennes and the Dutch city of Groningen, while high satisfaction rates were also recorded in the northern Portuguese city of Braga as well as Antwerpen in Belgium (see Map 2). There were only three cities in the EU where less than half the respondents were satisfied with their schools and other educational facilities: Bucureşti (48 %), Sofia (47 %) and Palermo (43 %); there were also two Turkish cities, Diyarbakir (49 %) and Istanbul (44 %).
Satisfaction levels were, once again, relatively low in capital cities, insofar as the capital city recorded the lowest satisfaction rate for schools and other educational facilities in 16 of the 19 EU Member States for which data are collected for multiple cities; the exceptions, where another city recorded the lowest satisfaction, were: Marseille in France, Palermo in Italy and Malmö in Sweden.

(%)
Source: Eurostat (urb_percep) and (urb_cpop1)
A high proportion of people living in Oulu and Aalborg felt they could trust others living in their city …
Within the perception survey, respondents were asked to state what level of trust they had in others. Map 3 provides an analysis of the results for 2015, with Oulu (Finland) and Aalborg (Denmark) the two cities in the EU with the highest shares of people feeling that they could trust most people in their city (shares of 92 % and 91 % respectively).
There were 13 cities in the EU where the share of respondents who felt they could trust most people fell to less than 50 %. All but three of these were capital cities — Greater Paris, Lefkosia, Roma, Warszawa, Praha, Budapest, Bucureşti, Bratislava, Sofia and Greater Athina — with the exceptions being Liège in Belgium, Marseille in France and Miskolc in Hungary; there were also two Turkish cities where the level of trust in others was below 50 %, Antalya and Istanbul (where the lowest share was recorded, 26 %).
It was once again common to find that the lowest levels of trust in others were often recorded in capital cities: this pattern was repeated in most of the EU Member States for which multi-city data are available; the only exceptions being Liège, Marseille and Miskolc (as detailed above), as well as Malmö in Sweden.

(%)
Source: Eurostat (urb_percep) and (urb_cpop1)
… while people living in Luxembourg recorded the highest levels of satisfaction in relation to the provision of administrative services
In 2015, the highest share of respondents agreeing that the administrative services in their city helped people efficiently was recorded in Luxembourg (80 %), well ahead of Belfast in the United Kingdom (71 %) and Aalborg in Denmark (70 %); the highest proportion of people in cities of non-member countries who agreed with this premise was recorded in the Swiss city of Zürich (78 %).
At the other end of the range, the lowest shares of respondents who felt that administrative services in their city helped people efficiently were recorded in the Italian cities of Roma (27 %), Napoli (22 %) and Palermo (19 %). This pattern was in contrast to the situation in the two northern Italian cities of Bologna and Verona, where a majority of respondents agreed with the premise (56 % and 60 % respectively).
A majority of respondents agreed that the administrative services in their city helped people efficiently in 41 out of the 71 cities in the EU for which data are available (see Map 4); in the German city of Dortmund and the Portuguese capital of Greater Lisboa, half (50 %) of the population was in agreement with the premise.

(%)
Source: Eurostat (urb_percep) and (urb_cpop1)
An analysis of Maps 1–4 reveals that a relatively high proportion of the population was satisfied with their healthcare services, doctors and hospitals, as at least four fifths of those surveyed declared they were satisfied in 33 out of the 79 participating cities (as shown by the dark blue shading in Map 1). The level of satisfaction with schools and other educational facilities was somewhat lower, as only 17 cities reported that at least four fifths of their population was satisfied with these services. In 16 out of the 79 cities surveyed, at least four fifths of the population felt that most people in their city could be trusted. The lowest levels of satisfaction were recorded with respect to the proportion of people who agreed that the administrative services in their city helped people efficiently, as Luxembourg was the only city where at least four fifths of the population agreed with this premise.
People living in some of the EU’s largest cities recorded relatively low levels of satisfaction with life in their city
It might be imagined that Europe’s largest and most vibrant metropolises (such as Paris and London) are among those cities where people enjoy life the most. However, as detailed above, a high number of capital cities reported relatively low levels of satisfaction when respondents were asked about their perceptions on a range of issues such as health, education, or trust in others. By contrast, Maps 1–4 suggest that the highest levels of satisfaction were often recorded in smaller, more provincial cities.
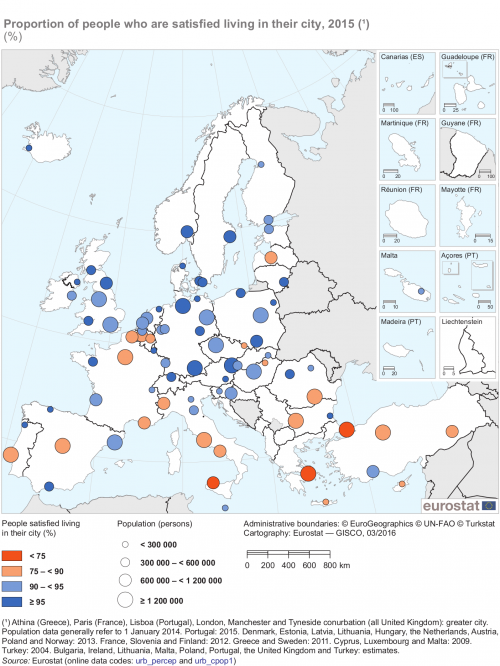
In 2015, the overwhelming majority of people living in all 79 European cities covered by the perception survey were satisfied living in their city (see Map 5; note that the class boundaries used to categorise the cities in this map are different to those employed for Maps 1–4). The highest satisfaction rates in the EU — 97 % or 98 % — were recorded in Aalborg (Denmark), Hamburg, Leipzig, München and Rostock (all in Germany), Málaga (Spain), Braga (Portugal), Belfast and Cardiff (both in the United Kingdom), as well as the three northern capitals of København, Vilnius and Stockholm; even higher shares (99 %) were recorded in Oslo (Norway) and Zürich (Switzerland).
The lowest proportions of people who were satisfied living in their city were recorded in Palermo (67 %), Greater Athina (71 %) and Napoli (75 %); these were the only cities in the EU where no more than three quarters of the population were satisfied. Among all of the cities surveyed, the lowest proportion of people who were satisfied living in their city was recorded in the Turkish city of Istanbul (65 %).
(%)
Source: Eurostat (urb_percep) and (urb_cpop1)
Chapter 12 presented evidence in relation to the urban dimension of inclusive growth often appearing to be inversely related to the level of economic development: with more developed, western EU Member States tending to report less inclusive cities. This chapter has shown that those living in cities appear to be aware of the challenges they face, insofar as city-dwellers in large, western European cities are often less satisfied with life than those living in towns and suburbs or rural areas. However, a majority of eastern and some southern Member States have lower levels of social exclusion and poverty in cities. Results from the perception survey confirmed this view insofar as subjective responses suggest that a higher share of the population living in the cities of eastern Member States are satisfied with life, whereas lower levels of satisfaction were recorded in the rural areas of eastern Member States where poverty and social exclusion tended to be concentrated.
Source data for tables and graphs
Direct access to
- Urban Europe — statistics on cities, towns and suburbs (online publication)
- Degree of urbanisation classification - 2011 revision
- Eurostat regional yearbook
- Quality of life indicators (online publication)
- Statistics on regional typologies in the EU
- Regions and cities (all articles on regions and cities)
- Territorial typologies
- Territorial typologies for European cities and metropolitan regions
- What is a city?
- Perception survey on quality of life in 79 European cities
- Urban audit (ESMS metadata file — urb_esms)
- Regional statistics by typology (ESMS metadata file — reg_typ_esms)
- European Commission, Directorate-General for Regional and Urban Policy, Urban development
- European Commission, Directorate-General for Regional and Urban Policy, A harmonised definition of cities and rural areas: the new degree of urbanisation
- OECD, Redefining urban — a new way to measure metropolitan areas
