Archive:Urban Europe — statistics on cities, towns and suburbs — housing in cities
Data extracted in February–April 2016
This Statistics Explained article has been archived on 4 December 2020.
Highlights
In 2014, detached houses provided a home to only 14.2 % of city-dwellers in the EU, compared with two thirds (63.3 %) of the rural population; 59.9 % of the population living in cities occupied a flat.
(%)
Source: Eurostat (urb_percep) and (urb_cpop1)
This chapter is part of an online publication that is based on Eurostat’s flagship publication Urban Europe — statistics on cities, towns and suburbs (which also exists as a PDF).
Definitions of territorial units
The various territorial units that are presented within Urban Europe — statistics on cities, towns and suburbs are described in more detail within the introduction. Readers are encouraged to read this carefully in order to help their understanding and interpretation of the data presented in the remainder of the publication.
Full article
Housing in cities
Adequate housing is recognised by the United Nations (UN) as a fundamental human right:
Article 25 of the Universal Declaration of Human Rights (1948): Everyone has the right to a standard of living adequate for the health and well-being of himself and of his family, including food, clothing, housing and medical care and necessary social services …
Such a provision extends beyond four walls and a roof, and should ensure, among others: security of tenure; adequate space; protection against the elements; reliable services; and affordability, so the price of housing does not compromise other human rights. Nevertheless, some Europeans live in precarious conditions: they may be homeless or living in slums, while many more live in neighbourhoods that are characterised by overcrowding and/or poor quality housing — these are often in urban areas. Such issues may lead, among others, to lower life chances, health inequalities, increased risks of poverty and environmental risks. While many people struggle to find an appropriate place to live, parts of some cities and towns are characterised by a considerable proportion of their housing stock being either empty, or used as secondary homes.
Within the European Union (EU), each individual Member State makes its own housing policy: most have some form of urban planning that prevents developers from building on green belt land or areas that are protected for their natural beauty/habitat. Such rules are designed to constrain urban growth/sprawl and to encourage those owning the existing housing stock to either redevelop or rebuild.
This chapter provides a portrait of housing conditions that are faced by Europeans living in urban areas covering, among others: their types of housing; living space; the structure/composition of households; house prices; and the rate at which people move home.
Some of Europe’s most fashionable cities have a ‘housing gap’
As shown in Chapter 4, some of Europe’s capital cities are economically dominant, with a large number of people wanting to live in these cities in order to benefit from the education, jobs, lifestyles and cultural life that they offer. The buoyant demand for property in some of Europe’s most popular cities has also attracted investors, many of whom seek to establish property portfolios. Given that land in urban centres is a finite resource, such an increase in demand may result in spiralling property and rental prices (unless adequately regulated).
The global financial and economic crisis led to a sizeable contraction in construction activity across the EU; this was particularly the case with respect to social housing, as many governments restrained their level of public spending. Some new housing or office developments in Europe’s major cities are designed to attract (international) investors — for example, luxury riverside developments or the gentrification of previously unfashionable areas. By contrast, local residents are more likely to be interested in an expansion of affordable (social) housing that provides them with the opportunity to continue living in the area where they have grown-up, rather than feeling that it is necessary to move out of cities to live in more affordable suburbs or rural locations.
Types of housing
In 2014, an analysis by type of dwelling reveals that across the whole of the EU-28, just over one third (33.7 %) of the population was living in a detached house, slightly more than one quarter (25.8 %) in a semi-detached or terraced dwelling, while the highest share (39.7 %) lived in a flat.
Extending the analysis by degree of urbanisation, reveals the extent to which space is a limited commodity in most cities. Detached houses provided a home to only 14.2 % of city-dwellers in the EU-28, while 59.9 % of the population living in cities occupied a flat (with more than two thirds of these living in flats that were composed of at least 10 separate dwellings). On the other hand, almost two thirds (63.3 %) of the rural population lived in a detached house.
Town and suburban developments are characterised by greater amounts of living space and lower density housing than in cities, and almost two thirds (64.5 %) of the EU-28 population that was living in towns and suburbs occupied a house (rather than a flat). Such suburban lifestyles are increasingly linked to climate change and environmental concerns, as low-density developments generally result in higher energy and resource use, as well as increased pressures on local ecosystems and biodiversity.

(%)
Source: Eurostat (ilc_lvho01)
Considerable variations in composition of dwellings between EU Member States and between cities in the same Member State
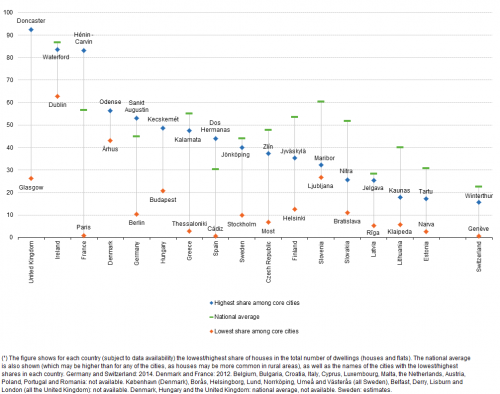
Figure 2 shows there were some considerable structural differences between EU Member States in 2011 as regards the composition of their housing stock. The share of houses in the total number of dwellings was relatively low for all cities in the Baltic Member States, Slovakia, Slovenia and Finland; indeed, their highest city shares were considerably lower than their national averages. By contrast, it was relatively common to find houses (rather than flats) in most cities across Ireland and the United Kingdom.
More generally, the share of flats in the total number of dwellings tended to be higher in those cities with a larger number of inhabitants. Indeed, it was commonplace to find that the capital city had the highest share of flats and the lowest share of houses in its total number of dwellings, likely due — among others — to the cost of land, a lack of space for new property developments, a range of alternative land uses competing for space (business and commercial property), and a high level of demand from those wishing to live in the capital city. As an example, flats made-up 99.0 % of all dwellings in the French capital of Paris in 2012.
Within a single EU Member State, the proportion of houses/flats in the total number of dwellings varied considerably between different cities. For example, while flats accounted for 99.0 % of the housing stock in the French capital in 2012, houses accounted for more than four fifths (83.2 %) of the total number of dwellings in the northern French Communauté d’agglomération Hénin - Carvin which is located to the east of Lens. There was also a wide disparity in the United Kingdom, as in 2011 the share of houses in the total number of dwellings peaked at 92.4 % in Doncaster (Yorkshire), but fell as low as 26.3 % in Glasgow (Scotland), where 19th century tenements (multi-dwelling flats that provided high-density housing during the industrial revolution) continue to account for a considerable share of properties.
A more detailed set of information is available for selected subcity districts and this shows that even within the same city there can be considerable variations in the composition of the housing stock. In 2011, flats accounted for more than 90 % of the dwellings in the central London boroughs of the City of London and Westminster, whereas at the other end of the scale, houses accounted for more than three quarters of all dwellings in the eastern suburban boroughs of Bexley and Havering.
(%)
Source: Eurostat (urb_clivcon)
Often dwellings in former industrial heartlands were constructed more than a century ago
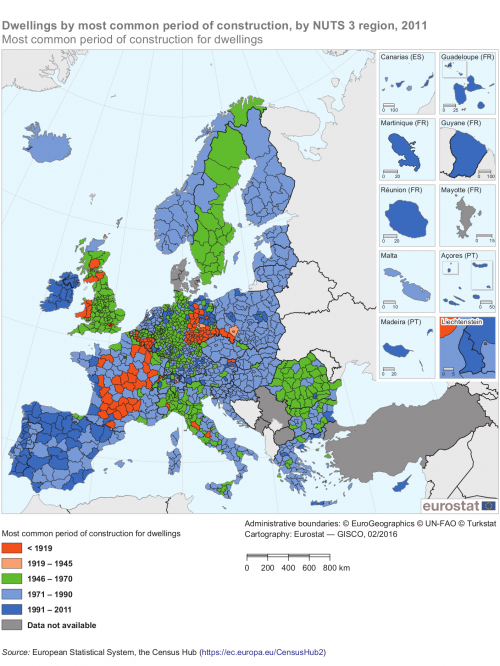
Map 1 presents an analysis of the most common period of construction for the stock of dwellings in 2011 for each NUTS level 3 region; note the map includes rural regions. Some former industrial heartlands that were established during the 19th century, principally around coal and steel industries, report that approximately half of their dwellings were constructed before 1919. This was the case in Belgium’s ‘sillon industriel’ for towns and cities such as Mons, Charleroi or Huy, while a similar pattern was observed in the Central Valleys of Wales (the United Kingdom), for example, in the former mining towns of Merthyr Tydfil, Aberdare or Pontypridd.
Many regions report that the post-war period was their most common for construction
A majority of the dwellings in many regions of the EU were constructed during the period 1946–70, a period of reconstruction after World War II, characterised by both economic and demographic (the baby-boom years) growth; this pattern was particularly apparent in some German cities, for example, Bremerhaven, Essen, Gelsenkirchen or Würzburg, where around half of the housing stock in 2011 was built during this post-war period.
After 1970, there was a rapid expansion in building in some of the eastern EU Member States: for example, almost half of the dwellings in the Romanian capital of Bucureşti were built during the period 1971–90 and a similar pattern was observed in several regions across the Baltic Member States. A high proportion of the dwellings in the Italian region of Avellino (near to Napoli) were also constructed during this period; this may be linked to a programme of rebuilding/reconstruction following earthquakes in 1980 and 1981.
There are relatively few examples of regions where the largest share of dwellings were constructed during the last two decades
There were five NUTS level 3 regions in the EU-28 where a majority of the dwellings were built during the period 1991–2011, these included the French overseas departments of Guyane and Réunion, the Spanish regions of Fuerteventura (in the Canary Islands) and Melilla (an autonomous city in northern Africa), as well as Cyprus (a single region at this level of analysis).
Two Portuguese regions — both synonymous with tourism— had a slightly lower proportion of their dwellings constructed post-1991, the southern coastal region of the Algarve (44.6 %) and the Região Autónoma da Madeira (46.9 %). Elsewhere, the Dutch region of Flevoland — located just to the east of Amsterdam — is an interesting case, insofar as it was reclaimed from the Zuiderzee and forms the world’s largest artificial island; slightly less than half (45.9 %) of its dwellings were constructed during the period 1991–2011, and many are inhabited by people who work in the Dutch capital. It is also interesting to note that the German, Polish and Romanian capital city regions were characterised by a ring of surrounding region(s) where there was a high proportion of recently constructed dwellings, suggesting that some people were moving out to the suburbs and satellite towns in search of more space and a different lifestyle (see also Figure 10).
(highest share of the total number of dwellings)
Source: European Statistical System, the Census Hub https://ec.europa.eu/CensusHub2
Some 70.1 % of the EU-28 population owned their own home
As with the different types of dwelling that make-up the housing stock, there are considerable differences between EU Member States in relation to levels of home ownership. In 2014, some 70.1 % of the EU-28 population owned their home. This share peaked at 96.1 % in Romania, while Hungary, Croatia, Lithuania and Slovakia also reported very high shares of home ownership (within the range of 88–91 %). Note that at the end of the 1980s/start of the 1990s, many of the former socialist countries of eastern Europe and the Baltic Member States decided to transform their housing markets through privatisation schemes, often selling housing stock to existing inhabitants at relatively low prices. By contrast, a sizeable rental market for accommodation may promote residential mobility and improve labour market flexibility. The share of the population who were tenants was relatively high (within the range of 30–40 %) in Denmark, the United Kingdom, France, the Netherlands, Ireland and Sweden, rising to 42.8 % in Austria and peaking at 47.5 % in Germany.
Much higher home ownership rates were recorded in some functional urban areas in eastern Europe …
Figure 3 presents an analysis of home ownership rates for selected functional urban areas (cities and their commuting zones) and it confirms that home ownership rates were often much higher in eastern EU Member States. In 2011, more than 9 out of every 10 households in Yambol (south-east Bulgaria) and Slavonski Brod (eastern Croatia; 2014 data) owned the accommodation in which they lived. However, this pattern was not repeated in all of the former socialist countries, as much lower levels of owner-occupation were recorded in Poland and former East Germany. The lowest rate of owner occupation among functional urban areas (subject to data availability) was recorded in the eastern German city of Frankfurt (Oder), where less than one in five households (19.0 %) owned the accommodation in which they lived (2010 data).
… whereas home ownership was often less common in capital cities
In recent decades, it has become increasingly difficult for young people to get onto the housing ladder (in other words to buy their first property), leading to the formation of a ‘rental generation’, with the dream of home ownership well out of reach for many of the EU’s population. This pattern may be magnified in cities, where house prices tend to be higher than in rural areas, suggesting that prospective home owners would need to devote a higher share of their disposable income to housing costs.
The share of households owning their own dwelling was generally higher among those living in smaller functional urban areas than it was among those living in larger/capital cities; this may in part reflect the age structure of populations in capital cities that tends to be skewed in favour of younger people (who are less likely to own a home). For example, just 39.3 % of those living in the Danish capital of København owned their accommodation (2012 data). There are, however, a range of other reasons why a relatively low proportion of the population might own a property: for example, the low share (36.8 %) in the Dutch city of Delft may be attributed, at least in part, to a high proportion of students and foreign expatriates within the population, while in the northern Parisian suburbs of Saint Denis (36.1 %) it may, at least in part, be influenced by a high proportion of social housing (for rent) within the total housing stock.
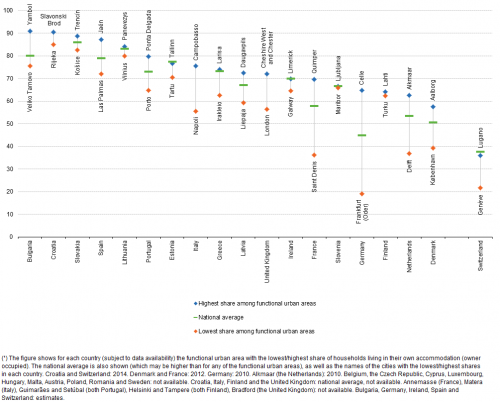
(%)
Source: Eurostat (urb_clivcon)
Living space
The smallest dwellings were often located in the cities of eastern and Baltic Member States
In 2011, among those EU Member States for which data are available, the average living space available to city-dwellers ranged from a high of 50.2 m² per person in the southern Greek city of Kalamata down to 19.3 m² per person in the western Romanian city of Buzau (see Figure 4); all of the cities with relatively low amounts of living space were located in eastern and Baltic Member States.
Aside from Kalamata, the highest amounts of living space per individual were registered in the southern Italian city of Lecce, the German city of Sankt Augustin (to the east of Bonn and the south of Köln), four provincial cities in France (Albi and Tarbes in the south-west, Niort in the west, and Quimper in the north-west), the Portuguese coastal city of Aveiro, and the affluent, northern suburb of the Spanish capital, Las Rozas de Madrid.
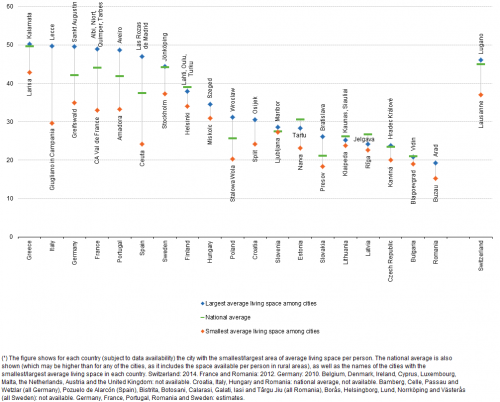
(m²/person)
Source: Eurostat (urb_clivcon)
Structure of households
Average household size tends to be lower in northern Europe, where a relatively high proportion of people live alone, whereas it is more commonplace for households to be composed of more people in eastern and southern EU Member States, where fewer people live alone and it is more common for different generations to continue to share the same abode.
A particularly high share of people living in the German capital resided in one-person households
An analysis by functional urban area shows that the average household size in capital cities in 2011 was lower than national averages, while a higher proportion of people lived alone in capital cities (see Figure 5). This pattern was observed for the majority of EU Member States, exceptions being Estonia (2013 data), Bulgaria and Ireland. The proportion of people living alone was considerably higher in the German capital of Berlin (9.0 percentage points above the national average in 2012), the Slovak capital of Bratislava (7.4 points) and the Dutch capital of Amsterdam (4.8 points in 2013).
The highest shares of one-person households were recorded in four capital cities located in western and northern Europe; Copenhagen, Amsterdam, Helsinki and Berlin (where almost half, 49.0 %, of all households in Berlin were composed of a single person). At the other end of the range, one-person households accounted for less than one quarter (22.5 %) of the total number of households in Dublin; this may, at least in part, be attributed to the relatively high cost of rental properties and/or cultural differences, such as a broader inclination (especially among young people) to share a dwelling with other people.
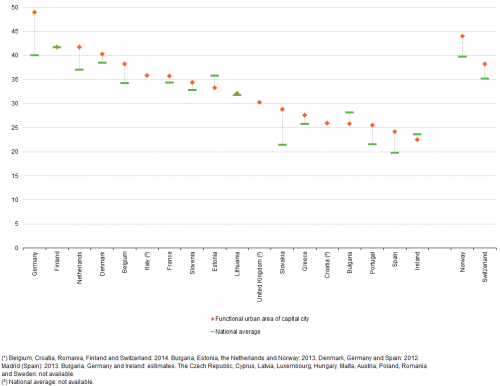
(% of all households)
Source: Eurostat (urb_llivcon)
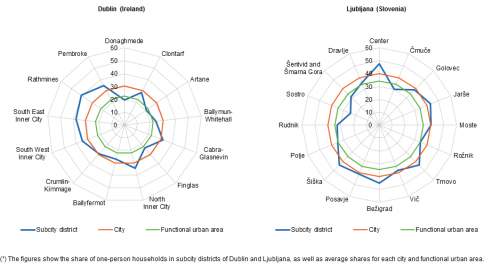
In both Dublin and Ljubljana, the proportion of one-person households was higher in the city centre, with larger households more common on the outskirts of each capital
Figure 6 provides a more detailed picture of the proportion of people living alone in the Irish and the Slovenian capital cities of Dublin and Ljubljana in 2011; the information is provided for subcity districts, the city average and wider functional urban areas.
As noted above, less than one quarter of the total number of households in the functional urban area of Dublin were composed of one-person households. However, an analysis for the city itself shows that single-person households tended to gravitate towards the city (centre), where 30.5 % of all households were composed of a single person. In Ljubljana, the proportion of one-person households rose from 34.4 % for the wider functional urban area to 40.0 % when analysing the city itself.
A more detailed analysis reveals that the highest proportions of one-person households in Dublin were recorded to the south of the River Liffey in the districts of Southern Inner City, Pembroke and Rathmines, areas which are characterised by a high proportion of rental accommodation primarily used by students, those entering employment, and new migrant communities. In Ljubljana, the highest proportions of single person households were recorded in four subcity districts running from north to south through the Slovenian capital, namely, Bežigrad, Šiška, Center and Trnovo, with the highest share of one-person households in the Center (47.9 %).
There are a number of reasons which may explain these patterns: city centres offer a high level of services and so respond to the needs of single people, they attract young people through education, job and recreational opportunities, and they are often characterised by older/smaller properties which tend to be rented. By contrast, on the outskirts of functional urban areas it is easier to find larger properties, which may offer more affordable housing, spacious living environments, and friendly/secure neighbourhoods more suited to raising a family.
Lone-parent households were also more common in capital cities
Figure 7 shows that lone-parent households were more common in the functional urban areas of capital cities than they were nationally for each of the 15 EU Member States for which data are available in 2011. Relatively large differences were recorded in Portugal and Slovakia, where the share of lone-parent households in the total number of households was 1.3 percentage points higher than the national average in both capitals, while this difference peaked at 2.2 percentage points in Italy.

(% of all households)
Source: Eurostat (urb_llivcon)
House prices
Buying a house is invariably the single largest purchase that most people will make during their lifetime, while housing is generally the single largest monthly expenditure item for many households, either in the form of mortgage/loan repayments or rental costs/charges. In 2014, approximately 7 % of the EU-28 population faced the situation where housing costs accounted for more than half of their disposable income.
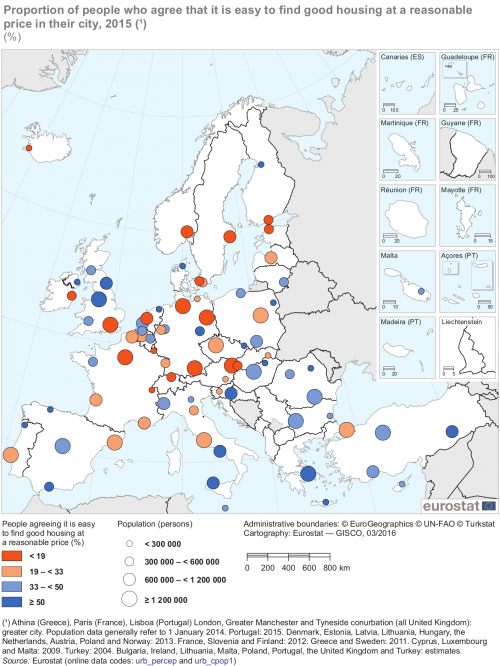
The larger a city the less likely its inhabitants were to agree that it was easy to find good housing
In 2015, the proportion of people who agreed that it was easy to find good housing at a reasonable price in their city ranged from 10 % or less in København (Denmark), München, Hamburg, Berlin (all Germany), Greater Paris (France), Helsinki (Finland) and Stockholm (Sweden) up to 60 % or more in Aalborg (Denmark), Greater Athina (Greece), Málaga, Oviedo (both Spain), Braga (Portugal), Piatra Neamț (Romania), Oulu (Finland), Belfast and the Tyneside conurbation (both the United Kingdom); shares of less than 10 % were also recorded in the Swiss cities of Genève and Zürich.

(%)
Source: Eurostat (urb_percep) and (urb_cpop1)
Moving house
Residential mobility was greater among those living in cities
More than one in five (20.9 %) people living in a city in the EU-28 had moved dwelling during the five-year period prior to a survey in 2012, while the corresponding shares for those living in towns and suburbs (17.0 %) and rural areas (13.4 %) were lower (see Figure 8). These figures may be explained, at least to some degree, by a higher proportion of city-dwellers renting their accommodation and by the relatively large numbers of young people living in cities (in particular, students in higher education and young people moving to cities in search of work). This pattern was observed in all of the EU Member States, with city-dwellers living in the Netherlands, Germany, Denmark, Luxembourg and Austria particularly prone to move when compared with the behaviour of their rural counterparts.
Almost half (46.9 %) of the city-dwellers in Sweden in 2012 had moved dwelling during the five years prior to the survey, while the share was also over 40 % among city-dwellers from Denmark. However, in several southern and eastern EU Member States, it was relatively common to find that less than 10 % of the population (for all three degrees of urbanisation) had moved during the previous five-year period, although here too those living in cities were more likely to have moved than those living in rural areas. These low levels of residential mobility were particularly pronounced in Bulgaria and Romania, where less than 1 in 20 city-dwellers had moved dwelling during the previous five-year period.
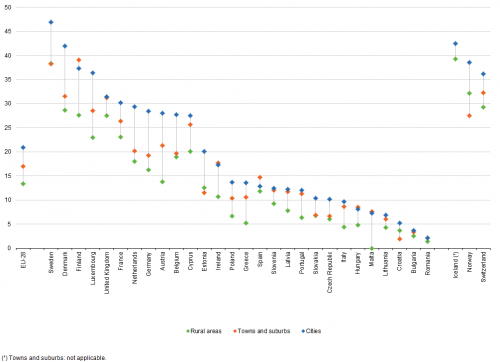
(%)
Source: Eurostat (ilc_hcmp05)
A relatively high share of city-dwellers in the Nordic Member States moved dwelling
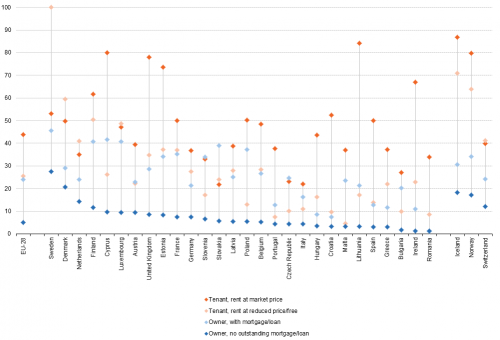
A closer analysis restricted to city-dwellers reveals that those living in rental accommodation were far more likely to have moved than people who owned their accommodation. In 2012, some 43.9 % of EU-28 city-dwellers living as tenants with a rent at market prices were found to have moved during the previous five years, compared with only 5.0 % for city-dwellers who owned their accommodation and had no outstanding mortgage or loan. The proportion of city-dwellers in the EU-28 who were living as tenants with reduced price or free rent and who had moved during the previous five years was 25.6 %, which was slightly higher than the share (24.1 %) recorded for homeowners who continued to have a mortgage or loan.
As may be expected, those EU Member States with some of the highest levels of residential mobility tended to record the highest proportions of people having moved for each tenure status. For example, more than 40 % of city-dwellers who were homeowners with a mortgage or loan moved during the previous five years in Sweden, Cyprus, Finland and Luxembourg, while more than one fifth of homeowners with no outstanding mortgage moved during the previous five years in Sweden and Denmark. The pattern was however somewhat different with respect to tenants renting at market prices, as the highest shares of people having moved during the previous five years were recorded in Lithuania (84.1 %), Cyprus (80.0 %) and the United Kingdom (78.0 %), while Ireland and Estonia both reported shares of at least two thirds.
(%)
Source: Eurostat (ilc_hcmp05)
The most common age for moving dwelling was 30–49 years-old
As noted above, it is relatively common for young people to initially move to central city locations for education or in search of work. Once they have established a career, their next step in life is often to consider starting a family. It is therefore not surprising to find that the most common age for people moving house is when they are 30–49 years-old, as a growing family requires additional space.
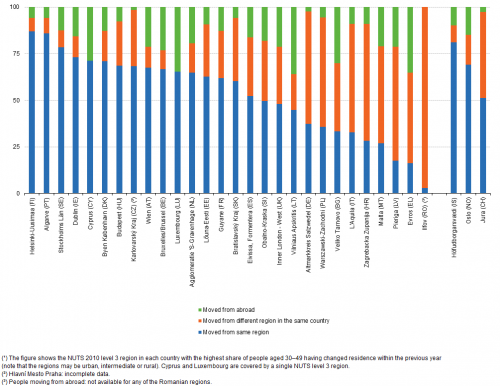
Figure 10 provides information by NUTS level 3 regions for 2011 relating to the origin of people who changed residence during the 12-month period prior to the latest population and housing census; note that the ranking includes rural regions. It shows, for each of the EU Member States, the region with the highest share of people aged 30–49 who changed residence; most of these regions were capital city regions. Indeed, more than 50 thousand people aged 30–49 moved during the 12-month period prior to the census in the following capital city regions: Stockholms Län (Sweden), Helsinki-Uusimaa (Finland), Inner London - West (the United Kingdom), Bratislavský Kraj (Slovakia), Bruxelles/Brussel (Belgium), Wien (Austria), and Budapest (Hungary).
The data presented in Figure 10 is also of interest insofar as it shows that it was relatively common for the majority of people who moved to do so between properties in the same region (intra-regional changes of residence); this was particularly true for Helsinki-Uusimaa, the Algarve (Portugal) and Stockholms Län, where more than 75 % of those people aged 30–49 who moved did so within the same region. On the other hand, only 2.8 % of those moving to the Romanian region of Ilfov came from the same region; it is likely that many of the new residents in Ilfov came from the Romanian capital of Bucureşti (which is encircled by Ilfov), with people leaving the capital city in order to move out to its suburbs and satellite towns in search of more space and a different lifestyle.
Figure 10 also provides details concerning the proportion of people who moved residence and arrived from another country (irrespective of whether this was another EU Member State or a non-member country). In Luxembourg (a single region at this level of detail), the Greek region of Evros (which is the northernmost region in Greece, bordering with Turkey to the east and Bulgaria to the north) and the Lithuanian region of Vilniaus Apskritis (which includes the capital of Vilnius and borders onto Belarus), at least one third of all residents aged 30–49 who moved during the 12-month period prior to the census originated from another country.
(%)
Source: European Statistical System, the Census Hub https://ec.europa.eu/CensusHub2
Source data for tables and graphs
Direct access to
- Urban Europe — statistics on cities, towns and suburbs (online publication)
- Degree of urbanisation classification - 2011 revision
- Eurostat regional yearbook
- Living conditions (all articles on living conditions)
- Statistics on regional typologies in the EU
- Regions and cities (all articles on regions and cities)
- Territorial typologies
- Territorial typologies for European cities and metropolitan regions
- What is a city?
- Perception survey on quality of life in 79 European cities
- Urban audit (ESMS metadata file — urb_esms)
- Regional statistics by typology (ESMS metadata file — reg_typ_esms)
- European Commission, Directorate-General for Regional and Urban Policy, Urban development
- European Commission, Directorate-General for Regional and Urban Policy, A harmonised definition of cities and rural areas: the new degree of urbanisation
- OECD, Redefining urban — a new way to measure metropolitan areas
