Archive:Small and medium-sized enterprises
This Statistics Explained article is outdated and has been archived - for recent information see here.
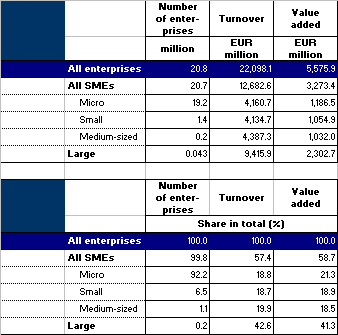
This article takes a look at small and medium-sized enterprises (SMEs) in the European Union (EU). SMEs are often referred to as the backbone of the European economy, providing a potential source for jobs and economic growth.
SMEs are defined by the European Commission as having less than 250 persons employed. They should also have an annual turnover of up to EUR 50 million, or a balance sheet total of no more than EUR 43 million according to Commission Recommendation of 6 May 2003 (see the 2005 user guide (PDF file) for the complete definition).

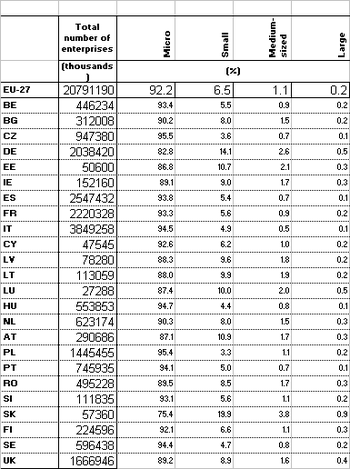
Source: Eurostat online data codes: (sbs_sc_ind_r2), (sbs_sc_con_r2), (sbs_sc_dt_r2), (sbs_sc_1b_se_r2))
Political reasoning for SME policies
It is important to use a precise definition of SMEs and to have data on them, for example when assessing which enterprises may benefit from EU funding programmes aimed at promoting SMEs, or for certain policies such as SME-specific competition rules. European Commission policy in relation to SMEs is mainly concentrated in five priority areas, covering:
- the promotion of entrepreneurship and skills;
- the improvement of SMEs' access to markets;
- cutting red tape;
- the improvement of SMEs' growth potential;
- strengthening dialogue and consultation with SME stakeholders.
To provide SMEs with a "spokesperson", a special SME envoy has been set up in the European Commission Directorate-General DG Internal Market, Industry, Entrepreneurship and SME's with the objective of better integrating the SME dimension into EU policies. Special legislation of which the implementation is regularly being assessed guarantees SMEs a special focus in enterprise policy.
Annual structural business statistics (SBS) with a breakdown by size class are the main source of data for an analysis of SMEs' contribution to the economy. A limited set of the standard structural business statistics variables (number of enterprises, turnover, persons employed and employees, value added, etc.) is available mostly down to the 3-digit (group) level of the NACE activity classification based on criteria that relate to the number of persons employed in each enterprise. The number of size classes available varies according to the activity under consideration. However, the main classes used for presenting the results are:
- micro enterprises: with less than 10 persons employed;
- small enterprises: with 10-49 persons employed;
- medium-sized enterprises: with 50-249 persons employed;
- the first three size classes aggregated: small and medium sized enterprises (SMEs): with 1-249 persons employed;
- large enterprises: with 250 or more persons employed.
Latest available size-class data (reference year 2009)
It is of the utmost importance to point out that statistics presented here are based on figures relating to the non-financial business economy. Deviating figures from other sources may result from different coverage of the economy or from different statistical units used. The delay in providing figures for reference years is a result from the availability of necessary source data from national administrative sources, national legal provisions, and data checking and aggregation by Eurostat. As a general rule, and as foreseen in the legal basis for structural business statistics, final data are to be transmitted 18 months after the end of the reference year. That means that it is not currently possible to publish any data on reference year 2010 before July 2012 (plus the necessary time for data treatment at Eurostat – a matter of weeks). Some data are available as preliminary data, with a lesser quality and subject to revision.
Additional data from specific surveys
Some additional data on SMEs may be derived from specific surveys. To shed light on SMEs' access to finance Eurostat, in consultation with its users for business statistics, the OECD, EIF and the ECB, has organised a business survey in 2010 to obtain information on the access to various types and source of finance of small and medium-sized enterprises (10 to 250 employees). That survey allowed a breakdown of SMEs in the size band 10-249 employees into high-growth firms (with 20 % averaged annualised employment growth over 3 years) and gazelles, the politically interesting young (3 to 5 years old) high-growth firms. Figures of the number of those subpopulations and their employment are provided in Table 3 (in this table growth by employment was used).
See also
- Access to finance statistics
- Business demography statistics
- Business economy - size class analysis
- Entrepreneurship indicators
- Structural business statistics - theme navigation page
- Structural business statistics introduced - background article
Further Eurostat information
Publications
- Enterprises by size class - overview of SMEs in the EU - Statistics in focus 31/2008
- Eurostat-OECD Manual on Business Demography Statistics
- Key figures on European business - with a special feature on SMEs - Pocketbook 2011
- SMEs were the main drivers of economic growth between 2004 and 2006 - Statistics in focus 71/2009
Main tables
- SBS - main indicators (t_sbs_na)
Database
- SBS - main indicators (sbs_na)
- Annual enterprise statistics for special aggregates of activities (NACE Rev.2) (sbs_na_sca_r2)
- SBS - industry and construction (sbs_ind_co)
- Annual detailed enterprise statistics - industry and construction (sbs_na_ind)
- SMEs - Annual enterprise statistics by size class - industry and construction (sbs_sc_ind_r2 and sbs_sc_con_r2)
- SBS - trade (sbs_dt)
- SMEs - Annual enterprise statistics by size class - trade (sbs_sc_dt)
- SBS - services (serv)
- Annual detailed enterprise statistics - services (sbs_na_serv)
- SMEs - Annual enterprise statistics by size class - services (sbs_sc_sc)
Dedicated section
Dedicated section on SBS with a description of the objectives and coverage, and all ancillary projects :
Other information
- 2008 SME data from the latest pocketbook:Size class analysis for 2008 reference year
- Commission Recommendation of 6 May 2003 concerning the definition of micro, small and medium-sized enterprises
External links
- Sections of importance to SME policies :
Notes
- ↑ Using tighter restrictions (having existed since 2004, still active in 2010), the resulting number of enterprises is not comparable to the size class results from structural business statistics (SBS).
- ↑ All enterprises up to 5 years old with average annualised growth greater than 20 % per year, over a three-year period, should be considered as gazelles; gazelles are the subset of high-growth enterprises which are up to five years old.
- ↑ All enterprises with average annualised growth greater than 20 % per year, over a three-year period should be considered as high-growth enterprises; growth can be measured by the number of employees or by turnover.


