Archive:Quality of life in Europe - facts and views - leisure and social relations
This article has been archived. The paper format and the PDF format latest edition, ISBN 978-92-79-43616-1, doi:10.2785/59737, Cat. No KS-05-14-073-EN-N are still available. For updated information on quality of life, see the online publication Quality of life indicators - leisure and social interactions.

Source: Eurostat (nama_co3_c)

Source: Eurostat (nama_co3_c)

Source: Eurostat (nama_co3_c)
Source: Eurostat (ilc_pw01)

Source: Eurostat (ilc_pw01)

Source: Eurostat (ilc_pw01)

Source: Eurostat (ilc_pw01) and (ilc_pw05)

Source: Eurostat (EU SILC)

Source: Eurostat (EU SILC)
Source: Eurostat (EU SILC)
Source: Eurostat (ilc_pw01) and (ilc_pw05)

Source: Eurostat (EU SILC)

Source: Eurostat (lfsa_ewhuis) and (ilc_pw01)
Source: Eurostat (nama_co3_c) and (ilc_pw01)
Source: Eurostat (ilc_pw06)
Source: Eurostat (EU SILC)

Source: Eurostat (ilc_pw01)

Source: Eurostat (ilc_pw01) and (ilc_pw05)
Source: Eurostat (ilc_pw01) and (ilc_pw05)

Source: Eurostat (ilc_pw01) and (ilc_pw05)

Source: Eurostat (EU SILC)
Source: Eurostat (EU SILC)

Source: Eurostat (EU SILC)

Source: Eurostat (ilc_pw01) and (ilc_pw05)

Source: Eurostat (EU SILC)
Source: Eurostat (EU SILC)
Source: Eurostat (EU SILC)
This article on leisure and social interactions is the fifth in a series of nine articles forming the publication Quality of life in Europe - facts and views. The articles take an innovative approach and use data on subjective evaluations of different domains, collected for the first time in European official statistics. This article is split into two main parts, focusing first on leisure and second on social interactions.
In the first part, the analysis examines first the contextual situation of time use in the European Union (EU), by looking at the extent to which EU residents participate in recreational and cultural activities (measured through their spending on this type of goods and services). It then explores how satisfied people are with their time use, studying also the differences between socio-demographic groups such as age categories, gender, income terciles, household types, labour statuses, occupational categories and education levels. This evaluation is followed by an examination of the potential link between, on the one hand, working time and expenditure on recreation and culture (as a proxy for participation in this kind of activities) and, on the other hand, satisfaction with time use at country level.
The second part focuses on social interactions, starting with an analysis of people’s ability to benefit from support from others when needed. Satisfaction with personal relationships is then examined, including by different socio-demographic characteristics which may have an influence on it. The last part considers the possible association between the ability to get help from others when needed or to discuss personal matters, and satisfaction with personal relationships[1].
Main statistical findings
Leisure and social interactions in a quality of life perspective
Leisure and satisfaction with time use
Being able to benefit from leisure activities is expected to be associated with life satisfaction, and so does enjoying balanced and satisfactory time use (See article 9 Overall life satisfaction).The residents of the EU devoted about EUR 1 300 or 8.5 % of household expenditure to recreation and culture in 2012, highlighting the importance attached to these. This was EUR 1 200 in 2005, or 9.3 % of total household budget highlighting a small decrease in the percentage over the last years.
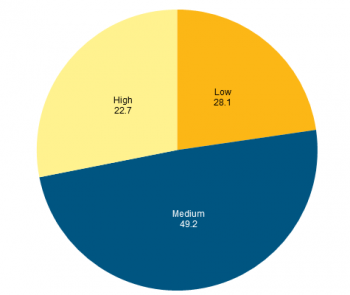
Available figures indicate that in 2013 almost half of the population (49.2 %) reported a medium satisfaction level with its time use, one fourth (28.1 %) a low satisfaction level and another fourth (22.7 %) a high satisfaction. On a scale from 0 to 10 (where 0 corresponds to the lowest and 10 to the highest grade of satisfaction[2]) this represented a mean satisfaction of 6.7, the second lowest rating registered across all of the well-being domains (satisfaction with financial situation being the lowest, at 6.0). Satisfaction with time use is strongly associated with age, the younger and older age groups reporting the highest means (between 7.2 and 7.6). The gender effect is minor, with a mean satisfaction at 6.8 for men and 6.7 for women. The people who were best-off in terms of income or education were equally or less satisfied with their time use.
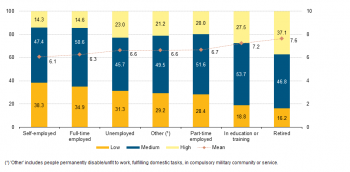
Due to the different time availability it grants, the labour status has an impact on satisfaction with time use. Hence, retired people, those in training or education and part-time employees reported a greater satisfaction level (7.6 to 6.6) with time use than full-time and self-employed persons (6.3 and 6.1 respectively). High shares of time spent on leisure (as a percentage of the total expenditure) and low average weekly working time were associated with a more positive average assessment of time use in some EU Member States, while in others the link was more loose.
Social interactions and satisfaction with personal relationships
Having rewarding social relationships and having someone to rely on in case of need or to discuss personal matters, also enhances overall life satisfaction: hence, 40.8 % of people who declared having social support in case of need reported high levels of life satisfaction; the share was 18.6 % amongst those who did not[3]. Nonetheless, on average 6.7 % of residents reported not being able to get such support, a share which exceeded 10 % in several EU Member States. This lack of support was more prevalent amongst migrants, especially for those coming from outside the EU borders.
A majority of EU residents (49.2 %) reported a medium level of satisfaction with their personal relationships; low satisfaction was reported by 11.7 % and high satisfaction by 39.1 %. This represents a mean satisfaction level of 7.8, the highest rating of a well-being domain. As could be observed with time use, satisfaction with relationships and age were slightly related. The mean satisfaction level with one’s personal relationships was highest amongst the younger generations (16–24 years and 25–34 years) and also amongst people older than 65, with a mean close to or exceeding 8.0. The gender effect was negligible, with men less satisfied than women by a mere 0.1 point (7.8 versus 7.9). Belonging to the third, richest, income tercile engenders a slightly higher satisfaction on average (mean at 7.6, 7.9 and 8.0 in the first, second and third resp. category of income) in the same way as being a tertiary graduate (mean at 7.6, 7.9 and 8.0 in the first, second and third category resp. of educational attainment).
The effects of supportive relationships and the level of trust in others on satisfaction with personal relationships are clear. With a mean at 7.9, people who could count on others for help when needed and who have someone to discuss personal matters with were much more satisfied with their relationships than those who could not (with an average at 6.3–6.4). Moreover, people who have little trust in others reported a mean satisfaction at 7.0, versus 7.7 amongst those with a medium trust in others and 8.3 amongst those with a high trust level.
Leisure in the European Union
Participation in recreational and cultural activities is expected to contribute to an individual’s well-being and overall life satisfaction[4]. Culture and entertainment are important activities which EU residents did not seem to abandon so easily when they had to make important spending reductions[5], although price is the second main barrier in access to culture, after lack of time[6]. The section below analyses the weight of recreational and cultural activities in the final consumption expenditure of EU residents, as a proxy indicator for participation in leisure activities.
Spending on recreational and cultural activities in total household expenditure has decreased
Figure 1 presents the evolution over time of household expenditure on recreation and culture. Since 2005, while total household expenditure increased by 14.1 %[7], reaching EUR 14 600 per inhabitant in 2012, the portion spent on recreation and culture[8], EUR 1 300, only grew by 8.3 %. In 2012, it was making up 8.7 % of the total final consumption expenditure of households; compared with 9.3 % in 2005 and 9.1 % in 2008, reflecting a continuous drop over the period considered. Recreation and culture played a non-negligible role in the daily life of individuals, by occupying the fourth place in the household budget, after constrained expenses such as housing, water, electricity, gas and other fuels (24.1 %), transport and food and non-alcoholic beverages, both at 13.0 % in 2012[9].
In 2012, the main part of a household’s recreation and culture budget was devoted to recreational and cultural services (37.9 %), followed by other recreational items and equipment, gardens and pets (21.8 %), audio-visual, photographic and information processing equipment 16.1 %), newspapers, books and stationery (13.8 %). Package holidays made up 6.9 % of the total budget and other major durables 3.4 %. At EUR 500 per capita in 2012 against EUR 400 in 2005, recreational and cultural services[10] nonetheless constituted a minor share of total consumption expenditure in 2012 (3.3 % versus 3.1 % in 2005).
Access to culture, tends more and more to be recognised as a basic right, in the same way as education, health and other fundamental rights. The 1948 Universal Declaration of Human Rights does not call for the recognition of this right as such but stipulates in its Article 27 that everyone has the right to freely participate in the cultural life of the community, to enjoy the arts and to share in scientific advancement and its benefits. However, this participation is not universal and varied by EU Member State, as shown in Figure 3.
In 2012, the population in Luxembourg spent the smallest share of its household budget on recreational and cultural activities (1.8 %, identical to 2005), followed by Lithuania at 2.0 % (against 2.3 % in 2005). The biggest shares were spent in Malta and Cyprus, at respectively 5.3 % and 5.2 %. This represented an increase since 2005 when the shares were respectively 4.7 % and 4.8 %. Apart from these two exceptions, it was generally the households in northern EU Member States (Sweden, Finland and Denmark) and Austria that devoted the greatest proportions of their budgets on recreational and cultural activities, at around 4.0 % of total household expenditure. Almost all EU Member States experienced a downward trend or a slight increase (below 1.0 %) since 2005, ranging from – 1.2 percentage points in Estonia to + 0.9 percentage points in Poland. The only EU Member State not to follow this pattern was Romania which recorded a 1.6 percentage point growth on expenditure for recreational and cultural activities.
This indicator is expressed in relative terms as a percentage of the total and may therefore be influenced by factors like price variations, including for other consumption items (housing, food and so on), but also the availability of cultural goods and services (the supply side). This aspect is important to keep in mind when making cross-country comparisons.
In absolute terms, available figures for 2012 show that most eastern EU Member States and the Netherlands, were spending less on recreational and cultural activities, as opposed to most northern, western and southern EU Member States. On average, every Swedish citizen spent EUR 900 on such activities in 2012, versus EUR 100 in Bulgaria, Lithuania and Romania.
Overall satisfaction with time use
By being able to engage in recreational and cultural activities, and spending time on one’s own areas of interest, a balanced and satisfactory use of time is expected to contribute to an individual’s overall life satisfaction. Time use may encompass all types of activities, whether related to work or not. This may, on the one hand, consist of paid and unpaid work and commuting time but also domestic labour, including caring for children, cooking/housework, and caring for elderly or disabled people, and, on the other hand, engaging in social or cultural activities, in physical or sports activities, volunteering, political activities, using the internet, attending religious services, etc.
Time use
Time use refers to the respondent’s opinion/feeling. The respondent should make a broad, reflective appraisal of all areas of his/her time use in a particular point in time (current). By default, the things the respondent likes doing are essentially a self-defined and a self-perceived concept.
In the EU as a whole, a majority of residents (49.2 %) reported in 2013 medium satisfaction with their time use; 28.1 % declared low satisfaction and 22.7 % high satisfaction with it (Figure 4). On a scale of 0 to 10 (where 0 corresponds to the lowest and 10 to the highest grade of satisfaction[11] this represented a mean satisfaction of 6.7, the second lowest rating registered across all of the life domains for which satisfaction was measured on the same scale[12].
Among the EU population, 23 % reported a high satisfaction with their time use in 2013.
As shown in Figure 5, the gap between the least and most satisfied population in the EU Member States was 2.1 points rating, the same as for job satisfaction and meaning of life, and the lowest compared with all other satisfaction items[13]. Hence, with the lowest mean across all EU Member States, Bulgaria (5.7), appears at the left end of the scale, while Denmark occupies the right end, with a mean at 7.8, just after Finland at 7.7. These EU Member States recorded the highest shares of people with a high satisfaction with their time use and some of the lowest shares of people with a low satisfaction. They also tended to report the most positively on overall life satisfaction[14]. The Netherlands, which was the next most positive, displays a very specific pattern, where the high mean (7.5) is to be ascribed to a considerable proportion of residents with a medium satisfaction (75.2 %) and a very modest share of residents with a low satisfaction (5.9 %).
Satisfaction with time use by different socio-demographic characteristics
How is the socio-demographic background associated to satisfaction with time use?
The next section examines how the level of satisfaction of EU residents with their time use varies for different socio-demographic groups such as age categories, sex, income terciles and other.
Satisfaction with time use was highest amongst the younger and older populations
As Figure 6 shows, satisfaction with time use was strongly associated with age. The older age groups (65 +) were the most satisfied, with a mean satisfaction of 7.5–7.6, followed by the youngest (16–24-year-olds), rating on average their satisfaction at 7.2, in 2013. There could be several influencing factors behind these differentials across age groups. For the younger (16–24) and elderly (as from 65), the amount of free time could be a positive factor for the time use satisfaction, as they are not yet or no longer at work, and do not have dependent children either. The working age population, meaning those aged 50–64 (6.7), and even more those aged 25–34 (6.3) and 35–49 (6.2) had the lowest average satisfaction with time use. In particular for the last two age groups, high amounts of unpaid work (spent on childcare and housework) and sometimes less financial resources could reduce their opportunities to engage in cultural or social/leisure activities, hence decreasing their satisfaction with time use. Amongst the active age groups, those being 50–64 recorded a higher mean, probably thanks to a better established career and less childcare responsibilities that granted a higher budget of both money and time for ‘recreational’ activities.
Modest gender effect on satisfaction with time use
Figure 7 indicates a very slight gender effect on satisfaction with time use, with a mean at 6.8 for men and 6.7 for women. The explanation might be that although women were more often working part-time than men[15], unpaid work, linked to time spent on household duties and caring for children, was still to a large extent undertaken by them. This so-called ‘double shift’ tends to limit their free time[16], explaining their slightly higher share of reported low satisfaction (28.7 % versus 27.5 % for men).
The income situation had a minor impact on satisfaction with time use
As can be seen in Figure 8, the relation between income level (measured through the income tercile a person belongs to on the basis of the distribution at the country level) and satisfaction was quite limited.
Having a better financial situation did not grant people a distinctively higher satisfaction with their time use. People in the top tercile averaged 6.8, the same as those in the second tercile and only slightly higher than those in the bottom one, with a mean of 6.6. Major differences were seen in the uneven distribution of people with a low satisfaction level, who were less present amongst those in the top tercile (26.6 %), than amongst those in the bottom tercile (30.4 %).
There were important differences in income levels at country level (See article 1 Material living conditions) and the way in which they translated into satisfaction with time use.
Older households without children were the most satisfied with their time use
Figure 9 shows that the older households that have most probably exited the labour market and do not have dependent children either, had the highest mean satisfaction with their time use, at 7.7 for both single men and women aged over 65 and 7.5 for two adults of the same age group. At the other end of the scale, households with children, whatever their composition, were the least satisfied, with means comprised between 6.1 and 6.3. The least satisfied in 2013 were single parents, who were under high time pressure. In between, younger households without children had an average satisfaction with time use of about 6.7–6.8.
Satisfaction with time use varied depending on the labour status
Figure 10 highlights quite distinct satisfaction patterns across classes of labour status.
In terms of time availability, retired people, those in training or education, part-time employees and the unemployed had a greater satisfaction with time use than people in the other two categories (i.e. full-time employees and self-employed persons). The lack of childcare responsibilities probably also played a role, as retirees and students had a higher satisfaction with time use than the unemployed and part-time employees.
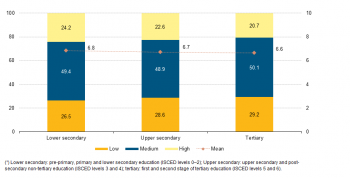
The effect of education on satisfaction with time use was weak
There was a weak connection between educational attainment and satisfaction with time use as indicated in Figure 11. With a mean of 6.8, the least educated were more satisfied with their time use than people in the groups of more educated people (6.7 amongst upper secondary and 6.6 amongst tertiary education holders). This finding was a bit unexpected. Education being related to income levels, it was however also associated with more demanding jobs, involving higher levels of responsibilities, leaving little time for private life and entertainment for the workers concerned.
This pattern was mirrored in the levels of satisfaction with time use recorded. Hence, the highest share of people with a low satisfaction and the smallest share of people with a high satisfaction were found amongst the tertiary graduates. This pattern was reversed for the people with lower levels of education.
How do some factors influence satisfaction with time use?
This section analyses how satisfaction with time use may vary at country level in parallel with the average amount of time which EU residents usually spend at work in a week[17] and the budget they devote to leisure as a percentage of the total[18].
Available figures show that, in 2013, EU residents did not rate their time use very positively, at 6.7 (see Figures 4 and 5), which was one of the lowest ratings amongst all satisfaction items. They were working on average 37.2 hours a week in their main job; persons in employment in the Netherlands had the shortest working hours (30.0 hours), while in Greece they were the longest (42.0 hours). The EU Member State in which households spent the largest part of their 2012 budget on recreational and cultural services were Malta (5.3 % of total household expenditure) which was about three times as much as in Luxembourg (1.8 %, the lowest).
The analysis below will show that EU Member States registering the highest shares of spending on leisure and the lowest working time did not systematically report the most positively on time use although there was a link between these two items and satisfaction with this domain.
Although these factors certainly played a role, other determining factors were cultural attitudes and traditions or the socio-economic context, which translate into higher or lower propensities to devote time (and money) on and to participate in out-of-work activities, hence influencing the degree of satisfaction with time use.
Working time had a decreasing impact on average satisfaction with time use at country level
The average number of weekly hours spent at work impacted on the balance between work and private life and the amount of free time granted to workers, hence their opportunities for leisure activities, whichever they may be. Figure 12 indicates a clear link between satisfaction with time use and working time, which seems to have a declining effect on satisfaction. This type of link between the two items was the most visible in EU Member States such as Hungary, Portugal, Spain, Malta and Ireland (as well as Switzerland and Norway), which were almost aligned on a straight line passing through the EU average and joining the Netherlands and Greece. These last two EU Member States registered the highest and lowest numbers of usual working hours per week (30.0 versus 42.0 hours). Denmark, which surpassed the Netherlands on working time (33.6 hours per week), also exceeded it on satisfaction with time use (7.8, the highest rating). Although working a bit less than the Greek residents (40.7 hours), Bulgarian residents tended to be less satisfied (5.7 mean, the lowest).
In the other EU Member States, the connection can be observed as well albeit with diverse impacts of working time on satisfaction.
Loose relationship between spending on recreation and culture as a percentage of the total expenditure and satisfaction with time use
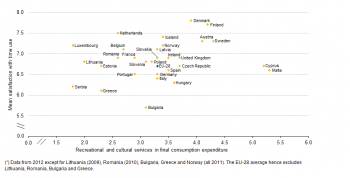
Household expenditure on leisure is expected to reflect cultural attitudes, the availability (supply) of leisure and cultural events, their price and the capacity to afford such spending in one’s household budget. As it is a relative indicator (a percentage of the total spending,) it may be also be influenced by prices of other consumption items, especially amongst the constrained ones (housing and food).
As shown in Figure 13, satisfaction with time use and spending on recreation and culture are not closely associated. EU Member States whose residents spent most on such budget items, such as Finland (4.2 %) and Denmark (3.9 %), also recorded the highest mean ratings of satisfaction with time use (7.7 and 7.8). The opposite was true in Bulgaria and Greece, where households were not devoting more than 3.1 % of their budget on recreation and where the average satisfaction with time use was the most modest, at 5.7 and 6.1 respectively. Several EU Member States were not following this pattern and no clear link could be established between the two items. This was the case for Luxembourg, whose residents were quite satisfied with their time use (7.2) despite spending the most moderately on leisure (1.8 %), and the Netherlands where a mere 2.6 % of the household budget was allocated to leisure but residents reported to be highly satisfied with time use (7.5 mean, one of the highest). Households in Cyprus and Malta, on the contrary, devoted quite an important proportion of their budget to leisure (over 5.0 %), but reported comparatively less positively on satisfaction with time use (with a mean of around 6.6–6.7).
Most other EU Member States showed a rather loose association between the two items. Several of them, such as Lithuania, Estonia, Romania, France and Belgium, reported more positively on satisfaction (with means comprised between 6.7 and 7.1) than what their households spent on leisure would potentially suggest (less than 3.0 % of their budget). In Hungary, where households had a higher share of leisure expenditure (3.6 %) than in the aforementioned EU Member States, residents rated their satisfaction with time use at only 6.3.
Social interactions in the European Union
Social interactions are essential elements for an individual’s well-being. Having more time to spend on social interactions (and leisure activities) is amongst the strongest drivers of well-being[19]. Similarly, strong family bonds and social relationships (as well as being married) can protect against having a physical or mental health problem, illness or disability[20]. Having relatives, friends or neighbours able to provide moral or other types of support enhances overall life satisfaction[21]: about twice the proportion of people who can receive such support, reported high levels of life satisfaction compared with those who cannot. The section below will look at the ability of EU residents to rely on someone when they need help (social support).
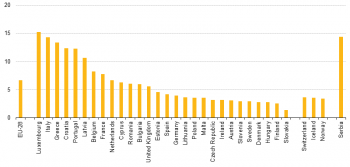
Most EU residents reported that they could count on relatives, friends or neighbours in case of need in 2013. As illustrated in Figure 14, 6.7 % of the EU population declared not being able to rely on supportive relationships and a majority of EU Member States recorded shares below that level.
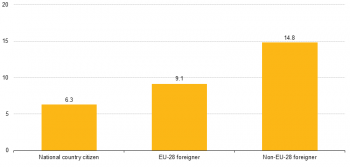
Even so, in a few EU Member States more than 10 % of the population declared not to have anyone to rely on in case of need (Latvia, Portugal, Croatia, Greece and Italy), a value that went up to 15 % in the case of Luxembourg. At the other end of the scale, Slovak and Finnish residents reported a widespread access to support (98.6 % and 97.5 % respectively). The reasons for these important gaps between EU Member States were probably more related to cultural factors or the structures of the population and the households than to economic factors such as income (Figure 20). The lack of social support was more prevalent amongst migrants, especially those coming from outside the EU. Hence, 6.3 % of national residents reported not having anyone to rely on in case of need, versus 9.1 % for foreigners coming from another EU Member State and 14.8 % for the non-EU foreigners (Figure 15).
Overall satisfaction with personal relationships
Social interactions contribute greatly to an individual’s well-being and overall life satisfaction In the EU as a whole, a majority of residents (49.2 %) reported a medium level of satisfaction with their personal relationships; 11.7 % declared to have a low level of satisfaction and 39.1 % a high level of satisfaction (Figure 16). On a scale of 0 to 10 (where 0 corresponds to the lowest and 10 to the highest grade of satisfaction[22]), this represents a mean satisfaction of 7.8, the highest rating registered across all of the life domains for which satisfaction is being measured on the same scale.
Personal relationships corresponded to the quality of life domain where EU residents reported on average the highest satisfaction level in 2013, namely 7.8 on a scale of 0 to 10.
A cross-country analysis illustrated in Figure 17 shows that Bulgarian residents on average assessed the quality of their relationships the most negatively (with a mean of 5.7) while the Irish assessed it the most positively (with a mean of 8.6). The Irish residents were followed very closely by the residents of Austria and Denmark, both at 8.5, and several other EU Member States from mainly eastern and northern parts of the EU, all at 8.0 or more. Bulgaria was also the country which appeared at the lower end of the scale on overall life satisfaction whereas the opposite was true for Austria and Denmark.
Satisfaction with personal relationships by different socio-demographic characteristics
How was the socio-demographic background associated to satisfaction with personal relationships?
The next section examines how the level of satisfaction with personal relationships of EU residents varied for different socio-demographic groups such as age categories, sex, income terciles and others.
The younger and older populations were the most satisfied with relationships
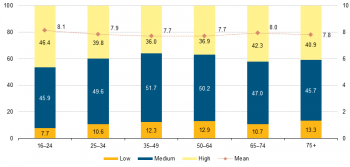
Figure 18 shows that, satisfaction with relationships and age were strongly linked. The average degree of satisfaction with one’s personal relationships was highest amongst the younger generations (aged 16–24 and 25–34) with mean ratings of 8.1 and 7.9 respectively and amongst those aged over 65, with a mean rating of 8.0 (which declined to 7.8 as from the age of 75). In between, the working age population (aged 35–64, who often had dependent children registered a mean satisfaction of 7.7, which was lower than for the younger and older age groups. These two intermediate age groups (35–49 and 50–64), by spending a lot of time on the development of their career and on childcare, probably tended to have fewer opportunities to develop personal relationships outside the work and close family spheres, which might explain their slightly reduced satisfaction compared with the younger and older generations.
At EU level, 46 % of the young people aged 16–24 and 42 % of the people aged 65–74 were highly satisfied with their personal relationships in 2013.
Slight gender effect on satisfaction with personal relationships
Figure 19 indicates a slight gender effect on satisfaction. Men’s mean satisfaction with personal relationships stood at 7.8 while women’s stood at 7.9. The slightly higher values for women, who were more satisfied with their personal relationships than men (40.5 % compared with 37.6 %), might have been related to a potentially higher investment in this area of their life.
Limited impact of income on satisfaction with personal relationships
As can be seen in Figure 20, the relation between income level (measured through the income tercile that the person belongs to on the basis of the distribution at the country level) and satisfaction was slightly stronger for personal relationships than for time use, although it remained quite limited. With a mean of 8.0, people in the top tercile were more satisfied with their relationships than people in the lowest and second tercile (by 0.4 and 0.1 points respectively). This is reflected in the shares of people reporting a low satisfaction which was 8.1 % in the highest tercile, against 10.6 % in the second tercile and 15.9 % in the lowest. These differences may be due to the fact that lower income renders maintaining social relations more difficult to a certain extent. The income levels associated with the terciles vary quite a lot across EU Member States.
Two-adult households are the most satisfied with their personal relations
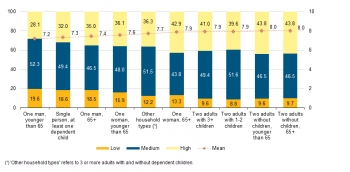
As highlighted in Figure 21 people who did not live in a one-person household reported a higher satisfaction with personal relationships than those who did.
Households consisting of two adults without children were slightly more satisfied with their personal relationships than couples with children (respectively 8.0 and 7.9 mean rating), but the difference was very small and the proportion of people with a low level of satisfaction was similar, even slightly lower for two adults with 1–2 children. Living in a two-adult household was associated with a higher satisfaction with personal relations, as opposed to living alone.
All one-person households, except older single women, were less satisfied with personal relations, with a mean rating between 7.2 for men under 65 years old and 7.6 for younger women living in a one-person household. What is important to note for one-person households is that men living by themselves were less satisfied with their personal relations than women in the same age group, and that those older than 65 were more satisfied than younger people of the same sex. Consequently, single women aged over 65 recorded the same average as couples with children (7.9). However, low levels of satisfaction were significantly more prominent amongst older women living by themselves compared with couples who had children (13.3 % versus 8.8 % and 9.6 %).
The labour status has a quite distinct impact on satisfaction with personal relationships
Figure 22 highlights quite distinct satisfaction patterns across classes of labour status. The unemployed, who are often also socially excluded, reported the lowest average satisfaction with their relationships, at 7.3. They were followed by the self-employed at 7.7. The self-employed were quite often managing one-person enterprises, hence working on their own; moreover, they had a greater share of working time performed outside usual working hours, hence limiting their social and private life.
The next two categories consisted of full-time employed and retired people, both with a mean rating of 7.9. The higher rating of the full-time employed could be the result of their ability to build a network of interesting relationships through their work sphere, on the one hand, and on the other hand, to be socially-included in civil society through their job and income. For the retired, it may be their greater time availability that allows them to pursuit opportunities to develop and maintain personal relationships.
At the end of the scale, students and people in training (who do not participate in the labour market) appeared to have a slightly higher level of satisfaction than people working part-time.
Slight effect of education on satisfaction
A clear relation between educational attainment and satisfaction with one’s personal relationships can be observed in Figure 23, although the effect is rather small.
The population with the lowest level of education level reported a mean satisfaction with their personal relationships at 7.6, which was 0.3 points less than for people with upper secondary and 0.4 points less than for those with tertiary education. This pattern was also reflected in the low and high levels of satisfaction with relationships recorded: only 8.5 % of the tertiary educated reported a low level of satisfaction with their personal relationships (as opposed to 14.3 % for those with the lowest level of education) and as many as 41.7 % of them reported a high satisfaction.
Social interactions and satisfaction with personal relationships
How was social support associated with satisfaction with personal relations?
The section below analyses how social interactions may translate to degrees of satisfaction of an individual with their personal relationships. Such interactions may take the form of the ability to get help from others, whether relatives, friends or neighbours, to talk with them about personal matters, or the trust one may place in others in general.
Satisfaction with personal relationships related strongly to the ability to ask for help from others…
In 2013 about 93.3 % of EU residents reported being able to ask for help from others whereas 6.7 % reported not being able to do so (see Figure 15). This ability clearly influenced their level of satisfaction with their personal relationships which reached an average of 6.4 amongst those who could not benefit from this help and 7.9 amongst those who could, as illustrated in Figure 24 below. The shares of people reporting a low or high level of satisfaction reflect this pattern. Indeed, 32.8 % of those who could not get help declared to have a low satisfaction, which is three times as much as amongst those who could (9.9 %). For high satisfaction, it was 18.6 % for the former versus 40.8 % for the latter.
…and with the possibility of having someone to discuss personal matters
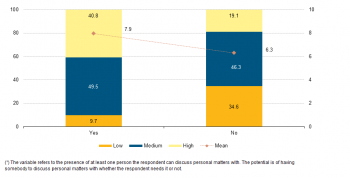
More than nine out of ten EU residents (92.9 %) reported having someone with whom they can discuss with about personal matters. Against this background, the lack of supportive relationships — in the same way as what could be observed for the ability to ask for help — again seemed to translate negatively into people’s satisfaction with their personal relationships, as those who did not have someone with whom they could discuss personal matters reported a mean satisfaction of just 6.3 (as opposed to 7.9 for those who did).
This finding is mirrored in the distribution of low and high levels of satisfaction. Furthermore, among those who did not have someone with whom to discuss personal matters, 34.6 % declared a low level of satisfaction with personal relationships, which was three times higher than the corresponding rate (9.7 %). of those who did. The latter were also twice as likely to report a high satisfaction level compared with the former (40.8 % versus 19.1 %).
Satisfaction with personal relationships increased in parallel with trust in others
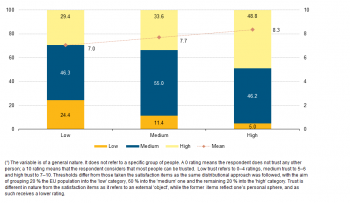
Figure 26 indicates that satisfaction with personal relationships increased together with trust in others. People who, for objective or subjective reasons, had little trust in others were also much less satisfied with their relationships. Their mean relationship satisfaction was 7.0, as compared with 7.7 amongst those who had a medium trust in others and 8.3 amongst those who tended to trust them fully. This was even more evident when analysing the share of people with a low level of satisfaction, which varied from 5.0 % for those with a high level of trust in others to 24.4 % for those with a low level of trust.
Data sources and availability
An ad-hoc module on subjective well-being was implemented in the EU-SILC 2013. This module contains subjective questions (e.g. How satisfied are you with your life these days?) which complement the mostly objective indicators from existing data collections and social surveys.
The "GDP and beyond" communication, the SSF Commission recommendations, the Sponsorship on measuring progress, and the Sofia memorandum all underlined the importance of collecting high quality data about people's quality of life and well-being and the central role that statistics on income and living conditions (SILC) have to play in this improved measurement. The collection of micro data related to well-being therefore is a key objective. In May 2010 both the Living Conditions Working Group and the Indicators Sub-Group of the Social Protection Committee supported Eurostat's proposal to collect micro data related to well-being within the 2013 module of SILC in order to better respond to this request.
For more information please visit: Eurostat - GDP and beyond - Quality of life
Indicators to measure leisure and social interactions
Leisure has both a quantitative aspect (i.e. the mere availability of time that we can spend on activities we like) and a qualitative one: access to these activities is as important as the time we have to devote to them. Social interactions, i.e. interpersonal activities and relationships, apart from satisfying a primeval human need for existence in a social milieu (loneliness being a factor that is detrimental to quality of life), also constitute a ‘social capital’ for individuals. However, there is more to quality of life than mere satisfaction derived from social interactions with friends, relatives and colleagues and engaging in activities with people. The quality of social interactions also encompasses our need to engage in activities for people, the existence of supportive relationships, interpersonal trust, the absence of tensions and social cohesion.
The leisure sub-dimension within the quality of life framework covers the quantitative and qualitative aspects of leisure, as well as access assessment. Data used in this article are primarily derived from the EU-SILC survey. Carried out annually, it is the main survey that assesses income and living conditions in Europe, and the main source of information used to link different aspects of quality of life at household and individual level:
- Quantity of leisure concerns the availability of time and its use (including personal care), including satisfaction of people with the amount of time they have to do things they like (a satisfaction with time use indicator was included in SILC 2013 ad-hoc module).
- Quality of and access to leisure are measured for the moment with indicators on self-reported attendance of leisure activities that people are interested in, for example cinema, theatre or cultural centres. Other indicators on the topic are to be collected in the SILC 2015 ad-hoc module.
The social interactions topic focuses on activities with people, activities for people, supportive relationships and social cohesion, using indicators collected as part of the EU-SILC 2013 and 2015 ad-hoc modules on subjective well-being and social and cultural participation:
- Activities with people (including feeling lonely) are measured in terms of the frequency of contacting, meeting socially/getting together with friends, relatives or colleagues (SILC 2006/2015 ad-hoc module) and satisfaction with personal relationships (collected in SILC 2013 ad-hoc module).
- Activities for people concern involvement in voluntary and charitable activities, excluding paid work (SILC 2006 ad-hoc module, which will be repeated in 2015).
- Assessment of the existence of supportive relationships is based on the proportion of people indicating that they have someone to rely on for help in case of need (data available from SILC 2006 ad-hoc module, and repeated in the 2013 and 2015 ad-hoc modules) and to discuss on personal matters (collected in SILC 2013 and 2015 ad-hoc modules).
- Social cohesion (covering interpersonal trust, perceived tensions and inequalities) is measured using an indicator on trust in others (collected in 2013 ad-hoc module)).
Data used in this article for the indicators on satisfaction with time use, satisfaction with personal relationships, supportive relationships and trust in others derive almost exclusively from the 2013 ad-hoc module.
Data on final consumption expenditure (including for recreation and culture) comes from National accounts (nama_co3_c).
Context
A social life, in which people can enjoy a balance between work and private interests, spending sufficient time on leisure and social interactions, is highly associated with life satisfaction[23]. Being able to engage in social activities is important for an individual’s psychological balance, hence well-being. Having someone to rely on in case of need was chosen as a headline indicator for the United Nations World Happiness report, highlighting its importance for an individual’s well-being.
Current times are marked by economic difficulties and while ensuring the sustainability of public finances is a goal of EU policies, individuals are facing hardships to make ends meet and political disinterest seems to be gaining ground. In this context, social support is extremely relevant, and examining how the residents of the EU participate in recreation and culture and assess their personal relationships, provides important complementary information regarding other determining factors of well-being.
EU policies related to leisure and social interactions
Our subjective perception of well-being, happiness and life satisfaction is fundamentally influenced by our ability to engage in and spend time on the activities we like. The importance attributed by modern societies to recreational and cultural activities and work-life balance underlines the role leisure and social interactions play in quality of life. This importance is reflected in family-friendly policies which the EU is developing to remedy ‘work and family imbalance’[24]. One example is the EU working time directive[25] which aims to guarantee that working hours meet minimum standards applicable to all workers throughout the EU (in respect of, among others, weekly rest, annual leave and aspects of night work). The EU is also financing projects focussing on work-life balance in families and for working women, as well as fostering family-friendly workplaces, engaging fathers and promoting the financial well-being of families[26].
Several EU policies have an impact on the quality and availability of leisure activities proposed to the public. The EU seeks to preserve Europe’s shared cultural heritage (Article 167 of the Treaty on European Union) — in language, literature, theatre, cinema, dance, broadcasting, art, architecture and handicrafts, and to help make it accessible to others with initiatives such as the Culture Programme. To this end, it has also developed policies on the audio-visual and media market, including the Audio-visual Media Services (AMS) Directive 2010/13, the Creative Europe framework programme on culture and media, as well as provisions for supporting public service broadcasting (Protocol No 29 of the Treaty on European Union). In 2011, the Commission adopted a strategy to develop the European dimension in sport.
See also
- All articles on living conditions and social protection
- Quality of life indicators (online publication)
Further Eurostat information
Main tables
- Income distribution and monetary poverty (t_ilc_ip)
- Monetary poverty (t_ilc_li)
- Monetary poverty for elderly people (t_ilc_pn)
- In-work poverty (t_ilc_iw)
- Distribution of income (t_ilc_di)
- Material deprivation (ilc_md)
- Material deprivation by dimension (t_ilc_mddd)
- Housing deprivation (t_ilc_mdho)
- Environment of the dwelling (t_ilc_mddw)
Database
- Income distribution and monetary poverty (ilc_ip)
- Monetary poverty (ilc_li)
- Monetary poverty for elderly people (ilc_pn)
- In-work poverty (ilc_iw)
- Distribution of income (ilc_di)
- EU-SILC ad hoc module (ilc_ahm)
- Living conditions and welfare (livcon)
- Consumption expenditure of private households (hbs)
Dedicated section
Methodology / Metadata
- Income and living conditions (ESMS metadata file — ilc_esms)
Source data for tables and figures and maps (MS Excel)
Notes
- ↑ Source data in aggregated format and graphs are available in Excel format through the online publication Quality of life: facts and views in Statistics Explained (Excel file clickable at the bottom of each article).
- ↑ Where 0 means not at all satisfied and 10 completely satisfied; low satisfaction refers to 0–5 ratings, medium satisfaction refers to 6-8 and high satisfaction to 9–10.
- ↑ In 2013, 93.3 % of EU residents declared being able to get help in case of need and 6.7 % declared not being able to do so.
- ↑ See European Commission, Eurofound, Quality of life in Europe, Subjective well-being, 3rd European quality of life survey (2013).
- ↑ The question asked to respondents was: Q4. If you had to reduce your spending on leisure activities when you were on holiday in 2009, on which kind of leisure activity did you make the most important reduction? Reference population: those who went on holiday or took a short trip in 2009, and not planning any other holiday or short trips in 2009, % EU-27. (The answers were: 38.0 % did not have to reduce spending, 23.0 % reduced spending on restaurants and cafés, 17.0 % on shopping, 9.0 % on cultural activities and entertainment, 4.0 % on beauty and wellness, 3.0 % on sport and other activities, 3.0 % on other and 3.0 % did not know). Source: Flash Eurobarometer 281, Europeans and tourism (2009). See also Eurostat, Cultural statistics (2014) p. 193.
- ↑ The question asked to respondents was: QA8: Sometimes people find it difficult to access culture or take part in cultural activities. Which of the following, if any, are the main barriers for you? (multiple choice). (‘Too expensive’ was answered by 29.0 % of respondents, preceded by ‘Lack of time at 42.0 %). Source: Flash Eurobarometer 67.1 (2007). See also Eurostat, Cultural statistics (2014), p. 149.
- ↑ Pushed by a sharp (25.0 %) growth of expenditure on housing, water, electricity, gas and other fuels over the period.
- ↑ Recreation and culture — 09: 09.1 — Audio-visual, photographic and information processing equipment; 09.2 — Other major durables for recreation and culture; 09.3 — Other recreational items and equipment, gardens and pets; 09.4 — Recreational and cultural services; 09.5 — Newspapers, books and stationery; 09.6 — Package holidays. See Classification of Individual Consumption According to Purpose (COICOP).
- ↑ Final consumption expenditure of households by consumption purpose — COICOP 3 digit — aggregates at current prices. Source: Eurostat (nama_co3_c).
- ↑ Recreational and cultural services includes: 09.4.1 — Recreational and sporting services (S), 09.4.2 — Cultural services (S) which includes: cinemas, theatres, opera houses, concert halls, music halls, circuses, sound and light shows; museums, libraries, art galleries, exhibitions; historic monuments, national parks, zoological and botanical gardens, aquaria; hire of equipment and accessories for culture, such as television sets, video cassettes, etc.; television and radio broadcasting, in particular licence fees for television equipment and subscriptions to television networks; services of photographers such as film developing, print processing, enlarging, portrait photography, wedding photography, etc. Includes: services of musicians, clowns, performers for private entertainments; 09.4.3 — Games of chance(s). See Classification of Individual Consumption According to Purpose (COICOP).
- ↑ Where 0 means not at all satisfied and 10 completely satisfied; low satisfaction refers to 0–5 ratings, medium satisfaction refers to 6–8 and high satisfaction to 9–10.
- ↑ Satisfaction with financial situation (6.0) being the lowest and satisfaction with personal relationships being rated the most positively (7.8) across all satisfaction items.
- ↑ At country level, the gap between the mean recorded by the least and most satisfied (total) populations reached 3.9 for satisfaction with financial situation and 3.2 for overall life satisfaction, satisfaction with recreational or green areas and satisfaction with living environment.
- ↑ See article 9 Overall life satisfaction.
- ↑ Around 9 % of men versus 32 % of women were part-time workers amongst total employment of the 15–64 age group. Source: Eurostat, EU-LFS (lfsq_eppga).
- ↑ EU-27 (2005). Source: Eurostat, Reconciliation between work, private and family life in the European Union (2009), p. 46; Eurofound, European Working Conditions Surveys — EWCS).
- ↑ The number of hours actually/usually worked in the main job during the reference week includes all hours including extra hours, either paid or unpaid, but excludes the travel time between home and the place of work as well as the main meal breaks (normally taken at midday). Persons who have also worked at home during the reference period are asked to include the number of hours they have worked at home. Apprentices, trainees and other persons in vocational training are asked to exclude the time spent in school or other special training centres. Employed persons are persons aged 15 and over who performed work, even for just one hour per week, for pay, profit or family gain during the reference week or were not at work but had a job or business from which they were temporarily absent because of, for instance, illness, holidays, industrial dispute, and education or training.
- ↑ Recreational and cultural services in total final consumption expenditure of households. Total final consumption expenditure is the sum of final consumption expenditure by all residential units. Final consumption expenditure (ESA95, 3.75–3.99) consists of expenditure incurred by residential institutional units on goods or services that are used for the direct satisfaction of the individual needs or wants or the collective needs of members of the community. Final consumption expenditure may take place on the domestic territory or abroad. In the system of national accounts, only the following sectors incur in final consumption: households, non-profit institutions serving households (NPISH) and general government. See Final consumption expenditure of households by consumption purpose — COICOP 3 digit — aggregates at current prices (nama_co3_c).
- ↑ See European Commission, Eurofound, Quality of life in Europe, Subjective well-being, 3rd European quality of life survey (2013), p. 78 and p.94.
- ↑ See previous footnote.
- ↑ See article 9 Overall life satisfaction.
- ↑ Where 0 means not at all satisfied and 10 completely satisfied; low satisfaction refers to 0–5 ratings, medium satisfaction refers to 6–8 and high satisfaction to 9–10.
- ↑ See European Commission, Eurofound, Quality of life in Europe, Subjective well-being, 3rd European quality of life survey (2013).
- ↑ See OECD, Between Paid and Unpaid Work: Family Friendly Policies and Gender Equality in Europe (2006), p. 10.
- ↑ Directive 2003/88/EC of the European Parliament and of the Council of 4 November 2003 concerning certain aspects of the organisation of working time.
- ↑ See European Platform for Investing in Children — Work-related Family Issues.