Archive:European Neighbourhood Policy - South - statistics on balance of payments and foreign direct investment
This Statistics Explained article has been archived. For more articles on non-EU countries, please see the following page: Non-EU countries
Data extracted in February 2020.
Planned article update: April 2022.
Highlights
Most of the ENP-South countries reported a current account deficit in 2018; the one exception was Israel.
All of the ENP-South countries reported a deficit for transportation services in 2018, while Lebanon, Morocco and Tunisia reported surpluses for travel.
This article is part of an online publication and provides data from the balance of payments for seven of the countries that form the European Neighbourhood Policy-South (ENP-South) region — Algeria, Egypt, Israel, Lebanon, Morocco, Palestine [1] and Tunisia; no recent data are available for Jordan, Libya or Syria. Developments should be viewed against the backdrop of social and political changes that have taken place or are still ongoing in several of these countries.
The article presents, among others, statistics on the current and capital account from the balance of payments as well as on foreign direct investment (FDI).
The balance of the current and capital accounts determines the exposure of an economy to the rest of the world, whereas the financial account explains how this is financed. The balance of the current and capital accounts should equal the net position of the financial account, any difference being recorded as net errors and omissions.
The section on foreign direct investment provides more information on one component of the financial account, while an article on international trade in goods focuses on one component of the current account.
Full article
Current account
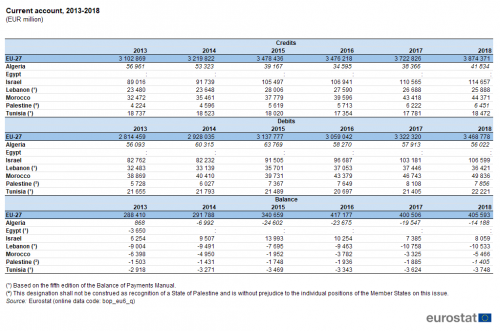
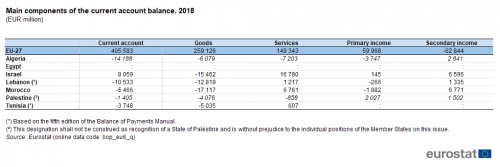
The current account of the EU-27 showed a surplus of EUR 405.6 billion in 2018 (see Table 1), continuing a series of surpluses recorded since 2009. Among the six ENP-South countries for which recent data are available (no recent data for Egypt), Israel was the only one to report a current account surplus in 2018 (EUR 8.1 billion); deficits ranged from EUR 1.4 billion in Palestine to EUR 14.2 billion in Algeria.
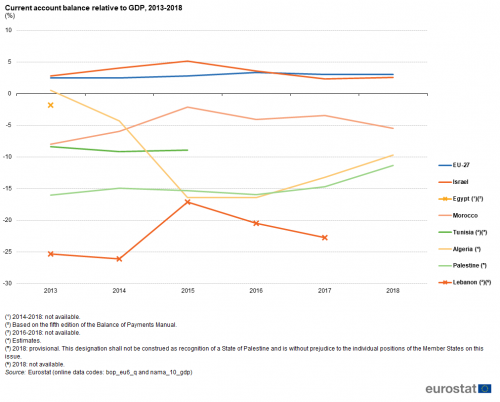
Relative to gross domestic product (GDP), the EU-27’s surplus was 3.0 % in 2018, a similar level to that recorded in 2017 (3.1 %) and just below its peak of 3.3 % in 2016 (see Figure 1). Israel’s current account surplus was equivalent to 2.6 % of GDP in 2018, up from 2.4 % in 2017 but down from a peak of 5.2 % in 2015. The current account deficits for the ENP-South countries mainly ranged from 5.5 % of GDP in Morocco to 11.4 % of GDP in Palestine, with Lebanon posting a relatively larger deficit in 2017, equivalent to 22.7 % of GDP. While Morocco’s deficit in 2018 was larger than it had been in the three previous years, it was lower than it had been in 2013. Palestine also recorded a lower ratio of its current account deficit to GDP in 2018 than in 2013 and Lebanon also recorded a narrowing of its deficit between 2013 and 2017. By contrast, Algeria moved from a small surplus in 2013 (0.5 % of GDP) to deficits thereafter, peaking at 16.4 % in 2015 and 2016 before narrowing in 2017 and 2018.
(%)
Source: Eurostat (bop_eu6_q) and (nama_10_gdp)
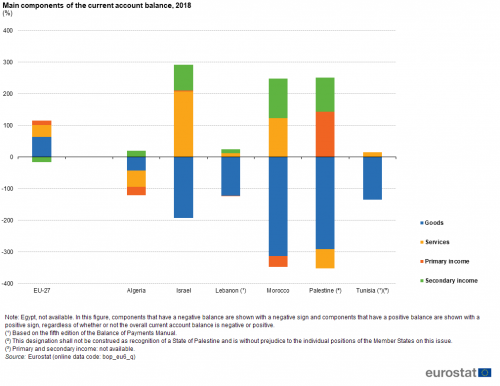
The current account surplus of the EU-27 for 2018 was based on surpluses in the component accounts for goods (EUR 259.1 billion), services (EUR 149.3 billion) and primary income (EUR 60.0 billion), while the balance for secondary income (EUR -62.8 billion) was negative (see Table 2).
All of the ENP-South countries recorded deficits for the goods component of the current account (net importers of goods), ranging from EUR 4.1 billion in Palestine to EUR 17.1 billion in Morocco. By contrast, most were net exporters of services and therefore recorded a surplus for the services component of the current account: the exceptions were Palestine and Algeria which were net importers of services. By far the largest surplus for services was recorded in Israel, valued at EUR 16.8 billion.
Algeria, Morocco and Lebanon were net donors of primary income while Palestine and Israel were net recipients. Primary income covers three types of transactions: income from work (paid to non-resident workers or received from non-resident employers), investment income and other primary income (taxes on production and on imports, subsidies and rent). Unlike the EU-27, all of the ENP-South countries for which data are available were net recipients of secondary income. Secondary income includes general government current transfers (such as payments of current taxes on income and wealth, social contributions and benefits, transfers related to international cooperation) as well as current transfers related to financial and non-financial corporations, households, or non-profit organisations.
(EUR million)
Source: Eurostat (bop_eu6_q)
The information presented in Table 2 is also shown in Figure 2, with the relative importance of each of the component accounts shown as a percentage of the current account balance. The positive or negative sign of each component in the figure reflects whether or not a positive or negative balance is recorded for that component, regardless of whether the overall current account balance is negative or positive. The overall surplus for the EU-27 and for Israel is reflected in the fact that the combined contribution of the components with a positive balance is greater than the combined contribution of the components with a negative balance. The figure illustrates the fact that all of the ENP-South countries (in so far as data are available) were net importers for goods and net recipients of secondary income whereas the reverse was true for the EU-27.
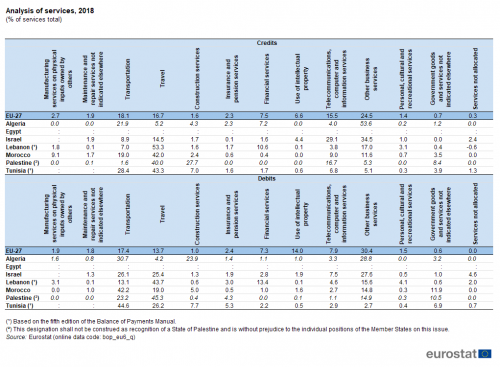
More information is available in Tables 3 and 4 concerning the services component of the current account, with an analysis of 13 components for six of the ENP-South countries (no recent data for Egypt). In most of these countries, some or all of travel, transportation and other business services were among the largest components.
For credits, the share of travel ranged in 2018 from 40.0 % in Palestine to 53.3 % in Lebanon, with Israel (14.5 %) and Algeria (5.2 %) below this range. Transportation accounted for 28.4 % of services credits in Tunisia and around one fifth in Algeria and Morocco, while other business services accounted for large shares of services credits in Algeria (53.6 %) and Israel (34.5 %). Palestine had an unusually high share of services credits for construction services (27.7 %) as did Israel for telecommunications, computer and information services (29.1 %).
Turning to debits, in 2018 the share of transportation within services exceeded two fifths in Tunisia and Morocco and was between one quarter and one third in Algeria, Israel and Palestine; the share was notably lower in Lebanon (13.1 %). For travel a similar range of shares was observed, exceeding two fifths in Palestine and Lebanon, being around one quarter in Tunisia and Israel and one fifth in Morocco, while the share was notably lower in Algeria (4.2 %). Other business services again had a large share in some countries, exceeding one quarter of total debits for all services in Algeria (28.8 %) and Israel (27.6 %), while the share for construction services was particularly high (23.9 %) in Algeria.
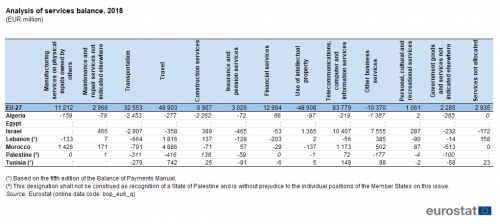
All of the ENP-South countries reported a deficit for transportation services (which was one of the largest services in value terms) as well as for government goods and services not indicated elsewhere (see Table 4). Most also indicated a deficit for insurance and pension services as well as for financial services. By contrast, most recorded a surplus for maintenance and repair services, construction services, telecommunications, computer and information services, and other business services. Morocco, Lebanon and Tunisia recorded relatively large surpluses for travel (which was also one of the largest services for most countries) while Palestine, Israel and Algeria recorded deficits.
Capital account
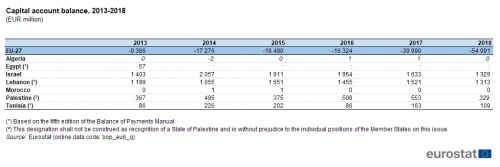
In 2018, net capital transfers to the rest of the world from the EU-27 were valued at EUR 55.0 billion (see Table 5). By contrast, Israel and Lebanon recorded capital account surpluses of EUR 1.3 billion in 2018, with smaller surpluses in Palestine (EUR 329 million) and Tunisia (EUR 109 million). In Algeria and Morocco, the capital account was balanced.
Relative to GDP, the EU-27’s capital account deficit was 0.4 % in 2018, somewhat larger than in earlier years — see Figure 3. Lebanon’s capital account surplus was equivalent to 3.2 % of GDP in 2017 while that of Palestine was equivalent to 2.7 % of GDP in 2018. The capital account surpluses in Israel and Tunisia were 0.4 % and 0.5 % of GDP.
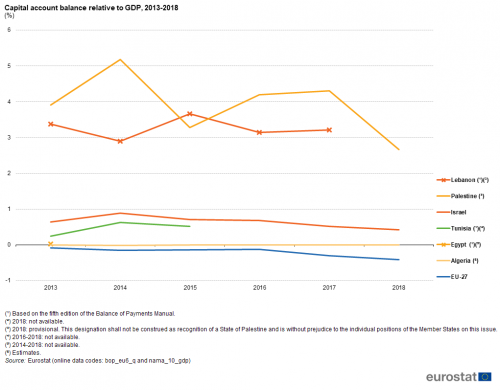
(%)
Source: Eurostat (bop_eu6_q) and (nama_10_gdp)
Foreign direct investment
The balance of the financial account is interpreted as net lending to the rest of the world when positive, and net borrowing from the rest of the world when negative. Three types of investment (direct investment (or FDI), portfolio and other investment) consolidate the financial account along with (net) financial derivatives and reserve assets. This section focuses on FDI.
All ENP-South countries were net recipients of FDI
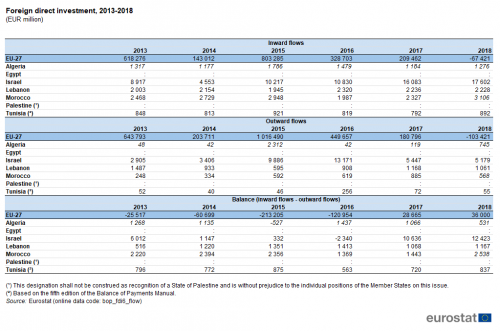
FDI represents a lasting interest in an enterprise operating in another economy and implies the existence of a long-term relationship between the direct investor and the enterprise. The EU-27 was a net investor abroad between 2013 and 2016 and a net recipient of FDI in 2017 and 2018 (see Table 6). Between 2013 and 2018, Israel was a net recipient of FDI every year except for 2016, while Algeria was a net recipient of FDI in all years except 2015. Lebanon, Morocco and Tunisia reported that they were net recipients of FDI for all years between 2013 and 2018.
In 2018, FDI flows into Israel exceeded outward flows by EUR 12.4 billion. Smaller balances were recorded elsewhere, ranging from EUR 2.5 billion in Morocco to EUR 0.5 billion in Algeria (no recent data for Egypt or Palestine). For comparison, the balance for the EU-27 in 2018 was EUR 36.0 billion, as the negative FDI inflows (reflecting a net withdrawal of previous FDI in the EU-27) were smaller than the negative FDI outflows (reflecting a net withdrawal of previous FDI flows from the EU-27).
Source data for tables and graphs
Data sources
The data for ENP-South countries are supplied by and under the responsibility of the national statistical authorities of each country on a voluntary basis. The data that are presented in this article result from an annual data collection cycle that has been established by Eurostat. No recent data are available from Jordan, Libya or Syria. These statistics are available free-of-charge on Eurostat’s website, together with a range of different indicators covering most socio-economic areas.
The balance of payments is a statistical statement that summarises the transactions of an economy with the rest of the world. More precisely, it records all economic transactions of an economy's residents with non-residents, where a change of ownership occurs. In this context a resident is a person or company that is registered in a country for more than one year.
Transactions are organised in two different accounts: on one hand the current and capital accounts and on the other hand the financial account. The sum of balances of these accounts should, in principle, be zero, as for each economic transaction in the current and capital accounts there should be an equivalent transaction in the financial account.
Data are generally presented in regard to the latest compilation standard of the IMF’s sixth balance of payments manual.
The current account of the balance of payments provides information not only on international trade in goods (traditionally the largest category), but also on international transactions in services, primary and secondary income. For all these transactions, the balance of payments registers the value of credits (exports) and debits (imports). A positive balance — a current account surplus — shows that an economy is earning more from its international export transactions than its spending abroad on import transactions with other economies, and is therefore a net creditor (net exporter) towards the rest of the world.
The capital account of the balance of payments provides information on the acquisition of non-financial assets by residents in the rest of the world, or by non-residents in the compiling economy, for example investment in real estate. It also includes capital transfers by general government, financial corporations, non-financial corporations, households and non-profit organisations (also specifically covering debt forgiveness).
The financial account of the balance of payments covers all transactions associated with changes of ownership in financial assets and liabilities of an economy with the rest of the world. Direct investment implies that a resident direct investor makes an investment that gives control or a significant degree of influence on the management of an enterprise in another economy.
Tables in this article use the following notation:
| Value in italics | data value is forecasted, provisional or estimated and is therefore likely to change; |
| : | not available, confidential or unreliable value. |
Context
Economic and financial statistics have become one of the cornerstones of governance at a global and European level, for example, to analyse national economies during the financial and economic crisis or to put in place European Union (EU) initiatives such as the European semester or macroeconomic imbalance procedures (MIP).
On 18 November 2015, the High Representative for Foreign Affairs and Security Policy and the European Commission jointly presented a review of the European Neighbourhood Policy (SWD(2015) 500 final) which underlined a new approach for the EU in relation to its eastern and southern neighbours, based on stabilising the region in political, economic, and security-related terms.
In cooperation with its ENP partners, Eurostat has the responsibility ‘to promote and implement the use of European and internationally recognised standards and methodology for the production of statistics necessary for developing and monitoring policy achievements in all policy areas’. Eurostat undertakes the task of coordinating EU efforts to increase the statistical capacity of the ENP countries. Additional information on the policy context of the ENP is provided here.
Notes
- ↑ This designation shall not be construed as recognition of a State of Palestine and is without prejudice to the individual positions of the Member States on this issue.
Direct access to
Books
Leaflets
- Basic figures on the European Neighbourhood Policy — South countries — 2020 edition
- Basic figures on the European Neighbourhood Policy — South countries — 2019 edition
- Basic figures on the European Neighbourhood Policy — South countries — 2018 edition
- Basic figures on the European Neighbourhood Policy — South countries — 2016 edition
- Basic figures on the European Neighbourhood Policy — South countries — 2015 edition
- International trade in goods for the European neighbourhood policy-South countries — 2018 edition
- Economy and finance (med_ec)
- Main GDP aggregates (nama10_ma)
- Balance of payments statistics and international investment positions (BPM6) (bop_q6)
- European Union direct investments (BPM6) (bop_fdi6)
- Southern European Neighbourhood Policy countries (ENP-South) (med) (ESMS metadata file — med_esms)
- European External Action Service — Middle East and North Africa (MENA)
- European External Action Service — European Neighbourhood Policy
- International Monetary Fund — Balance of Payments and International Investment Position Manual — 6th edition, 2009
- International Monetary Fund — BPM6 Compilation Guide, 2014
- Main changes in the Sixth Edition of the IMF's Balance of Payments and International Investment Position Manual
