Businesses in the administrative and support services sector
Data extracted in June 2024
Planned article update: June 2025
Highlights
This article presents an overview of statistics for the European Union's (EU) administrative and support services, as covered by NACE Rev. 2 Section N. Administrative and support services comprise a variety of activities that support business operations; they can be distinguished from professional, scientific and technical services (Section M) in that their primary purpose is not the transfer of specialised knowledge. It belongs to a set of statistical articles on 'Business economy by sector'.
Full article
Structural profile
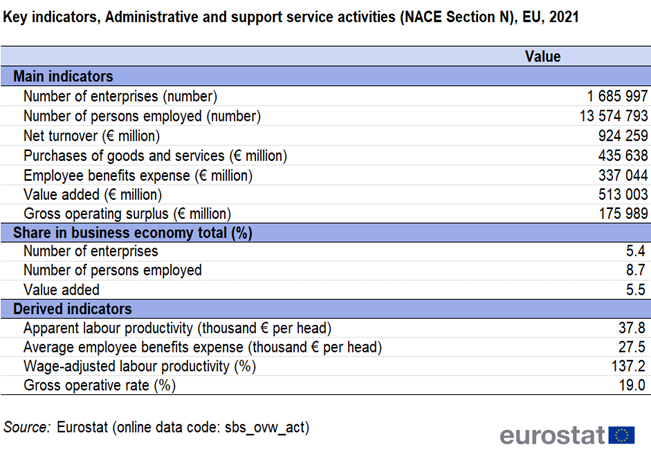
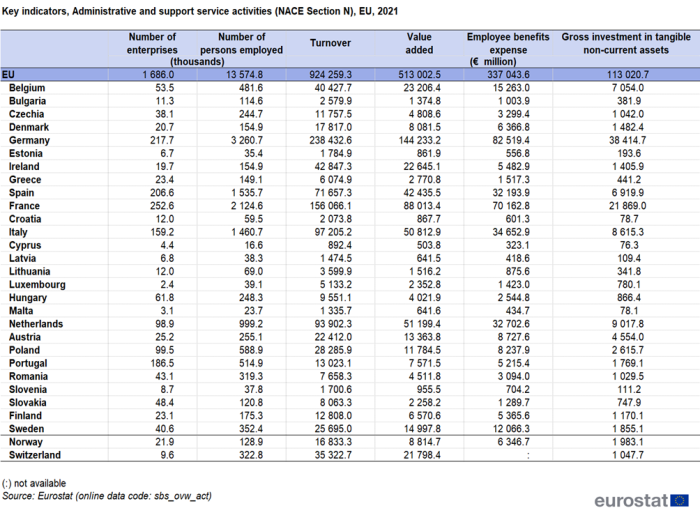
In 2021 there were 1.7 million enterprises active within the administrative and support services sector (Section N) in the EU; this was equivalent to 5.4 % of the business economy (Sections B to N and P to R, as well as Division S95 and S96) enterprise population. Many administrative and support services are labour-intensive activities and often the staff employed in these activities work on a part-time basis, for example, in cleaning activities (part of services to buildings and landscape activities), security and investigation activities, or employment activities. EU employment for the administrative and support services sector reached 13.6 million in 2021, an 8.7 % share of the business economy employment; in value added terms the administrative and support services sector contributed €513 billion, some 5.5 % of the business economy total. Compared with the previous year, an increase of 5.9 % can be seen in the number of persons employed, while the value added of the administrative and support services sector increased by 16.9 % compared with 2020.
Source: Eurostat (sbs_ovw_act)
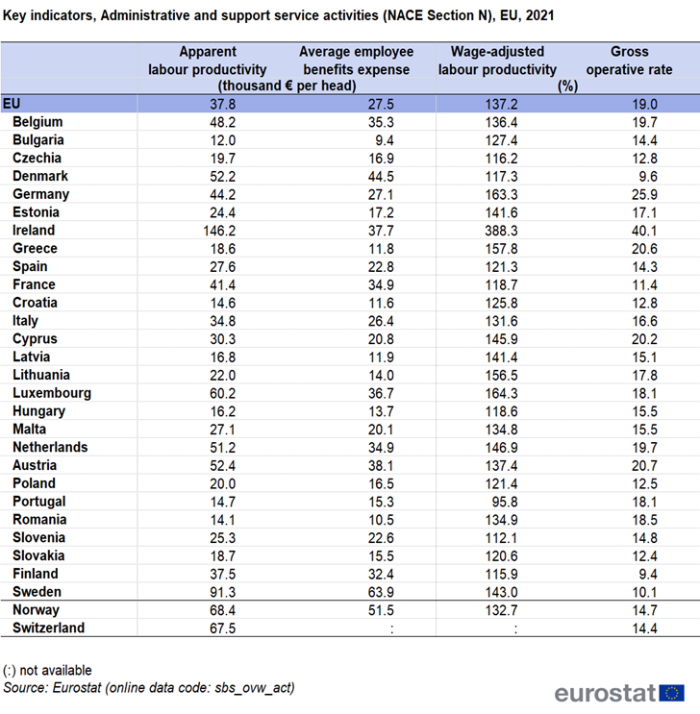
Average employee benefits expense (average personnel costs) for the EU's administrative and support services sector in 2021 were equal to €27 500 per employee, which was below the business economy average (€39 000 per employee). This was one of the lowest levels of average employee benefits expense among the business economy NACE sections, this sector being traditionally characterised as employing a high proportion of part-time employees, which has a downward influence on average employee benefits expense (which are measured in terms of a head count). The wage-adjusted labour productivity ratio is based on the relation between value added and employee benefits expense and is expressed as a percentage and not a per head value, and so is not directly influenced by the incidence of part-time employment. For the administrative and support services sector the wage-adjusted labour productivity ratio was 137.2 % in the EU in 2021, which was below the business economy average (154.4 %). The gross operating rate (the relation between the gross operating surplus and turnover) stood at 19.0 % for the EU's administrative and support services sector in 2021, well above the business economy average (13.2 %).
Sectoral analysis
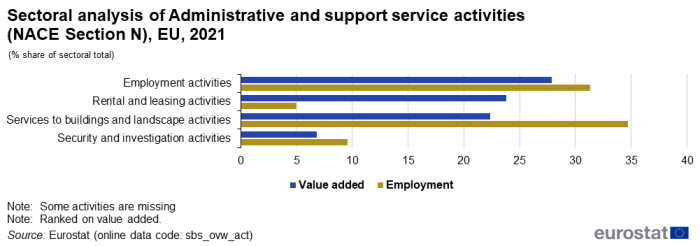
Figure 1 shows the varied contributions, depending upon whether value added or employment is chosen, of the various subsectors to the administrative and support services sectorial total. Employment activities (Division 78) accounted for the highest share of sectorial value added (27.9 %) and second highest share for employment (31.3 %).
Capital-intensive rental and leasing activities subsector (Division 77) had the second highest contribution to value added share (23.8 %), closely followed by services to buildings and landscape activities subsector (Division 81) – 22.3 %. Their employment share differentiate strongly: only 5.0 % for rental and leasing activities, indicating a very high apparent labour productivity ratio, and 34.7 % for services to buildings and landscape activities, the highest contribution to the employment share.
(% share of sectoral total)
Source: Eurostat (sbs_ovw_act)
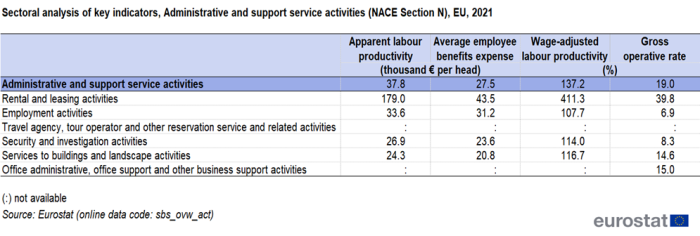
In 2021, the apparent labour productivity and average employee benefits expense for three subsectors (for which data is available) were below the business economy average. The EU's rental and leasing subsector was the main exception, as the person employed in this subsector generated on average €179 000 per employee, while the average employee benefits expense were €43 500 per employee. This high level of apparent labour productivity for the rental and leasing subsector reflects the nature of the activity, which often involves purchasing capital assets and generating operating income from these assets. The rental and leasing subsector typically has very low operating expenditure while the levels of depreciation, financial charges or extraordinary expenditure may be high — none of these charges are taken into account in the calculation of value added. The elevated apparent labour productivity and relatively subdued average employee benefits expense translated into a very high wage-adjusted labour productivity ratio for the EU's rental and leasing subsector, namely 411.3 %. At the NACE division level, this was among the highest wage-adjusted labour productivity ratio across the whole of the business economy. Among the three remaining administrative and support services subsectors (for which data is available) no other activity recorded a wage-adjusted labour productivity ratio in the EU that was above the business economy average (137.2 %) in 2021.

(NACE Section N), EU, 2021
Source: Eurostat (sbs_ovw_act)
(NACE Section N), EU, 2021
Source: Eurostat (sbs_ovw_act)
As well as its very high levels of productivity, the EU's rental and leasing subsector also had a very high gross operative rate. Indeed, it recorded the second highest gross operative rate (39.8 %) in 2021 among all of the NACE divisions within the business economy, just slightly lower than Mining of metal ores (Division B07). The gross operative rate for the rental and leasing subsector was three times as high as the average for the whole of the business economy (13.2 % in 2021). The lowest gross operative rate in sector for which data is available was recorded for employment activities with only 6.9 % in 2021.
Country overview
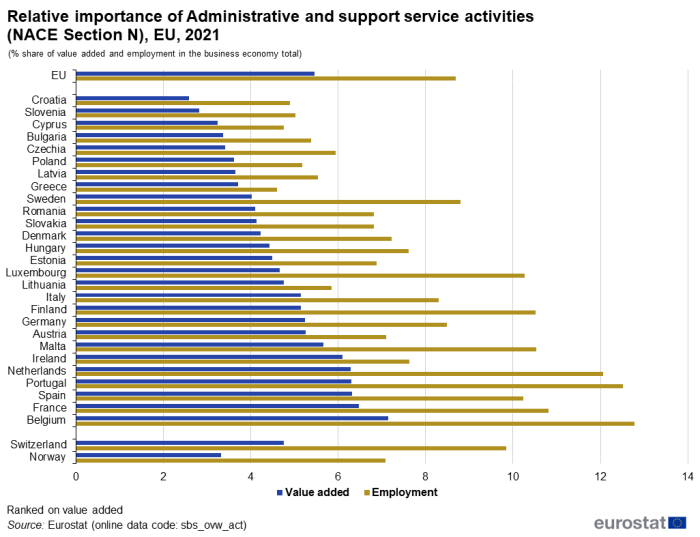
In value added terms, Belgium was the most specialised EU Member State, as 7.1 % of its business economy value added was generated in the administrative and support service activities sector. It was followed by France (6.5 %) and Spain, Portugal and the Netherlands (each with 6.3 %), which were also relatively specialised in terms of value added. By contrast, Croatia with 2.6 %, Slovenia with 2.8 %, and Cyprus with 3.2 % recorded the lowest shares of its business economy value added generated in the administrative and support service activities sector (compared with an EU average of 5.5 %).
In Belgium, the administrative and support service activities sector provided employment to 12.8 % of the business economy employment, which was almost 1.5 times the EU average, while Greece had the lowest share in employment terms, as the administrative and support service activities sector provided work to 4.6 % of its business economy employment (compared with an EU average of 8.7 %).
(% share of value added and employment in the business economy total)
Source: Eurostat (sbs_ovw_act)
Within the administrative and support service activities sector, value added and employment were relatively concentrated in geographical terms: the five largest EU Member States generated 73.4 % of EU added value, while their share in the administrative and support services' employment was 69.1 %.
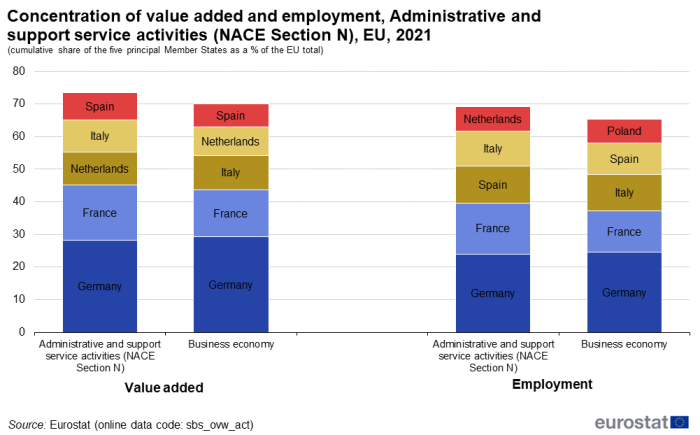
(cumulative share of the five principal Member States as a % of the EU total)
Source: Eurostat (sbs_ovw_act)
As a result of its high specialisation in value added terms, Germany had the largest administrative and support services sector among the EU Member States, generating around €144.2 billion of added value (some 28.1 % of the EU total), ahead of France (€88.0 billion). Germany also had the largest employment, 3.3 million persons, equivalent to 24.0 % of the EU total, while there were 2.1 million persons employed in the administrative and support services sector in France, or 15.7 % of the EU total.
Source: Eurostat (sbs_ovw_act)
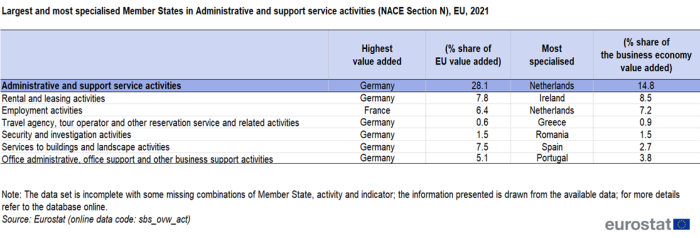
Among the six subsectors which form administrative and support services (at the NACE division level), Germany generated the highest level of value added for five of them with shares ranging from 0.6 % to 7.8 % of the EU's value added. The only subsector not dominated by Germany was employment activities for which France accounted for 6.4 % of the EU's value added.
In each of the six subsectors which form administrative and support services, different EU Member States were most specialised in terms of value added. Highest specialisation rate (8.5 %) was recorded in Ireland for rental and leasing activities. Other Member States that were particularly strongly specialised in just one of the subsectors were: the Netherlands for employment activities; Portugal for office administrative, office support and other business support activities and Spain for the services to buildings and landscape activities subsector.
Source: Eurostat (sbs_ovw_act)
Source: Eurostat (sbs_ovw_act)
Only one EU Member States, namely Portugal (95.8 %), recorded the wage-adjusted labour productivity ratios below the parity (100 %). In the majority of the Member States, the wage-adjusted labour productivity ratio was below the average for the business economy (154.4 %); the only exceptions to this pattern were recorded in Ireland (388.3 %), Luxembourg (164.3 %), Germany (163.3 %), Greece (157.8 %) and Lithuania (156.5 %).
Data sources
Coverage
Administrative and support services (Section N) include the following six NACE divisions:
- rental and leasing of motor vehicles, personal and household goods, machinery and equipment, and intellectual property (Division 77);
- employment activities including recruitment and personnel selection services, as well as job placement services (Division 78);
- travel agency, tour operator, reservation services and related activities (Division 79);
- security and investigation activities, including the transportation of valuables (Division 80);
- services to buildings and landscape activities including combined facilities support and cleaning services (Division 81);
- office administrative, office support and other business support activities, including call centers and the organisation of trade shows (Division 82).
The administrative and support services sector does not include financial leasing which is considered as a financial service. Renting of real estate is also excluded as is the renting of equipment with operator which is included as appropriate in the construction sector (Section F) or the transportation and storage sector (Section H). Employment activities do not include agents of individual artists which are considered to be part of a professional activity (Section M) as is the provision of security consultancy and landscape design (rather than landscaping itself). Security services do not include public order and safety activities (for example, by the police). Cleaning services do not include car washing which is part of motor trades within the activity of distributive trades (Section G).
Data sources
The analysis presented in this article is based on the main dataset for structural business statistics (SBS), size class data and regional data, all of which are published annually.
The main series provides information for each EU Member State as well as a number of non-member countries at a detailed level according to the activity classification NACE. Data are available for a wide range of variables.
In structural business statistics, size classes are generally defined by the number of persons employed. A limited set of the standard structural business statistics variables (for example, the number of enterprises, turnover, persons employed and value added) are analysed by size class, mostly down to the three-digit (group) level of NACE. The main size classes used in this article for presenting the results are:
- small and medium-sized enterprises (SMEs): with 1 to 249 persons employed, further divided into:
- micro enterprises: with less than 10 persons employed;
- small enterprises: with 10 to 49 persons employed;
- medium-sized enterprises: with 50 to 249 persons employed;
- large enterprises: with 250 or more persons employed.
Structural business statistics also include regional data. Regional SBS data are available at NUTS levels 1 and 2 for the EU Member States, Iceland and Norway, mostly down to the two-digit (division) level of NACE. The main variable analysed in this article is the number of persons employed. The type of statistical unit used for regional SBS data is normally the local unit, which is an enterprise or part of an enterprise situated in a geographically identified place. Local units are classified into sectors (by NACE) normally according to their own main activity, but in some EU Member States the activity code is assigned on the basis of the principal activity of the enterprise to which the local unit belongs. The main SBS data series are presented at national level only, and for this national data the statistical unit is the enterprise. It is possible for the principal activity of a local unit to differ from that of the enterprise to which it belongs. Hence, national SBS data from the main series are not necessarily directly comparable with national aggregates compiled from regional SBS.
Context
The freedom to provide services and the freedom of establishment are central principles to the internal market for services. They guarantee EU enterprises the freedom to establish themselves in other Member States, and the freedom to provide services on the territory of another EU Member State. The Directive on services in the internal market (COM(2006) 123) aims to achieve a genuine internal market in services, removing legal and administrative barriers to the development of services activities between Member States. As well as covering most administrative and support service activities (with the notable exception of services of temporary work agencies and private security services), the Directive applies to a wide variety of services including many industrial and construction activities, as well as distributive trades, accommodation and food services, real estate, and professional, scientific and technical services.
Rental and leasing services are provided to households and to business clients. The use of renting or operating leasing can increase financial flexibility, reducing the need to commit own capital, whether for machinery, equipment or appliances. Personnel services may be supplied to persons looking for work or to an enterprise trying to hire. Security and investigation activities as well as services to buildings and landscape activities are mainly business services, although there is also a market for these services among households.
Travel agencies are enterprises that are engaged in arranging transport, accommodation and catering on behalf of travellers. Travel agents act as retailers selling travel services or packaged trips to the customer. Traditionally, tour operators acted as wholesalers to travel agents but they have moved more recently towards selling directly to customers. Tourist guides and tourist information services play a supporting role, offering information and services usually at the tourism destination, but also online.
Direct access to
- Recent Eurostat publications on SBS
- Key figures on Europe – 2023 edition – see subchapter on Business
- Eurostat's Regional Yearbook – see chapter 8. Business
- News Release SBS – 2021 final data
Glossary
ESMS metadata files
- Structural business statistics – SBS metadata file