International trade in services - an overview
Data extracted in June 2024.
Planned article update: August 2025.
Highlights
In 2023, Germany had the highest value of services exports (€407 billion) and services imports (€470 billion) among the EU countries, followed by Ireland.
Between 2013 and 2023, the fastest growth for trade in services among EU countries was recorded in Ireland and Lithuania: each recorded double-digit annual increases for both exports and imports, as did Romania and Cyprus.
Globalisation patterns in EU trade and investment is an online Eurostat publication presenting a summary of recent European Union (EU) statistics on economic aspects of globalisation, focusing on patterns of EU trade and investment.
This article describes the major developments of International trade in services in the EU countries.
The provision of services contributes a substantial share of the EU's economic wealth and accounts for more than half of GDP in each of the EU countries. Services also play an important role in all modern economies. A resilient service sector, as well as increased availability of services, may boost economic growth and enhance industrial performance. In an increasingly globalised world, services such as finance, insurance, transport, logistics and communications deliver key intermediate inputs and thereby provide crucial support to the rest of the economy.
Full article
International trade in services
Since 2013, flows of EU international trade in services have increased substantially; the EU's trade surplus for services was valued at €164 billion in 2023
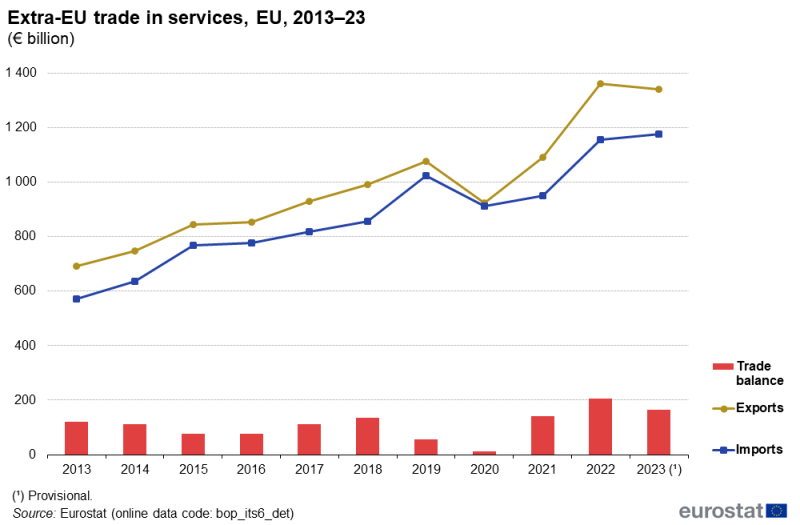
During the period from 2013 to 2015, the value of EU exports and imports of services to and from non-EU countries (also referred to as extra-EU trade) grew steadily. The pace at which the value of exports and imports grew slowed in 2016, before accelerating once more up until 2019. The impact of the COVID-19 crisis in 2020 led to a substantial fall in the value of both exports (down 14.1%) and imports (down 10.7%) from and to the EU; note these data are based on a series in current prices. There was a strong rebound in 2021 for EU exports, which just surpassed pre-pandemic levels. However, a different pattern was observed for EU imports as they rose at a modest pace in 2021. In 2022, the increase accelerated and the EU's exports and imports of services were clearly valued above the levels observed before the pandemic in 2019. In 2023, more moderate rates of change returned, with a decrease of 1.5% for exports and an increase of 1.8% for imports.
During the period 2013–23 (see Figure 1), the highest annual growth rates for extra-EU exports were in 2015 (up 13.1%), 2021 (up 18.0%) and 2022 (up 24.6%), the only years that double-digit growth rates were recorded. The highest growth rates for extra-EU imports were registered in 2014 (up 11.5%), 2015 (up 20.6%), 2019 (up 19.4%) and 2022 (up 21.4%).
In 2023, the value of EU exports of services (€1 340 billion) was higher than the value of imports (€1 177 billion), resulting in a trade surplus of €164 billion (see Figure 1). From an initial level of €122 billion in 2013, the EU's trade surplus for services fell to €76 billion by 2016 as the value of imports of services grew at a faster pace than the value of exports. The trade surplus subsequently widened to reach a peak of €137 billion in 2018, before a rapid acceleration in the value of imports led to it falling to €55 billion in 2019. The surplus contracted further in 2020 to €12 billion as both exports and imports of services were impacted by the COVID-19 crisis. With a rapid rebound in the value of exports and lower growth in the value of imports in 2021 and 2022, the EU's trade surplus reached its peak of €206 billion in 2021 and fell back to €164 billion in 2023 as imports increased and exports decreased.
Trade in services by EU countries
Among the EU countries, Germany had the highest value of services exports (€407 billion) and services imports (€470 billion) in 2023, followed by Ireland
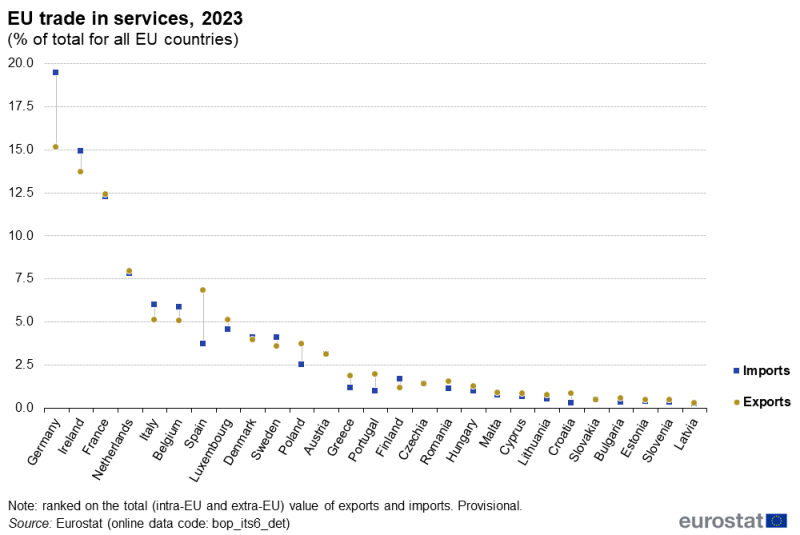
Among the EU countries, Germany recorded the highest share (15.1%) of exports of services in 2023 (see Figure 2); note these figures for individual EU countries are based on world trade flows, in other words, the sum of intra- and extra-EU trade. Ireland (13.7%) and France (12.4%) were the only other EU countries to record shares above a tenth. Along with Ireland, the Netherlands (7.9%) and (Spain 6.8%) accounted for relatively large shares of the total value of services exported by EU countries.
The highest share of imports of services among the EU countries in 2023 was also Germany with (19.4%), again followed by Ireland (14.9%) and France (12.3%); they were the only EU countries to record double-digit shares. The Netherlands (7.8%) and Italy (6.0%) have recorded relatively high shares.

(% of total for all EU countries)
Source: Eurostat (bop_its6_det)
During the period from 2013 to 2023, the highest growth rates for trade in services were recorded in Ireland and Lithuania
Figure 3 presents the average annual rate of change for international trade in services over the period from 2013 to 2023; note that these rates of change are based on current prices. EU exports to non-EU countries rose on average by 6.8% per year during the observed period, while the average growth rate for imports was slightly higher, at 7.5% per year.
The expansion in the value of trade in services (for intra- and extra-EU trade combined) was considerably higher in some of the EU countries, with the fastest growth rates – for imports and exports combined – being recorded in Ireland, Lithuania, Romania and Cyprus. By contrast, the Netherlands recorded the slowest increase for trade in services.

(% per year)
Source: Eurostat (bop_its6_det)
In 2023, Ireland and Germany had the highest values of extra-EU exports and imports of services
The structure of trade in services may be analysed in more detail, distinguishing between trade flows that are destined for non-EU countries (extra-EU trade) on one hand and trade flows with other EU countries (intra-EU trade) on the other. There are considerable differences between EU countries as to the relative importance of intra- and extra-EU trade.
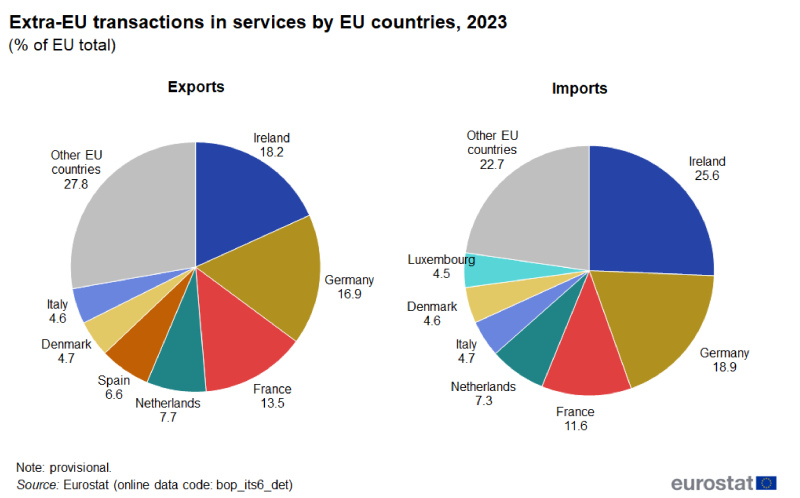
In absolute terms, Ireland and Germany had the highest values of extra-EU exports of services (€244 billion and €227 billion, respectively, in 2023), which equated to 18.2% and 16.9% of the EU's exports to non-EU countries (see Figure 4). The next highest share was recorded for France (13.5%).
In 2023, Ireland had the highest value of imports of services from non-EU countries: €302 billion (25.6% of the EU's imports from non-EU countries). Offshore financial centres were the main origin for imports of services into the Irish economy; these centres are usually small countries/jurisdictions that provide financial services to non-residents on a scale that is disproportionate with the size and the financing of their domestic economy. Germany (18.9%) and France (11.6%) had the next highest shares of extra-EU services imports in 2023.

(% of EU total)
Source: Eurostat (bop_its6_tot)
In 2023, the highest values of intra-EU imports and exports of services were recorded in Germany
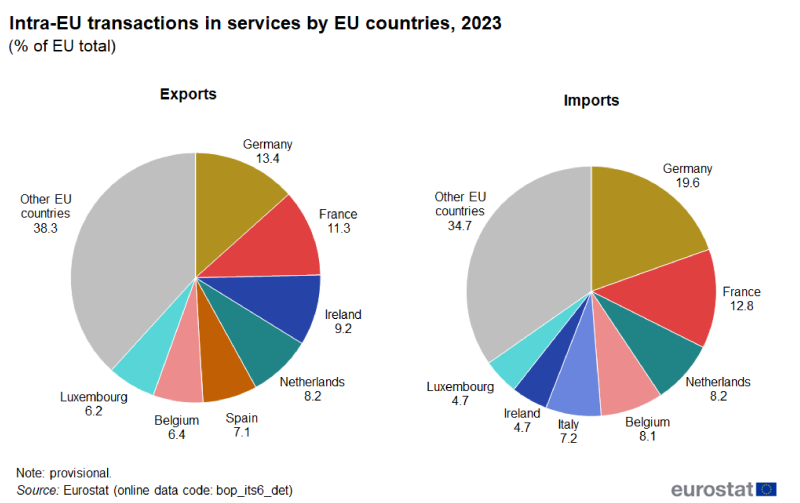
A similar analysis for intra-EU trade is presented in Figure 5. It shows that Germany had the highest value of services exports to other EU countries (€180 billion in 2023), which equated to 13.4% of the total for the 27 EU countries. France (11.3%) was the only other EU country to account for a double-digit share of intra-EU exports of services in 2023, although Ireland (9.2%) and Luxembourg (6.2%) had particularly high shares relative to the size of their economies.
Germany was also the largest importer of services from other EU countries, with imports valued at €242 billion in 2023, some 19.6% of the total for the 27 EU countries. The next highest share was recorded in France (12.8%).
It can be noted that the cumulative share of the 7 EU countries with the highest values of extra-EU services exports in 2023 was equal to almost three quarters (72.2%) of the EU total, whereas the cumulative share of the 7 EU countries with the highest values of intra-EU services exports was considerably lower, at 61.7%. These figures suggest that extra-EU trade in services is more concentrated between a few trading nations.

(% of EU total)
Source: Eurostat (bop_its6_tot)
A closer analysis of intra- and extra-EU trade flows reveals that 21 of the EU countries reported that a majority of their total trade in services took place with other EU countries (rather than with non-EU countries). In 2023, the highest share of trade in services with other EU countries was recorded by Slovakia (76.5%), while in excess of 70.0% of all trade in services in Slovenia, Austria, Lithuania, Romania and Croatia was also with other EU countries. By contrast, a majority of the trade in services that was conducted by France, Germany and Denmark was with extra-EU partners, while three quarters (75.0%) of all trade in services in Ireland was with non-EU countries.
Source data for tables and graphs
Direct access to
Metadata
- Balance of payments – international transactions (BPM6) (ESMS metadata file – bop_6_esms)
Further methodological information
