Quality of life indicators - social interactions
Data extracted in July 2024.
Planned article update: October 2029.
Highlights
In 2022, people in the EU were quite satisfied with their personal relationships, rating them on average 7.8 out of 10.
In 2022, 4.6% of those with tertiary education contacted their friends less often than once per month.
Across the EU, 7.7% of those over 16 declared feeling left out of society, and the feeling is twice as present amongst those with a lower level of education.
Between 2018 and 2022 the share of people having no one to rely on in case of need increased for all age groups, reaching 20.4 % for 35–49-year-olds.
Satisfaction with personal relationships, 2022
This article focuses on the fifth dimension —leisure and social interactions — of the nine quality of life indicators dimensions that form part of a framework endorsed by the Eurostat expert group on quality of life indicators. Social relationships have been shown to operate as a buffer against the negative effects of stress on an individual’s wellbeing[1].
Full article
Key points on social interactions
Frequent and rewarding social interactions are associated with a range of positive life outcomes, such as better health or improved chances of finding a job. More specifically, social support or having someone to rely on in case of need is considered to be a particularly important variable for explaining the distribution of happiness. It has also been chosen as one of six key indicators that are used within the United Nations’ World happiness report. Aside from encompassing our basic need to engage in activities, the quality of social interactions may promote the existence of supportive relationships, interpersonal trust and social cohesion.
- Europeans are quite satisfied with their personal relationships, rating them on average 7.8 out of 10 in 2022. This represents a slight decrease from 2018, when the average was 7.9.
- Younger people, women, people living in households with dependent children and those with a higher income / level of education were more satisfied than the average.
- There has been an increase in the proportion of people declaring they do not have anyone to ask for help in case of need, from 7.7% in 2018 to 11.2% at EU level in 2022.
- Those with a lower level of education declare feeling excluded from society more than twice as much as those with a degree / tertiary education (10.7% compared to 4.7% at EU level).

(% share of people aged 16 years and over)
Source: Eurostat (ilc_pw01b)
Satisfaction with personal relationships
In this section we will look at how satisfied people are with their personal relationships, including when taking into account different characteristics such as age, sex, household composition, education and income levels. Within the EU, satisfaction with personal relationships has slightly decreased from 7.9 in 2018 to 7.8 in 2022 (Figure 1). Most EU countries registered only slight variations, with a more important decrease seen in Bulgaria (0.6 points). In 2022, the highest ratings of satisfaction with personal relationships were reported in Malta, Austria and Slovenia (all at 8.6), with 11 more countries scoring above 8 points. All the other EU countries had satisfaction levels above 7, except Bulgaria which recorded 6.

(Average rating 0-10, people aged 16 years and over)
Source: Eurostat (ilc_pw01b)
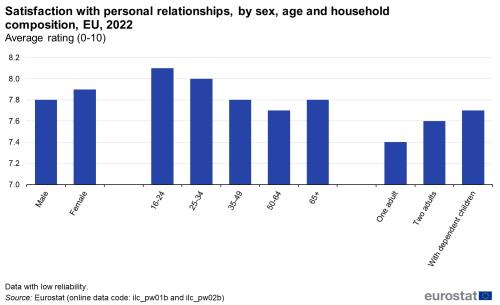
Figure 2 shows an analysis of satisfaction with personal relationships at EU level, comparing women and men, several age groups and households with different compositions. In 2022, women were slightly more satisfied with their relationships than men (7.9 vs. 7.8). Looking at the age groups, people under 24 seem to be most satisfied (8.1), while 50–64-year-olds are the group least satisfied with their relationships (7.7). People living in households with either two adults or together with dependent children tend to be more satisfied with their relationships (7.9) than those living in one person households (7.6).

(Average rating 0-10, people aged 16 years and over)
Source: Eurostat (ilc_pw01b) and (ilc_pw02b)
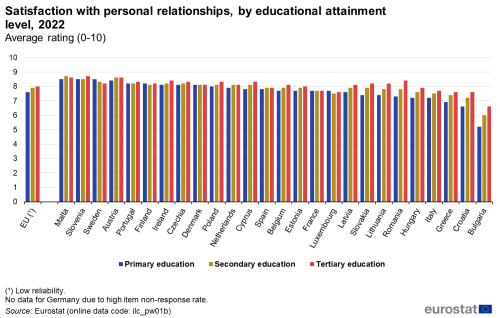
More highly educated people declare to be more satisfied with their personal relationships, as shown by Figure 3. This tendency holds true at EU level and is more pronounced in countries where a lower satisfaction level was measured overall: Bulgaria, Croatia, Greece, Italy, Hungary, Romania, Lithuania, Slovakia and Latvia. At the other end of the spectrum, for example in Malta and Slovenia where the satisfaction level for all groups reaches 8.5 or above, the difference between people of different education levels is minimal or non-existent. In Sweden, the reverse trend is observed, albeit with minimal differences.

(Average rating 0-10, people aged 16 years and over)
Source: Eurostat (ilc_pw01b)
People in higher income quintiles are more satisfied with their personal relationships than people in the lowest income quintile, as it can be seen in Figure 4. There are no exceptions to this trend, which is consequently also visible at EU level. There are variations only to the degree this gap varies between the countries: from 1.8 points in Bulgaria to 0.2 points in Slovenia.

(Average rating 0-10, people aged 16 years and over)
Source: Eurostat (ilc_pw02b)
Social support
This situation is partially mirrored by Figure 5, which shows the share of people who are in contact with their friends less than once a month in the highest and lowest income quintiles. At EU level, there is a difference of 7.8 percentage points (pp): 12.4% of people in the lowest income quintile contact their friends less than once a month, while this share is 4.6% in the highest income quintile. This pattern holds true in all EU countries, to varying degrees: in Latvia and Malta the difference is above 20 pp (22.4 and 20.2, respectively), while the smallest difference is seen in Denmark (0.1 pp). The information that is presented refers only to friends who do not live in the same household as the respondent.

(% share of people aged 16 years and over)
Source: Eurostat (ilc_scp12)
Between 2018 and 2022 there has been an increase of people reporting having no one to rely on in case of need (from 7.7% to 11.2%). It has been shown in the World Happiness Report that life satisfaction, a subjective indicator for the quality of life, improves with the availability of practical, moral and financial support from family and friends. Within the context of the EU statistics on income and living conditions (EU-SILC), this is measured by the respondent’s capacity/possibility to ask for any kind of help moral, material or financial from family, relatives, friends or neighbours. Figure 6 shows that there has been an increase in the share of people who report having no one ask for help for all age groups, and most notably for people between 25 and 34 and between 35 and 49 years old (increase of 12.5 pp and 11.6 pp, respectively).

(% share of people aged 16 years and over)
Source: Eurostat (ilc_pw06)
Figure 7 analyses the share of people feeling left out of society by educational attainment. A higher percentage of people with a lower level of education feel left out of society than those with a higher education level. The highest share of people with primary education that feel left out of society was in Finland (21.6% compared to 9.6% among people with higher education) and Ireland (21.3% compared to 15.6%). Poland was at the other end of the spectrum, where the percentage of people with lower education who felt left out of society was the lowest (3%).

(% share of people aged 16 years and over)
Source: Eurostat (ilc_pw10)
Source data for tables and graphs
Data sources
Within the ‘quality of life’ framework, information on social interactions covers quantitative and qualitative aspects regarding frequency of social contacts and access to help and support from others, as well as a subjective assessment of the satisfaction with personal relationships. The data used in this article are derived from EU-SILC, an annual survey that is the principal European source for measuring income and living conditions, as well as the leading source of information for analysing various aspects related to the quality of life of households and individuals. All the data used in this article covering social interactions come from the EU-SILC 6-yearly module on “Quality of life” (2022). A total of twenty variables were collected: seven in relation to personal wellbeing (including subjective rating of satisfaction with personal relations, amount of leisure time and financial satisfaction and frequency of experiencing positive and negative feelings such as happiness, loneliness and help from others) and thirteen covering social and cultural (including integration with family, relatives, friends and neighbours; attending cultural or sport events; practicing artistic activities and reading books; social participation and availability of social support). All of the data presented refer to individuals who were aged 16 and over (no information is presented in relation to households).
Context
Our subjective perception of wellbeing, happiness and life satisfaction is fundamentally influenced by our ability to engage in and spend time on activities we enjoy. The importance attributed by modern societies to work-life balance underlines the role that leisure and social interactions may play in our quality of life. They have a quantitative aspect (in other words, the availability of time for taking part in activities we enjoy) and a qualitative aspect (for example, the ease of access to leisure activities).
Direct access to
- All articles on poverty and social exclusion
- Quality of life indicators (online publication)
- Quality of life, see:
- Material living conditions (qol_mlc)
- Productive or other main activity (qol_act)
- Health (qol_hlt)
- Education (qol_edu)
- Leisure and social interactions (qol_lei)
- Economic security and physical safety (qol_saf)
- Governance and basic rights (qol_gov)
- Natural and living environment (qol_env)
- Overall experience of life (qol_lif)
- EU-SILC ad-hoc modules (ilc_ahm)
Notes
- ↑ Abdallah, S. and Stoll, L. (2012), Review of individual-level drivers of subjective well-being, produced as part of the contract Analysis, implementation and dissemination of well-being indicators, Eurostat.