Businesses in the construction of buildings sector
Data from July 2024
Planned article update: July 2025
Highlights
Building projects typically take much longer from conception to completion than the creation of products in many other sectors, and often involve a large number of subcontracting enterprises with various specialisations. Another characteristic of the construction of buildings sector is that this activity is particularly cyclical, influenced by business and consumer confidence, interest rates and government programmes; this should be borne in mind when interpreting data that concern recent years which have been affected by the financial and economic crisis.
Full article
Structural profile
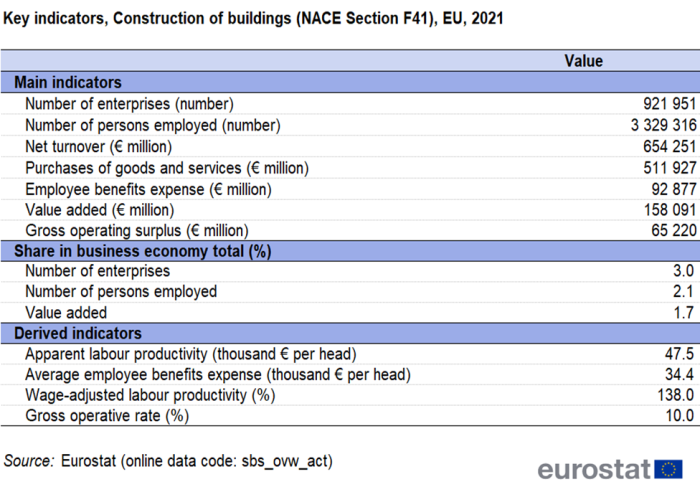
The construction of buildings sector is one of the smallest (at the NACE division level) within the EU's non-financial business economy (Sections B to N and P to R, as well as Divisions S95 and S96). Around 922 000 enterprises operated in the EU's construction of buildings sector (Division 41) in 2021, accounting for 3.0% of all enterprises in the non-financial business economy. Compared with the previous year, the number of enterprises increased by 6.8%. These enterprises employed over 3.3 million persons, 2.1% of the employment in non-financial business economy and 24.8% of the total number of persons employed in construction (Section F). They generated €158.1 billion of value added, an increase of 10.4% compared with 2020. The value added recorded in the construction of buildings represented 1.7% of the non-financial business economy total and 25.7% of the construction total.
Source: Eurostat (sbs_ovw_act)
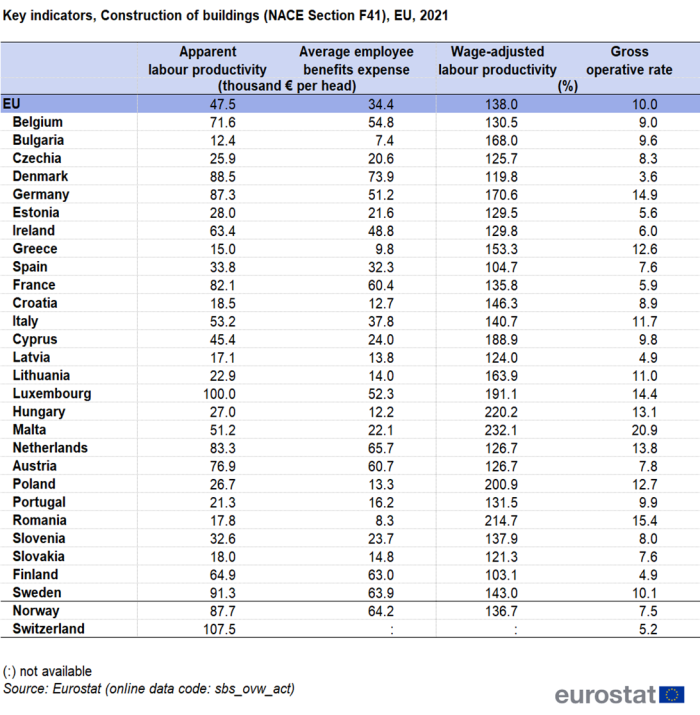
The apparent labour productivity of the EU's construction of buildings sector in 2021 was €47 500 per person employed, €12 700 per person less than the non-financial business economy average of €60 200 per person employed, but slightly above the construction average of €45 800 per person employed. Average employee benefits expense (average personnel costs) within the EU's construction of buildings sector were €34 400 per employee, slightly lower than the non-financial business economy average (€39 000 per employee) and the construction average (€38 200 per employee). The EU's construction of buildings sector recorded a wage-adjusted labour productivity ratio of 138.0%, below the non-financial business economy average (154.4%), but well above the construction average (119.9%). This sector's gross operative rate (the relation between the gross operating surplus and turnover) of 10.0% was also below the non-financial business economy average (13.2%) and below construction average (11.4%).
Sectoral analysis
The construction of buildings sector is composed of two subsectors: the development of building projects (Group 41.1) and the construction of residential and non-residential buildings (Group 41.2). The development of building projects was the smaller of the two subsectors within the EU according to most measures, with 9.8% of the sector's employment and 20.5% of sectoral value added in 2021 — see Figure 1. The subsector of construction of residential and non-residential buildings employed around 3 million persons, representing 90.2% of the construction of buildings sector and has generated 79.5 of the sector's value added (€125.7 billion)

(% share of sectoral total)
Source: Eurostat (sbs_ovw_act)
Due to its lower employment share, the EU's development of building projects subsector had a much higher apparent labour productivity (€99 700 per person employed) than that for the construction of residential and non-residential buildings subsector. In fact, the apparent labour productivity of the development of building projects subsector was by far the highest among all of the NACE groups within the construction sector. A similar situation could be seen for the other indicators shown in Table 2b. In 2021, average employee benefits expense and wage-adjusted labour productivity were higher for the EU's development of building projects subsector.

Source: Eurostat (sbs_ovw_act)

Source: Eurostat (sbs_ovw_act)
By contrast, the construction of residential and non-residential buildings recorded an apparent labour productivity of €41 800 per person employed and an average employee benefits expense of €33 400 per employee that were also below the average of €38 200 per employee of the construction sector.
Country overview
As noted above, the construction of buildings sector traditionally displays a strongly cyclical development. Cyprus was the Member State with, in relative terms, the construction of buildings sector with the highest value added in 2021, where 4.7% of its non-financial business economy value added was generated, followed by Romania (3.9%), Finland (3.5%), Lithuania and Portugal (each with 3.3%) and Luxembourg (3.1%). The least specialised Member States, in value added terms, were Ireland (0.7% of non-financial business economy value added in the construction of buildings sector), followed by Greece, Germany and France (all three with 1.1%). For the remaining Member States, the share of the construction of buildings sector in non-financial business economy value added ranged from 1.2% in Slovakia to 3.0% in Estonia.
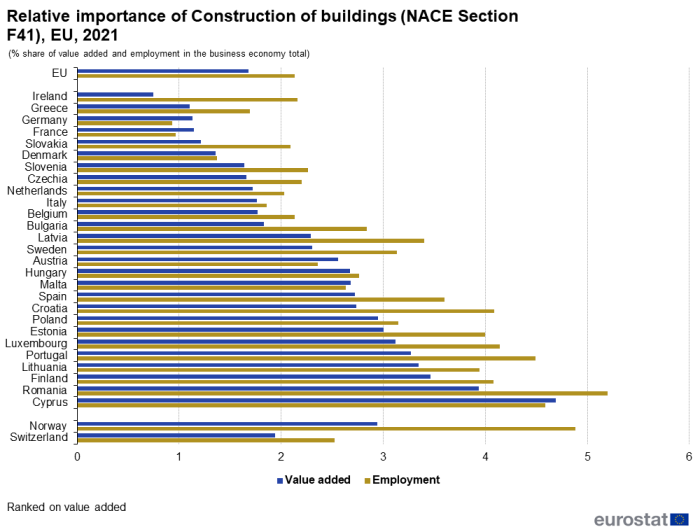
(% share of value added and employment in the non-financial business economy total)
Source: Eurostat (sbs_ovw_act)
In 2021, Germany was the largest Member State for the construction of buildings sector in value added terms, with a 19.7% share of EU value added. The top five was completed by Spain, Italy, France and the Netherlands. Spain showed the largest share of the EU's employment with 16.2%, followed by Poland, Germany, Italy and Romania. Together, the top five countries employed 54.8% of the EU's construction of buildings sector workforce.
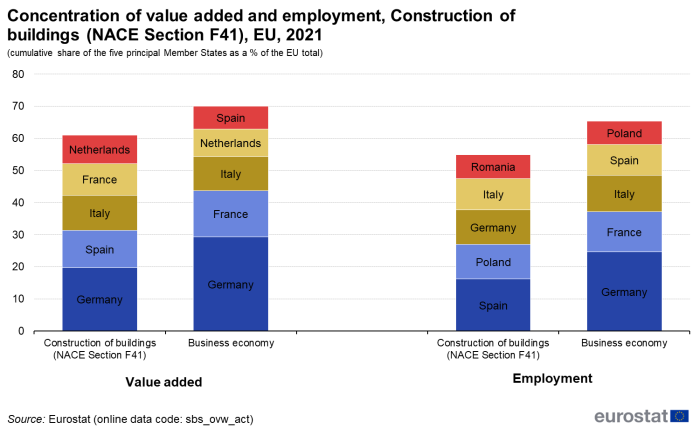
(cumulative share of the five principal Member States as a % of the EU total)
Source: Eurostat (sbs_ovw_act)
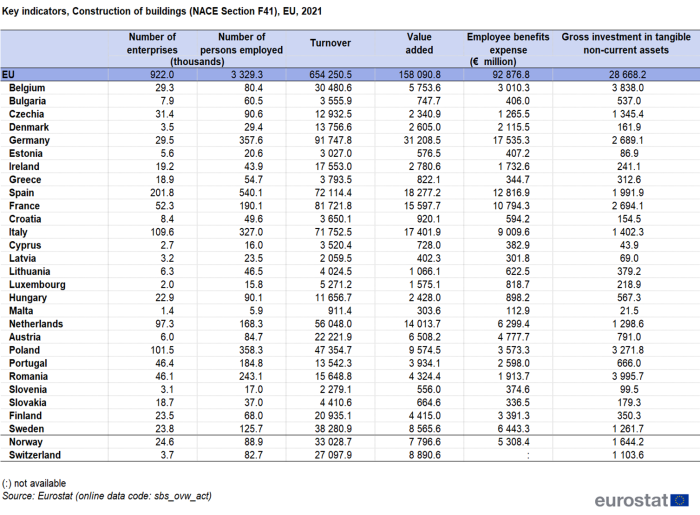
Germany recorded the highest level of value added across the EU Member States in both subsectors: construction of residential and non-residential buildings subsector (14.7%) and development of building projects (5.1%), while Cyprus was the most specialised Member State in the first one and Luxembourg in the latter one.
A wage-adjusted labour productivity ratio above 100.0% was observed in all Member State for the construction of buildings sector in 2021, indicating that the average value added generated per person employed was more than average employee benefits expense. Lowest wage-adjusted labour productivity ratios were 103.1% in Finland and 104.7% in Spain. At the other end of the ranking, the highest wage-adjusted labour productivity ratios were 232.1% in Malta, followed by 220.2% in Hungary, 214.7% in Romania and 200.9% in Poland. These four Member States, as well as Bulgaria, Germany, Cyprus, Lithuania and Luxembourg had the wage-adjusted labour productivity ratio for the construction of buildings sector above the average for the non-financial business economy.
Source: Eurostat (sbs_ovw_act)
Source: Eurostat (sbs_ovw_act)
Data sources
The analysis presented in this article is based on the main dataset for structural business statistics (SBS) and size class data, all of which are published annually.
The main series provides information for each EU Member State as well as a number of non-member countries at a detailed level according to the activity classification NACE. Data are available for a wide range of variables.
In structural business statistics, size classes are generally defined by the number of persons employed. A limited set of the standard structural business statistics variables (for example, the number of enterprises, turnover, persons employed and value added) are analysed by size class, mostly down to the three-digit (group) level of NACE. The main size classes used in this article for presenting the results are:
- small and medium-sized enterprises (SMEs): with 1 to 249 persons employed, further divided into:
- micro enterprises: with less than 10 persons employed;
- small enterprises: with 10 to 49 persons employed;
- medium-sized enterprises: with 50 to 249 persons employed;
- large enterprises: with 250 or more persons employed.
Structural business statistics also include regional data. Regional SBS data are available at NUTS levels 1 and 2 for the EU Member States, Iceland and Norway, mostly down to the two-digit (division/section) level of NACE. The main variable analysed in this article is the number of persons employed. The type of statistical unit used for regional SBS data is normally the local unit, which is an enterprise or part of an enterprise situated in a geographically identified place. Local units are classified into sectors (by NACE) normally according to their own main activity, but in some EU Member States the activity code is assigned on the basis of the principal activity of the enterprise to which the local unit belongs. The main SBS data series are presented at national level only, and for this national data the statistical unit is the enterprise. It is possible for the principal activity of a local unit to differ from that of the enterprise to which it belongs. Hence, national SBS data from the main series are not necessarily directly comparable with national aggregates compiled from regional SBS.
Context
This article presents an overview of statistics for the construction of buildings sector in the EU, as covered by NACE Rev. 2 Division 41. This division includes general construction of buildings of all kinds. It includes new work, repair, additions and alterations, the erection of pre-fabricated buildings or structures on the site and also constructions of a temporary nature. Also included are the construction of entire dwellings, office buildings, stores and other public and utility buildings, farm buildings, and so on.
The development of building projects (residential and non-residential) involves bringing together financial, technical and physical means to achieve the building projects for later sale.
The construction of buildings (residential and non-residential) includes the construction of complete buildings on own account for sale or on a fee or contract basis. Outsourcing parts or even the whole construction process is possible. All types of residential buildings and non-residential buildings are included, such as factories, workshops, assembly plants, warehouses, stores, shopping malls, hotels, restaurants, airport buildings, office buildings, hospitals, schools, religious buildings, indoor sports facilities and parking garages (including underground). Remodeling or renovating existing structures is also included.
This NACE division is composed of two groups:
- the development of building projects (Group 41.1);
- the construction of residential and non-residential buildings (Group 41.2).
The information that is presented in this article excludes the erection of complete prefabricated constructions from self-manufactured parts not of concrete (these activities form part of the wood and metal manufacturing sectors (Divisions 16 and 25 respectively)), the construction of industrial facilities except buildings (which are included within civil engineering, Division 42). Also excluded are architectural and engineering activities and project management services related to building projects (Division 71).
Direct access to
- Recent Eurostat publications on SBS
- Key figures on Europe – 2023 edition – see subchapter on Business
- Eurostat's Regional Yearbook – see chapter 8. Business
- News Release SBS – 2021 final data
Glossary
ESMS metadata files
- Structural business statistics – SBS metadata file