Social protection statistics - overview
Data extracted in June 2024.
Planned article update: May 2025.
Highlights
In 2021, expenditure on all types of social protection in the EU was equivalent to 29.9% of GDP.
In 2021, old age and sickness/healthcare together accounted for close to two thirds (66.5%) of the EU’s social protection expenditure.
In 2021, expenditure on old age pensions averaged €15 400 per beneficiary in the EU.
Social protection expenditure, 2021
This article analyses recent [1] statistics on social protection in the European Union (EU). These encompass interventions from public or private bodies intended to relieve households and individuals of the burden of a defined set of risks or needs, provided that there is neither a simultaneous reciprocal nor an individual arrangement involved. The most common risks and needs are those associated with sickness/healthcare; invalidity and disability; old age; parental responsibilities; the loss of a spouse or parent; unemployment; housing and social exclusion.
Full article
Recent developments in social protection expenditure
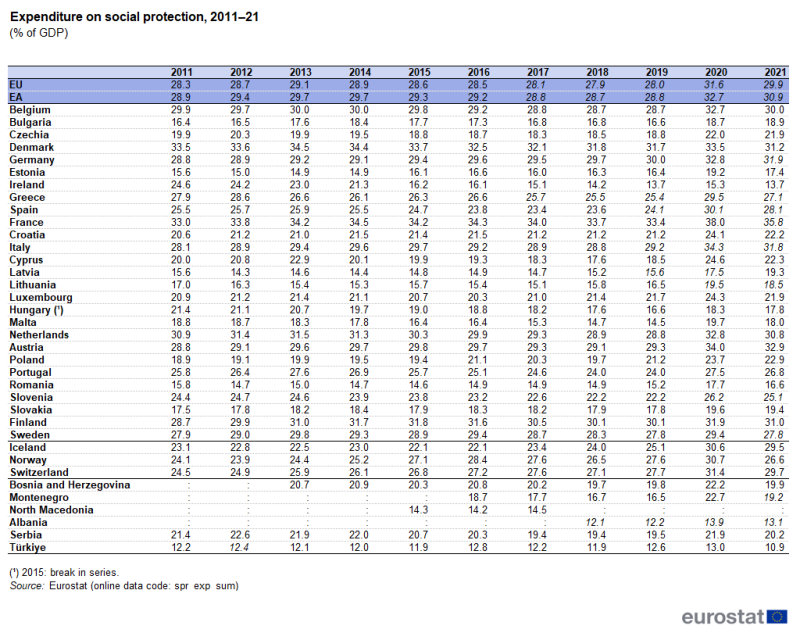
In 2021, expenditure on social protection relative to gross domestic product (GDP) was 29.9% in the EU. Across the EU countries, this ratio was highest in France (35.8%), followed by Austria (32.9%). By contrast, social protection expenditure represented 18.0% or less of GDP in Malta, Hungary, Estonia and Romania, with the lowest ratio registered in Ireland (13.7%).
In Austria and Poland, expenditure on social protection relative to GDP was, respectively, 4.1 and 4.0 percentage points higher in 2021 (the second year of the COVID-19 pandemic) than it had been in 2011 (2 years after the low point of the global financial and economic crisis). These were the largest increases recorded among any of the EU countries during this period, ahead of increases of 3.7 points in Latvia and Italy.
By contrast, 7 EU countries recorded lower ratios of social protection expenditure to GDP in 2021 when compared with 2011. The largest decrease was in Ireland, down 10.9 percentage points, reflecting in part GDP developments related to globalisation effects. Elsewhere, there were decreases of 3.6 points in Hungary (in part reflecting a break in series), 2.3 points in Denmark and less than 1.0 points in Malta, Greece, Sweden and the Netherlands.
Social protection expenditure and GDP rates of change
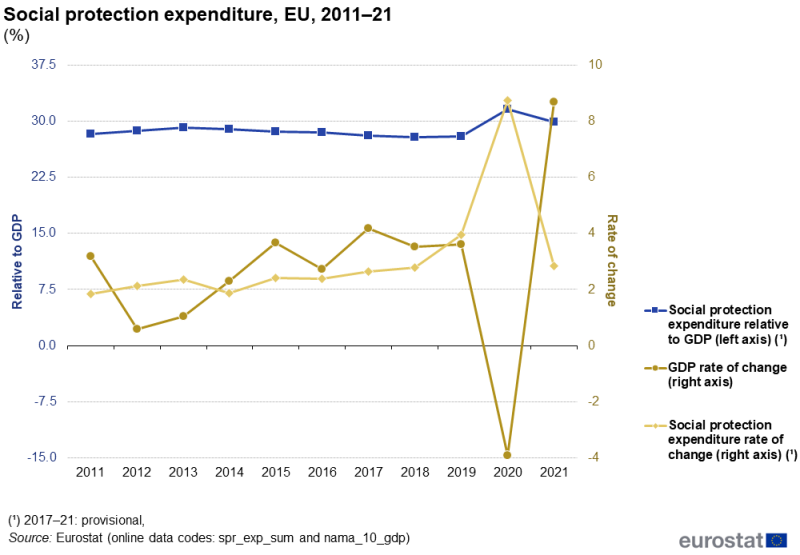
The time series in Figure 1 starts in 2011, 2 years after the low point of the global financial and economic crisis. In 2011, GDP in the EU was expanding again (in current prices) while the rate of increase in social protection expenditure was coming down from its peak. The ratio of social protection expenditure to GDP was 28.3%. This ratio remained between 27.9% and 29.1% between 2011 and 2019.
- The highest ratio during this period was recorded in 2013, as the rate of increase of social protection expenditure exceeded that of GDP by more than 1.0 percentage points for the 2nd year running.
- The lowest ratio was recorded in 2018, as the rate of increase of GDP exceeded that of social protection expenditure for the 5th consecutive year: the ratio of social protection expenditure to GDP fell a total of 1.2 percentage points between 2013 and 2018.
- In 2019, the increase in social protection expenditure was greater than that of GDP for the first time since 2013, resulting in a slight increase in the ratio; social protection expenditure was equivalent to 28.0% of GDP.
By far the largest annual changes between 2011 and 2021 in the ratio of the EU’s social protection expenditure to GDP were observed in 2020 and 2021. The ratio increased 3.6 percentage points in 2020 to 31.6%, while it decreased 1.7 points in 2021 to 29.9%. These two changes reflect the impact of the COVID-19 crisis. Despite the decrease in 2021, the ratio remained 0.8 points above the pre-COVID peak (of 29.1% in 2013).
(%)
Source: Eurostat (spr_exp_sum) and (nama_10_gdp)
Comparison of gross and net social protection benefits
The specific characteristics of national tax and benefit systems may explain some of the differences in levels of social protection benefits between EU countries, for example, the taxes and social contributions paid on benefits by beneficiaries and the extent to which social benefits are provided in the form of tax rebates or tax reductions (see the section on Data sources below for more details).
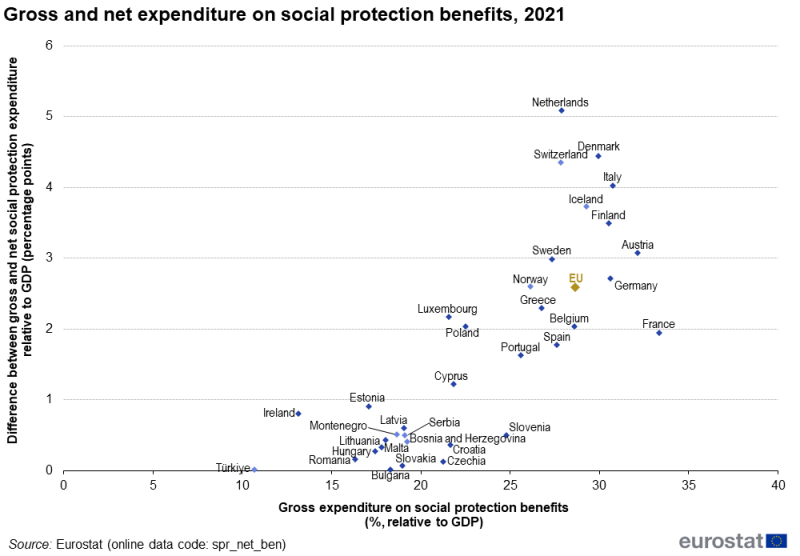
In 2021, the gap between gross and net expenditure on social protection benefits in the EU averaged 2.6% of GDP. There were notably greater gaps in some of the EU countries (see Figure 2). In the Netherlands, the gap between gross and net expenditure was 5.1 percentage points, and it was 4.4 points in Denmark, 4.0 points in Italy and 3.5 point in Finland.
Source: Eurostat (spr_net_ben)
When expenditure on social protection is expressed in relation to GDP, the difference between the highest and lowest spending EU countries was 20.2 percentage points for gross expenditure (France 33.4% and Ireland 13.2%) compared with 19.1 points for net expenditure (France 31.4% and Ireland 12.4%).
The ranking (order) of EU countries also varied somewhat, depending on whether gross or net expenditure was being considered. For example, Czechia had the 18th highest level of gross expenditure (relative to GDP) in 2021 but moved to 15th place when ranked on net expenditure. The reverse situation was observed in the Netherlands, which moved from 8th when ranked by gross expenditure down to 13th when ranked by net expenditure.
Analysis of the structure of social protection expenditure
Social protection benefits made up 95.8% of the EU’s social protection expenditure in 2021; the remaining share covered administration costs and other expenditure (see Figure 3).
- Old age and survivors’ benefits together accounted for 43.4% of total social protection expenditure, with old age benefits the largest part (38.1% of all expenditure).
- Sickness/healthcare and disability benefits together accounted for 35.0%, with sickness/healthcare the largest part (28.5% of all expenditure).
As such, the 2 largest items – old age and sickness/healthcare benefits – together accounted for 66.5% of total expenditure.

(% of total expenditure)
Source: Eurostat (spr_exp_sum)
Expenditure on pensions
Expenditure on pensions across the EU was equivalent to 12.9% of GDP in 2021. Among the EU countries, expenditure on pensions relative to GDP was highest in Greece (16.4%) and Italy (16.3%).
At the other end of the range, ratios below 8.5% were recorded in Estonia, Latvia, Bulgaria, Lithuania, Hungary and Malta, while the lowest ratio was recorded in Ireland (4.5%) – see Figure 4.
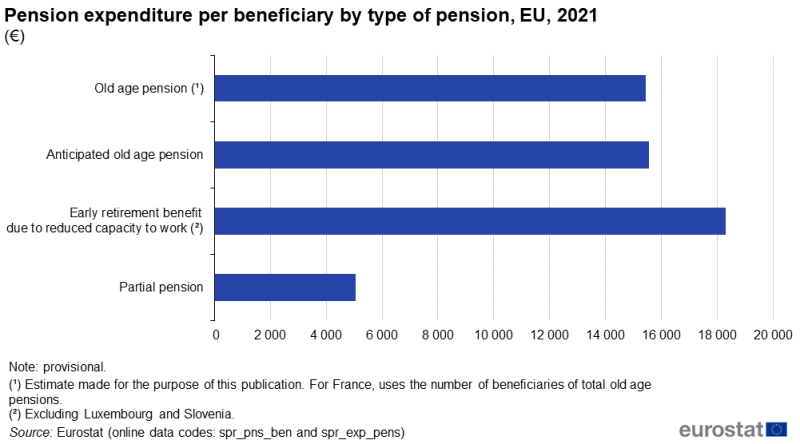
Pension expenditure per beneficiary varies according to the different types of pensions (see Figure 5). In 2021, the estimated aggregate expenditure per beneficiary on pensions relating to old age was €15 400 across the EU. This was somewhat lower than the average expenditure recorded for anticipated old age pensions (€15 600 per beneficiary) which in turn was lower than for early retirement (due to a reduced capacity to work) where expenditure averaged €18 300 per beneficiary (excluding Luxembourg and Slovenia). Expenditure on partial pensions, meanwhile, averaged €5 100 per beneficiary, much lower than for any other type of pension; this is to be expected, given that recipients of these types of pensions are also receiving income from employment.
(€)
Source: Eurostat (spr_pns_ben) and (spr_exp_pens)
It is important to note that data relating to pension expenditure per beneficiary do not necessarily reflect the level or adequacy of individual old age pensions. The figures are based on aggregate expenditure and the number of beneficiaries for a wide range of different types of pensions – granted under different circumstances and serving various distinct purposes – in each of the EU countries. Invariably, different pension schemes provide different levels of benefits, while the combinations of different pension schemes in each of the countries will have a significant influence on the figures recorded at an aggregate level. Furthermore, data on pensions refer to gross expenditure and do not take into account the effect of taxes and social contributions (where relevant), as these vary both between and within countries. For example, while all pensions may be tax free in one country, taxes may be applied to particular types of pensions in another.
In 2021, pension expenditure per beneficiary for old age pensions (the most common type of pension) varied across the EU countries from an average of €30 900 in Luxembourg to €2 700 in Bulgaria – see Figure 5 in the article on pension expenditure and beneficiaries. Comparing the data in terms of purchasing power standards (PPS) adjusts for different price levels and generally reduces the differences between countries. Average expenditure per beneficiary was highest at 20 200 PPS in Luxembourg, while the lowest level of pension expenditure per beneficiary was recorded in Bulgaria (5 200 PPS).
Social protection receipts
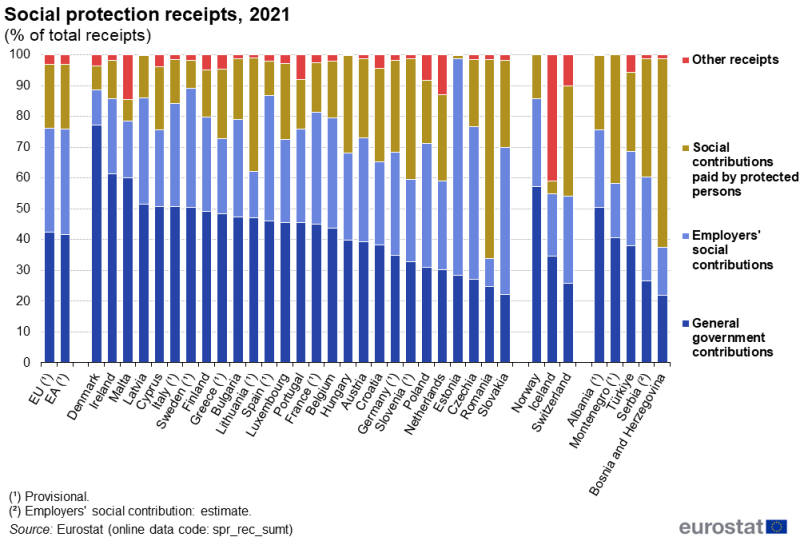
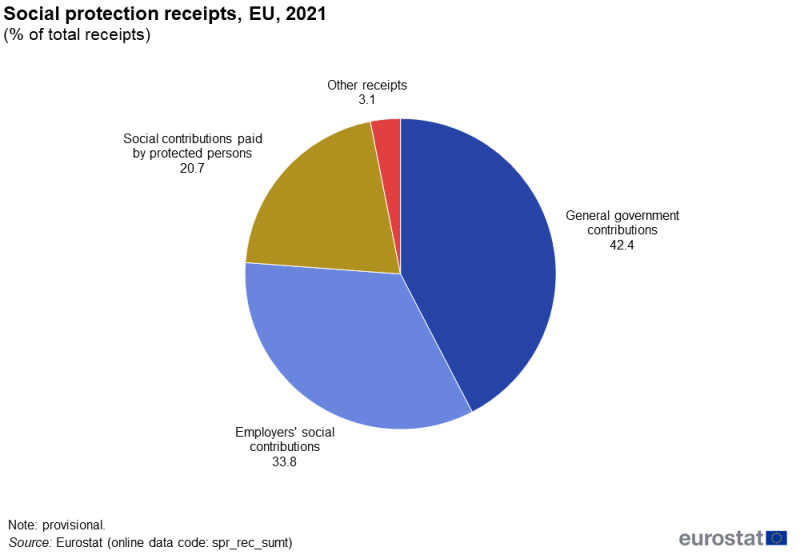
An analysis of social protection receipts across the EU in 2021 shows that the majority of receipts could be attributed to general government contributions (42.4%) and employers’ social contributions (33.8%), while around a fifth (20.7%) of social protection receipts in the EU were social contributions paid by protected people (see Figure 6).
(% of total receipts)
Source: Eurostat (spr_rec_sumt)
Social protection receipts in the EU grew from €7 500 per inhabitant to €10 100 per inhabitant between 2011 and 2021, as overall receipts rose by a total of 36.0%. The biggest change in the structure of receipts over this period was in relation to the share of general government contributions, whose share in total receipts rose from 38.6% in 2011 to 42.4% by 2021. By contrast, there was a decrease in the share of employers’ social contributions, from 36.7% to 33.8% over the same period.
The structure of receipts used to finance social protection varies and several groups of EU countries can be identified (see Figure 7).
- The largest group was composed of 21 countries where government contributions formed the largest component of receipts in 2021. In Denmark, Ireland, Malta, Latvia, Cyprus, Italy and Sweden, government contributions accounted for more than half of all receipts, with this share peaking at more than three quarters of total receipts in Denmark (77.2%).
- Social contributions – from employers or from the protected people – represented the largest component of receipts in
- Estonia (70.3%), where the contribution from employers to finance social protection accounted for more than half of all receipts, while employers also made the biggest contribution to total receipts in Czechia, Slovakia and Poland.
- Romania (64.6%), where the contributions paid by protected people accounted for more than half of all receipts, while protected people also made the biggest contribution to total receipts in Slovenia.
Note that in most of the EU countries other receipts tended to be relatively insignificant. They only contributed more than 5.0% of total social protection receipts in 4 countries, and only exceeded 10.0% in the Netherlands (13.0%) and Malta (14.6%).
Source data for tables and graphs
Data sources
Data on social protection expenditure and receipts are based on the European system of integrated social protection statistics (ESSPROS) methodology. This system has been designed to allow a comparison of social protection flows between EU countries.
In April 2007, a legal basis was established for the provision of ESSPROS with the delivery of data (for reference period T-2) to start from reference year 2007, as specified in Regulation (EC) No 458/2007. This was later supplemented by 4 European Commission implementing regulations: Regulation (EC) No 1322/2007, Regulation (EC) No 10/2008, Regulation (EU) No 110/2011 and Regulation (EU) No 263/2011.
In February 2024 an ESS agreement on early estimates for social protection expenditure main indicators was endorsed by the European Statistical System Committee (ESSC) with the purpose to improve the timeliness of a subset of social protection indicators (social protection benefits by function, provided for reference period T-1).
In 2022, Eurostat released an updated version of the ESSPROS manual and user guidelines, which provides information how to compile and use ESSPROS data.
Social protection expenditure
Expenditure on social protection includes social benefits, administration costs (which represent the costs charged to the scheme for its management and administration) and other expenditure (which consists of miscellaneous expenditure by social protection schemes, principally the payment of property income).
Social protection benefits are direct transfers, in cash or in kind, by social protection schemes to households and individuals. The purpose of these transfers is to relieve recipients of the burden of one or more of the defined risks or needs. Social protection benefits are paid to households by social security funds, other government units, non-profit institutions serving households (NPISHs), employers administering unfunded social insurance schemes, insurance enterprises, or other institutional units administering privately funded social insurance schemes. Social protection benefits are recorded without the deduction of taxes or other compulsory levies payable by recipients.
Social protection benefits are classified according to 8 social protection functions (which represent a set of risks or needs)
- sickness/healthcare benefits – including paid sick leave, medical care and the provision of pharmaceutical products
- disability benefits – including disability pensions and the provision of goods and services (other than medical care) to the disabled
- old age benefits – including old age pensions and the provision of goods and services (other than medical care) to the elderly
- survivors’ benefits – including income maintenance and support in connection with the death of a family member, such as a survivors’ pension
- family/children benefits – including support (except healthcare) in connection with the costs of pregnancy, childbirth, childbearing and caring for other family members
- unemployment benefits – including full or partial unemployment benefits as well as vocational training financed by public agencies
- housing benefits – including interventions by public authorities to help households meet the cost of housing
- social exclusion benefits not elsewhere classified (n.e.c.) – including income support, rehabilitation of alcohol and drug abusers and other miscellaneous benefits (except healthcare)
The pensions aggregate comprises part of periodic cash benefits under the disability, old age, survivors and unemployment functions. It is defined as the sum of the following social benefits: disability pensions, early retirement benefits due to reduced capacity to work, old age pensions, anticipated old age pensions, partial pensions, survivors’ pensions, and early retirement benefits for labour market reasons (see Social protection statistics – pension expenditure and pension beneficiaries for more information).
The 1st formal data collection for net social protection expenditure took place in 2012 for the reference year 2010. A so-called ‘restricted approach’ is used which means that it is strictly limited to measuring the impact of the fiscal system on gross cash benefits reported in the ESSPROS core system (benefits in kind aren’t covered). It does not, therefore, take full account of tax relief for social purposes which reduce the amount of taxes paid on other (non-benefit) income or which may be granted to people who do not receive any (cash) benefits. These types of relief are only taken into account to the extent to which they reduce the amount of taxes normally payable on cash benefits. Similarly, tax relief for social purposes which reduces indirect taxes is not accounted for. The full value of such tax relief would only be addressed by the ‘enlarged’ approach (enlarged because the population of beneficiaries is larger).
Social protection receipts
Schemes responsible for providing social protection are financed in a variety of different ways. Social protection receipts comprise social security contributions paid by employers and protected people, contributions by general government, and other receipts from various sources (for example, interest, dividends, rent and claims against 3rd parties). Social contributions by employers are all costs incurred by employers to secure entitlement to social benefits for their employees, former employees and their dependants; they can be paid by resident or non-resident employers. They include all payments by employers to social protection institutions (actual contributions) and social benefits paid directly by employers to employees (imputed contributions). Social contributions made by protected people comprise contributions paid by employees, by the self-employed and by pensioners and other people.
Implementation of ESA 2010
The European system of national and regional accounts 2010 (ESA 2010) replaced ESA 1995. This change had consequences in relation to ESSPROS results which were indirectly affected by the implementation of ESA 2010. The revision of ESSPROS data to take account of changes to national accounts methodology took place for a large majority of EU countries during the collection of data for the 2013 reference period.
Context
Social protection systems are generally well-developed across the EU: they are designed to protect (to some degree) people against the risks and needs associated with unemployment, parental responsibilities, sickness/healthcare and invalidity, the loss of a spouse or parent, old age, housing and social exclusion (not elsewhere classified).
Pension systems can play a role in allowing beneficiaries to maintain living standards they enjoyed in the later years of their working lives. However, as Europe’s population is becoming progressively older, one of the main challenges faced by social protection systems is related to their financing, as the proportion of older people continues to grow while the share of the population that is of working age decreases.
The organisation and financing of social protection systems is the responsibility of each EU country; the models used across countries are consequently different. The EU plays a coordinating role to ensure that people who move across borders continue to receive adequate protection. The EU seeks to promote actions among the countries to combat poverty and social exclusion, and to reform social protection systems on the basis of policy exchanges and mutual learning. This policy is known as the social protection and social inclusion process. The European Commission provides guidance to countries to modernise their welfare systems through the social investment package.
The main policy framework in this domain concerns the open method of coordination for social protection and social inclusion, which aims to promote social cohesion and equality, through adequate, accessible and financially sustainable social protection systems and social inclusion policies. A communication from the European Commission Working together, working better: a new framework for the open coordination of social protection and inclusion policies in the European Union (COM(2005) 706 final) outlines the objectives, which include:
- making a decisive impact on the eradication of poverty and social exclusion
- providing adequate and sustainable pensions
- ensuring accessible, high-quality and sustainable healthcare and long-term care
The European pillar of social rights sets out 20 key principles and rights to support fair and well-functioning labour markets and welfare systems. This forms part of the policy developments related to an economy that works for people, one of the European Commission’s 6 priorities for the period 2019–24. The pillar contains 3 main categories for action, one of which concerns social protection and inclusion and covers the following principles:
- Childcare and support to children – children have the right to affordable early childhood education and care of good quality; children have the right to protection from poverty; children from disadvantaged backgrounds have the right to specific measures to enhance equal opportunities.
- Social protection – regardless of the type and duration of their employment relationship, workers, and, under comparable conditions, the self-employed, have the right to adequate social protection.
- Unemployment benefits – the unemployed have the right to adequate activation support from public employment services to (re)integrate into the labour market and adequate unemployment benefits of reasonable duration, in line with their contributions and national eligibility rules; such benefits shall not constitute a disincentive for a quick return to employment.
- Minimum income – everyone lacking sufficient resources has the right to adequate minimum income benefits ensuring a life in dignity at all stages of life, and effective access to enabling goods and services; for those who can work, minimum income benefits should be combined with incentives to (re)integrate into the labour market.
- Old age income and pensions – workers and the self-employed in retirement have the right to a pension commensurate to their contributions and ensuring an adequate income; women and men shall have equal opportunities to acquire pension rights; everyone in old age has the right to resources that ensure living in dignity.
- Health care – everyone has the right to timely access to affordable, preventive and curative health care of good quality.
- Inclusion of people with disabilities – people with disabilities have the right to income support that ensures living in dignity, services that enable them to participate in the labour market and in society, and a work environment adapted to their needs.
- Long-term care – everyone has the right to affordable long-term care services of good quality, in particular home-care and community-based services.
- Housing and assistance for the homeless – access to social housing or housing assistance of good quality shall be provided for those in need; vulnerable people have the right to appropriate assistance and protection against forced eviction; adequate shelter and services shall be provided to the homeless in order to promote their social inclusion.
- Access to essential services – everyone has the right to access essential services of good quality, including water, sanitation, energy, transport, financial services and digital communications; support for access to such services shall be available for those in need.
A Eurostat social scoreboard is used to track the employment and social performances of participating EU countries. The scoreboard serves as a reference to monitor progress and to detect employment and social challenges.
Notes
- ↑ This article is based on data for the same reference year for both gross and net benefits; data for net benefits are available several months after the data for gross benefits. More recent data for gross benefits can be found in other articles on social protection and in Eurostat’s online database.
Direct access to
- Social protection expenditure (spr_expend)
- Social protection receipts (spr_receipts)
- Pensions beneficiaries (spr_pension)
- Net social protection benefits (spr_net_ben)
- Social protection methodology
- Social protection (ESMS metadata file – spr_esms)
- Regulation (EC) No 458/2007 of the European Parliament and of the Council of 25 April 2007 on the European system of integrated social protection statistics (ESSPROS).
- Commission Regulation (EC) No 1322/2007 of 12 November 2007 implementing Regulation (EC) No 458/2007 of the European Parliament and of the Council on the European system of integrated social protection statistics (ESSPROS) as regards the appropriate formats for transmission, results to be transmitted and criteria for measuring quality for the ESSPROS core system and the module on pension beneficiaries.
- Commission Regulation (EC) 10/2008 of 8 January 2008 implementing Regulation (EC) No 458/2007 of the European Parliament and of the Council on the European system of integrated social protection statistics (ESSPROS) as regards the definitions, detailed classifications and updating of the rules for dissemination for the ESSPROS core system and the module on pension beneficiaries.
- Commission Regulation (EU) No 110/2011 of 8 February 2011 concerning the appropriate formats for the transmission of data, the results to be transmitted and the criteria for measuring quality for the ESSPROS module on net social protection benefits.
- Commission Regulation (EU) No 263/2011 of 17 March 2011 concerning the launch of full data collection for the ESSPROS module on net social protection benefits.
