SDG 7 - Affordable and clean energy
Ensure access to affordable, reliable, sustainable and modern energy for all
Data extracted in April 2024.
Planned article update: June 2025.
Highlights

This article is a part of a set of statistical articles, which are based on the Eurostat publication ’Sustainable development in the European Union — Monitoring report on progress towards the SDGs in an EU context — 2024 edition’. This report is the eighth edition of Eurostat’s series of monitoring reports on sustainable development, which provide a quantitative assessment of progress of the EU towards the SDGs in an EU context.
SDG 7 calls for ensuring universal access to affordable, reliable and sustainable energy. This includes improving energy efficiency, increasing the share of renewables and further diversifying the energy mix while ensuring affordability of energy for all.
Full article
Affordable and clean energy in the EU: overview and key trends
In everyday life, our well-being and the workings of the economy depend on reliable, affordable and sustainable energy services, such as electricity supply, heating and cooling, and transport services. Monitoring SDG 7 in an EU context involves looking at developments in energy consumption, energy supply and access to affordable energy. As illustrated by the figure on the right, trends for the EU over the five-year period assessed have overall been slightly unfavourable, mainly due to significant impacts on energy imports and increased energy prices following Russia’s war of aggression against Ukraine. While energy consumption has kept falling, the EU needs to speed up progress in light of the new 2030 targets adopted in September 2023. At the same time, energy productivity continued to develop favourably throughout the EU, resulting in a further decoupling of economic growth from energy consumption. In the area of energy supply, the EU has made progress towards the new 2030 target for renewable energy, but the pace needs to accelerate to reach a 42.5 % share. Besides diversification of gas supply, energy import dependency rose strongly in 2022, which was mainly due to refilling of stocks which were particularly low at the end of 2021. Access to affordable energy saw a strong backslide in 2022 as a result of energy price hikes. The EU has taken action to secure energy supply and affordability.
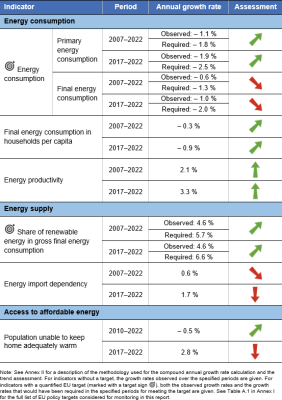
Table 1: Indicators measuring progress towards SDG 7, EU
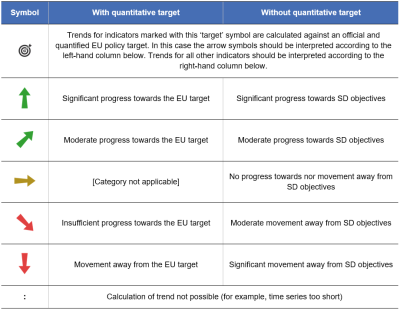
Table 2: Explanation of symbols for indicating progress towards SD objectives and targets


Energy consumption
Increasing energy efficiency is one of the main pillars for achieving an affordable, reliable, sustainable and modern energy system as envisaged in SDG 7. Efficient energy systems reduce consumption and costs, decrease energy dependencies and diminish the environmental and climate impacts linked to energy supply and use. The EU consequently aims to improve energy efficiency along the whole energy supply chain implementing ‘energy efficiency first’ as a principle of EU energy policy.
Energy consumption has declined but significant further reductions are needed to meet the 2030 target
The EU aims to reduce its energy consumption by at least 11.7 % by 2030, compared to the 2020 reference scenario projection. Translated into absolute levels, this means that the EU should consume no more than 992.5 million tonnes of oil equivalent (Mtoe) of primary and 763 Mtoe of final energy by 2030.
The EU’s primary energy consumption has seen a general downward trend since 2007, reaching 1 257.1 Mtoe in 2022, which is a 15.6 % reduction over the past 15 years. In comparison, final energy consumption has fallen to 940.5 Mtoe or 8.6 % over the same period. The difference in primary and final energy reductions can be mainly traced back to more efficient energy production and the switch to renewable energies [1]. Long-term progress on both fronts was mainly driven by energy policies supporting efficiency improvements across all sectors, particularly buildings, electric appliances and industrial installations.
The short-term trend has been influenced by a remarkable drop in energy consumption of more than 8 % in 2020 compared with 2019, mainly as a result of measures taken to tackle the COVID-19 pandemic. When excluding this year as an exemption from past trends, the EU’s energy consumption has seen a steady decline since 2017. Overall, the EU’s primary energy consumption fell by 9.2 % between 2017 and 2022, while final consumption decreased by 5.0 %. The reduction was particularly strong in 2022, with primary consumption falling by 4.1 % and final consumption by 2.8 % compared with 2021. Nevertheless, additional improvements in energy efficiency and consumption patterns are necessary to ensure the EU meets both of its stricter 2030 energy consumption targets.
EU citizens’ energy consumption at home has slightly fallen since 2017
Households account for about a quarter of final energy consumption. At home, people use energy in particular for heating, cooling, cooking, lighting, sanitation and appliances. The level of household energy consumption mainly depends on outdoor temperatures, energy performance of buildings, use and efficiency of electrical appliances, and behaviour and economic status of inhabitants (for example, their desired or affordable level of thermal comfort, frequency of clothes washing, use of TV-sets, games and lighting preferences).
Household energy consumption has slightly decreased since 2017, reaching 542 kilograms of oil equivalent (kgoe) per EU inhabitant in 2022. This was 4.4 % less than in 2017. A large drop of 7.7 % occurred in 2022 compared with 2021, mainly due to a comparably warmer spring and winter in 2022 [2]. The data show some annual variability that depends mainly on the weather conditions during winter, as more than 60 % of energy is used for heating [3].
When viewed over the longer term, efficiency improvements, in particular in space heating, seem to have balanced the effect of population growth and increases in the number and size of dwellings. Since 2007, energy consumption per EU inhabitant has fallen by 4.7 %, with a slight downward trend in total household energy consumption offsetting a 2.2 % or 9.8 million increase in the population over the same period [4].
The EU has increased its energy productivity
Recent trends in Europe point to a decoupling of economic growth from energy consumption, which is measured here using gross domestic product (GDP) and gross available energy (GAE) respectively. Between 2007 and 2022, GAE fell by 15.4 % and thus by a similar amount to primary energy consumption. Over the same period, real GDP grew by 16.5 % [5]. As a result, energy productivity — which measures GDP per unit of energy input — increased almost continuously from EUR 6.8 per kgoe in 2007 to EUR 9.3 per kgoe in 2022. The improvement in energy productivity was particularly strong in 2022, by 8.4 %, due to a marked decrease in GAE alongside continued GDP growth.
Energy supply
To achieve a clean and secure energy system, the EU is aiming to increase the share of renewable energy in gross final energy consumption to 42.5 % by 2030, with an additional 2.5 % indicative top-up that would allow the EU to reach 45 %. Most renewable energy sources are considered to be practically inexhaustible or renewable within a human lifetime. In contrast, fossil energy sources regenerate over millions of years and are the main source of man-made greenhouse gas (GHG) emissions, and therefore contribute significantly to the climate crisis. In addition, fossil fuels such as natural gas and crude oil are mainly imported from outside the EU. This dependence exposes consumers to significant costs and to the risk of supply shortages, as shown by the reduction in natural gas and crude oil deliveries from Russia. The risks increase as dependency on a single country grows. Therefore, the EU is seeking to increase domestic energy production, particularly from renewable energy sources, as well as reduce its energy consumption, and build and update infrastructure to allow clean energy to be distributed across Member States. The EU has also introduced legislation and sustainability criteria to address the negative impacts of certain renewable energy sources such as hydropower and biomass on other SDGs such as health, water and marine and terrestrial ecosystems [6].
The share of renewables has kept rising in the EU, but stronger growth still remains vital to meet the 2030 target
Use of renewable energy has grown more or less steadily in the EU, almost doubling from 11.7 % of gross final energy consumption in 2007 to reach 23.0 % in 2022. Reductions in investment costs due to economies of scale and greater competition, more efficient technologies, supply chain improvements and renewable energy support schemes have driven this growth [7]. Nevertheless, an even faster growth will be needed in the EU in the coming years to meet the 42.5 % target in 2030.
The share of renewable energy grew in all three of the areas monitored here, namely electricity generation, heating and cooling, and transport. The share of renewables in electricity generation experienced the most pronounced growth, reaching 41.2 % in 2022. The shares of renewables in heating and cooling and in transport were somewhat lower, at 24.9 % and 9.6 % in 2022, respectively. Still, additional efforts are required across all of these sectors to scale up the use of renewable energies.
Looking at specific renewable energy sources, the largest share of available renewable energy in 2022 came from solid biofuels (40.2 %), followed by wind energy (14.5 %) and hydropower (9.5 %). Wind and solar photovoltaic energy made the biggest contribution to the absolute increase in renewable energy production between 2017 and 2022. Solar photovoltaic energy production doubled and heat pumps energy production increased by almost 50 %, meaning these two sources saw the largest percentage increase over the period [8].
Energy import dependency increased with refilling of stocks
Despite continuous growth in renewable energy sources within the EU over the past decade, fuel imports from non-EU countries remained an important energy source for the EU in 2022, contributing to 62.5 % of gross available energy (GAE) — as measured by net imports (imports minus exports). Net imports were highest for oil and petroleum products (97.7 % imported) and natural gas (97.6 % imported), followed by solid fuels (predominantly coal) (45.8 % imported). Net imports of renewable energy including biofuels accounted for 2.8 % of gross available renewable energy in 2022 and just 0.8 % of total net imports [9].
The EU’s share of net imports of energy had remained relatively stable at around 55 % until 2021, which can be explained by two opposing developments. On the one hand, the EU reduced its energy consumption and increased its use of domestic renewables. On the other hand, it reduced its primary production of fossil fuels because of exhausted or uneconomical domestic sources, particularly natural gas and crude oil [10]. Between 2021 and 2022, however, energy import dependency increased strongly by 7.0 percentage points. This development was mainly driven by a need to increase stocks. As the amount of stored natural gas and oil had been relatively low towards the end of 2021, countries took action in 2022 to refill storage sites for securing energy supply [11].
Despite strong cuts in EU imports, Russia was still the main supplier of energy to the EU in 2022, accounting for 22.6 % of gas, 20.8 % of petroleum product and 23.1 % of solid fuel imports from outside the EU. These shares are significantly lower than in 2021, particularly for gas and solid fuels. From 2021 to 2022, EU imports of these energy carriers from Russia were almost halved, with a reduction of 45 % [12]. This follows Russia’s cuts in gas supplies to the EU and the EU accelerating its phase out of Russian fossil fuels while increasing its diversification efforts. The EU set a ban on nearly 90 % of Russian oil imports to Europe, which took effect in December 2022 for seaborne crude oil and in February 2023 for refined petroleum products. Moreover, coal sanctions were put in place in April 2022 and took effect in August 2022 [13].
The second largest EU imports of gas and petroleum products came from European countries outside the EU (mainly Norway and the UK), which supplied 20.5 % of gas and 17.1 % of petroleum imports. For solid fuels, the second largest source was North America, which supplied 20.0 % [14]. All percentages reported here refer to shares of total imports from outside the EU only, so do not account for energy traded between Member States.
In 2022, all Member States were net importers of energy, with 18 importing more than half of their total energy consumption from other countries (EU countries and non-EU countries). Countries which imported almost all of their energy in 2022 included the island countries Malta (99.0 %) and Cyprus (92.0 %), along with Luxembourg (91.3 %). Luxembourg’s high import dependency mainly results from significant fuel sales to foreign commuters and transit traffic [15].
Access to affordable energy
SDG 7 emphasises the need for affordable energy for reasons of social equality and justice. Principle 20 of the European Pillar of Social Rights also places energy among the essential services everyone should have access to. The inability to keep the home adequately warm is a survey-based indicator used to monitor access to affordable energy throughout the EU. A lack of access to affordable energy is strongly associated with low levels of income in combination with high expenditure on energy and poor building efficiency standards [16].
The share of people reporting to be without affordable access to heating rose strongly in 2022
Between 2012 and 2021, the EU made progress on improving access to affordable energy, with the share of the population unable to keep the home adequately warm falling from 11.2 % to 6.9 %. However, in 2022, the natural gas and electricity price spikes following cuts in Russian energy supplies impacted the financial ability of households to pay for their energy bills. Consequently, the share of the EU population reporting that they are unable to keep their home adequately warm rose strongly to 9.3 %.
People with an income below the poverty threshold are more likely to report an inability to keep their home adequately warm. In 2022, 20.1 % of people from this group reported to be without affordable access to heating, compared with 7.2 % of people with an income above the poverty threshold.
Lack of adequate warmth appeared to be a problem particularly in southern and south-eastern Europe. This distribution can be traced mainly to poor building energy efficiency, including the lack of suitable heating systems and insulation, leading to higher heating costs. Northern and most western European countries, where colder winters can be expected, had the lowest shares of people without affordable access to heating.
Main indicators
Definitions of energy terms/concepts
A variety of energy indicators are used to measure energy consumption at different stages of the supply chain and progress towards the EU energy targets. The following box explains the indicators and the differences between them.
Gross available energy (GAE): represents a country’s total energy demand. It is defined as: primary production + recovered/recycled products + imports – exports + stock changes.
Gross inland energy consumption (or gross inland consumption; GIC): represents energy demand including international aviation but excluding maritime bunkers. It is defined as: gross available energy – international maritime bunkers.
Total energy supply: represents the total energy delivered and/or consumed in a country excluding deliveries to international aviation and international marine bunkers. It is defined as: gross inland energy consumption – international aviation.
Primary energy consumption (PEC): represents a country’s total energy demand including consumption of the energy sector itself, losses during transformation and distribution, and the final consumption by end users. This means it excludes, for example, natural gas used in non-energy products, such as chemicals. It is defined as: gross inland energy consumption – non-energy use of energy carriers.
Primary energy consumption (2020–2030): measures the progress towards the EU’s 2020 and 2030 energy efficiency targets. It deviates from primary energy consumption only in that it excludes ambient heat. It is defined as: primary energy consumption – gross inland consumption of ambient heat (heat pumps).
Gross final energy consumption (or gross energy consumption): is the basis for measuring the share of renewable energies according to Directive 2009/28/EC on the promotion of renewable energies. It represents the energy commodities delivered for energy purposes to industry, transport, households, services including public services, agriculture, forestry and fisheries, the consumption of electricity and heat by the energy branch for electricity, heat and transport fuel production, and losses of electricity and heat in distribution and transmission.
Final energy consumption (FEC) (or final consumption – energy use): measures a country’s energy use by end users, such as households, industry and transport. It excludes the energy used by the energy sector itself and losses incurred during energy transformation and distribution and any non-energy use of energy carriers. It is defined as: primary energy consumption – consumption by the energy sector – transformation/distribution losses – statistical differences.
Final energy consumption (2020–2030): measures the progress towards the EU’s 2020 and 2030 energy efficiency targets. It deviates from final energy consumption by excluding ambient heat and including international aviation and energy consumption of blast furnaces. It is defined as: final energy consumption – final energy consumption of ambient heat (heat pumps) + international aviation + transformation input blast furnaces (all products) – transformation output blast furnaces (all products) + energy sector blast furnaces (all fossil fuels).
Energy consumption

This indicator measures a country’s total energy needs excluding all non-energy use of energy carriers (such as natural gas used for producing chemicals rather than for combustion). Primary energy consumption represents a country’s total energy demand before any energy transformation, excluding energy carriers used for non-energy purposes. In comparison, final energy consumption covers the energy consumed by end users, such as industry, transport, households, services and agriculture.

Note: y-axis does not start at 0.
Source: Eurostat (sdg_07_10) and (sdg_07_11)

Source: Eurostat (sdg_07_10)
.png)
Source: Eurostat (nrg_bal_s)
).png)
Source: Eurostat (nrg_bal_s)
Final energy consumption in households per capita

This indicator measures how much energy each citizen consumes at home, excluding transport. Data are not temperature-adjusted, so variations from year to year are due in part to weather.
.png)
Note: y-axis does not start at 0.
Source: Eurostat (sdg_07_20)

Source: Eurostat (sdg_07_20)
Energy productivity

This indicator measures the amount of economic output produced per unit of gross available energy (GAE). Gross available energy represents the quantity of energy products needed to satisfy all demand of entities in the geographical area under consideration. Economic output is either given as euros in chain-linked volumes to the reference year 2010 at 2010 exchange rates or in the unit PPS (purchasing power standards).

Note: y-axis does not start at 0.
Source: Eurostat (sdg_07_30)

Source: Eurostat (sdg_07_30)

This indicator is defined as the share of renewable energy consumption in gross final energy consumption, according to the Renewable Energy Directive. The gross final energy consumption is the energy used by end consumers plus grid losses and power plants’ own consumption.

Source: Eurostat (sdg_07_40)

Source: Eurostat (sdg_07_40)
Energy import dependency

Energy import dependency shows the share of a country’s total energy needs that are met by imports from other countries. It is calculated as net imports divided by the gross available energy (GAE). Energy import dependency = (imports – exports) / gross available energy.

Note: y-axis does not start at 0.
Source: Eurostat (sdg_07_50)

Source: Eurostat (sdg_07_50)
Population unable to keep home adequately warm

This indicator measures the share of people unable to afford to keep their home adequately warm. The data are collected as part of the EU Statistics on Income and Living Conditions (EU-SILC) to monitor the development of poverty and social inclusion in the EU. Data collection is based on a survey, which means that indicator values are self-reported.

Note: y-axis does not start at 0.
Source: Eurostat (sdg_07_60)

Source: Eurostat (sdg_07_60)
Direct access to
More detailed information on EU SDG indicators for monitoring of progress towards the UN Sustainable Development Goals (SDGs), such as indicator relevance, definitions, methodological notes, background and potential linkages can be found in the introduction as well as in Annex II of the publication ’Sustainable development in the European Union — Monitoring report on progress towards the SDGs in an EU context — 2024 edition’.
Further reading on affordable and clean energy
- European Commission, Energy.
- European Commission (2022), State of the Energy Union 2021 – Contributing to the European Green Deal and the Union’s, COM/2022/547 final, Brussels.
- EEA (2023), Trends and projections in Europe 2023, Report No. 07/2023, European Environment Agency, Publications Office of the European Union, Luxembourg.
- European Social Policy Network (2020), Access to essential services for people on low incomes in Europe. An analysis of policies in 35 countries, European Commission, Brussels.
Further data sources on affordable and clean energy
Notes
- ↑ The substitution of fossil energy by renewable energies leads to a reduction of PEC via a statistical definition. The physical energy content method basically means fossil and biogenic fuel input quantities are multiplied by their calorific value. Wind, hydropower or photovoltaics produce energy with 100 % efficiency, geothermal energy with 10 % and nuclear energy with 33 %. This means that PEC decreases disproportionately with increasing substitution of fossil and nuclear fuels by renewable energies.
- ↑ Source: Eurostat (nrg_chdd_a).
- ↑ Source: Eurostat (nrg_d_hhq).
- ↑ Source: Eurostat (demo_gind).
- ↑ Source: Eurostat (nrg_bal_s) and (nama_10_gdp).
- ↑ See for example Sayed, E. T. et al. (2021), A critical review on environmental impacts of renewable energy systems and mitigation strategies: Wind, hydro, biomass and geothermal, Science of the Total Environment, Volume 766; or Best, A., et al. (2021), Assessment of resource nexus-related challenges and opportunities in the context of the European Green Deal. Background report for the EEA Briefing "Applying a 'resource nexus' lens to policy: opportunities for increasing coherence".
- ↑ European Commission (2022), 2022 Report on the Achievement of the 2020 Renewable Energy Targets.
- ↑ Source: Eurostat (nrg_bal_c).
- ↑ Source: Eurostat (nrg_bal_s).
- ↑ Source: Eurostat (nrg_bal_s).
- ↑ Source: Eurostat (nrg_bal_s); European Council (2024), Infographic - How much gas have the EU countries stored?; Source: Eurostat (nrg_stk_oem).
- ↑ Source: Eurostat (online data codes: (nrg_ti_sff), (nrg_ti_oil) and (nrg_ti_gas)). Import shares for natural gas were calculated in cubic meters; solid fuel and oil import shares were calculated in tonnes.
- ↑ European Council (2023), Council Decision 2014/512/CFSP of 31 July 2014 concerning restrictive measures in view of Russia's actions destabilising the situation in Ukraine (latest amendment in 2023); and European Council (2024), EU sanctions against Russia explained.
- ↑ Source: Eurostat (online data codes: (nrg_ti_sff), (nrg_ti_oil) and (nrg_ti_gas)). Import shares for natural gas were calculated in cubic meters; solid fuel and oil import shares were calculated in tonnes.
- ↑ Ministry of the Environment, Climate and Biodiversity (2023), Eighth National Communication of Luxembourg under the United Nations Framework Convention on Climate Change. Annex: Fifth Biennial Report of Luxembourg under the United Nations Framework Convention on Climate Change.
- ↑ European Commission (2020), Commission Recommendation on Energy Poverty, COM(2020) 1563, Brussels.