Technology in European Neighbourhood East countries
Data extracted in February 2024.
Planned article update: March 2025.
Highlights
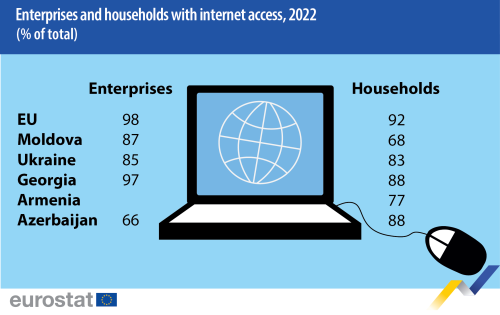
In 2022, 88% of the households in the European Neighbourhood Policy-East countries Georgia and Azerbaijan had access to the internet. This was close to the EU average of 92%.
Over one third of enterprises had their own website in the European Neighbourhood Policy-East countries Georgia (37.1%; 2019), Moldova (35.7%) and Ukraine (35.3%; 2021) in 2022. In comparison, more than three quarters (78.1%) of enterprises in the EU had their own website.
In the European Neighbourhood Policy-East countries Azerbaijan and Ukraine, 90.1% and 87.2%, respectively, of the population aged 15 years or more used the internet daily in 2022. This was higher than in the EU (85.9%).
Source: Eurostat (isoc_ci_in_en2), (isoc_ci_in_h) and (enpe_isoc_ci_in_h) and Eurostat data collection.
This article is part of an online publication; it presents information for five European Neighbourhood Policy-East (ENP-East) countries, namely, Armenia, Azerbaijan, Georgia, Moldova and Ukraine, compared with the European Union (EU). Moldova, Georgia and Ukraine are also candidate countries, the European Council granting Moldova and Ukraine candidate status on 23 June 2022 and Georgia on 14 December 2023. This article does not contain any data on Belarus, as statistical cooperation with Belarus has been suspended as of March 2022.
Data shown for Georgia exclude the regions of Abkhazia and South Ossetia over which the government of Georgia does not exercise control. The data managed by the National Bureau of Statistics of the Republic of Moldova does not include data from the Transnistrian region over which the government of the Republic of Moldova does not exercise control. Since 2014, data for Ukraine generally exclude the illegally annexed Autonomous Republic of Crimea and the City of Sevastopol and the territories which are not under control of the Ukrainian government. The latest statistics in this article cover the calendar year 2021, before Russia’s war of aggression against Ukraine. Data on Ukraine for the year 2021 is limited due to exemption of reporting unit under the martial law from mandatory data submission to the State Statistics Service of Ukraine, effective as of 3 March 2022.
The article presents a range of information and communication technology (ICT) indicators such as percentage of internet access, telephone penetration rate and gross domestic expenditure on R&D by source of funds.
Full article
Enterprises and households with internet access
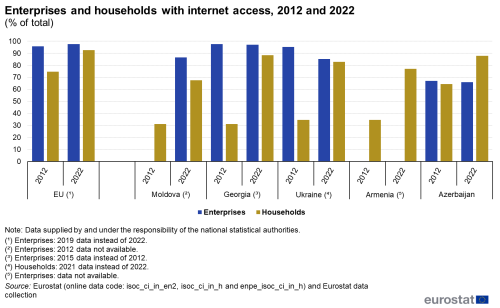
The data presented in Figure 1 underlines the evolving landscape of internet access in various countries, highlighting significant progress and variations in connectivity over the decade. Moldova experienced significant growth in household internet accessibility between 2012 and 2022, from 31 % to 68 %. While data for enterprises in 2012 is unavailable, internet access for enterprises was at 87 % in 2022.
In 2015 (no 2012 data available), 98 % of enterprises and 31 % of households had internet access in Georgia. In 2022, enterprise access remained high at 97 %, while household access increased significantly to 88 %.
Ukraine's internet access landscape showed varied changes during the period. In 2012, 95 % of enterprises and 35 % of households had internet access. However, by 2021 (no 2022 data available), enterprise access slightly declined to 85 %, while household access notably increased to 83 %.
Armenia's internet access data for enterprises is not available for both 2012 and 2022. Household internet access was at 35 % in 2012 and more than doubled to 77 % in 2022.
Azerbaijan witnessed relatively stable enterprise internet access between 2012 and 2022, with 67 % and 66 % respectively. Meanwhile, household internet access increased from 64 % in 2012 to 88 % in 2022, demonstrating substantial growth in connectivity.
In the EU, internet access witnessed a notable increase over the decade. In 2012, 96 % of enterprises and 75 % of households had internet access. These figures rose to 98 % for enterprises in 2019 (no 2022 data available) and 92 % for households in 2022, reflecting an upward trend in internet connectivity.
(% of total)
Source: Eurostat (isoc_ci_in_en2), (isoc_ci_in_h), (enpe_isoc_ci_in_h) and Eurostat data collection.
Telephone penetration rate by mode
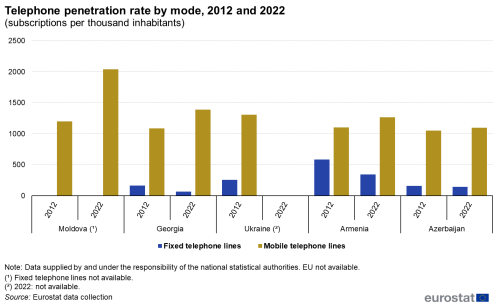
The data provided in Figure 2 presents the dynamic shifts in telephone penetration rates over the decade, with mobile subscriptions witnessing substantial growth, while fixed telephone lines exhibit varying trends across different regions.
Telephone penetration rate is represented by the number of fixed telephone lines and mobile subscriptions per thousand inhabitants.
In Moldova, data for fixed telephone lines is unavailable for 2012 and 2022. The penetration rate for mobile subscriptions increased from 1 197 to
2 040 per thousand inhabitants between 2012 and 2022. The high number of subscriptions per inhabitant could be due to mobile users having more than one subscription in order to meet various personal or work-related needs, for example having separate private and professional subscriptions and/or having additional subscriptions to supplement with additional data capacity, or it could result from a change in subscriptions accounting for two different subscriptions within a single year.
Georgia showed a substantial change in telephone penetration rates between 2012 and 2022. In 2012, the penetration rate for fixed telephone lines was 162 per thousand inhabitants, while for mobile subscriptions it stood at 1 088. By 2022, the penetration rate for fixed telephone lines decreased to 67, whereas mobile subscriptions penetration increased significantly to 1 389.
In 2012, Ukraine showed a penetration rate of 258 per thousand inhabitants for fixed telephone lines and 1 308 per thousand inhabitants for mobile subscriptions. Data are not available for 2022.
In Armenia, the penetration rate for fixed telephone lines was 583 per thousand inhabitants, and for mobile subscriptions 1 099 in 2012. By 2022, there was a decline in the number of fixed telephone lines to 342 per thousand inhabitants, while mobile subscriptions increased to 1 267 per thousand inhabitants.
Azerbaijan showed a decrease in the penetration rate for fixed telephone lines from 159 per thousand inhabitants in 2012 to 144 in 2022. For mobile subscriptions, there was an increase from 1 050 per thousand inhabitants in 2012 to 1 096 in 2022.
Data for the EU are not available.
Enterprises using ICT
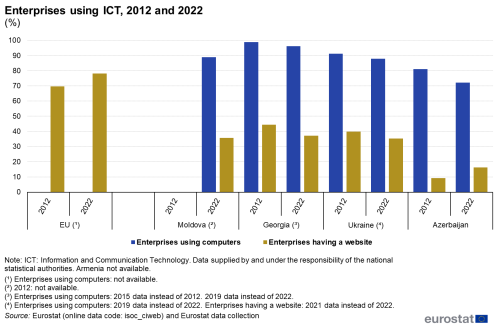
The data provided in Figure 3 presents the varying trends in Information and Communication Technology (ICT) adoption among enterprises, reflecting changes in technological use and digital presence.
(%)
Source: Eurostat (isoc_ciweb) and Eurostat data collection.
The percentage of enterprises using computers in Moldova reached 88.9 % in 2022 while the percentage of enterprises having a website was at 35.7 % in 2022. Data are not available for 2012.
Georgia showed a decrease in both categories between 2015 and 2019 (2012 and 2022 data not available). In 2015, 98.9 % of enterprises used computers, while they were 96.2 % in 2019. Similarly, the percentage of enterprises having a website decreased from 44.3 % in 2015 to 37.1 % in 2019.
In Ukraine, there was a decline in the percentage of enterprises using computers from 91.1 % in 2012 to 87.9 % in 2019 (no 2022 data available). Similarly, the percentage of enterprises having a website decreased from 39.8 % in 2012 to 35.3 % in 2021 (no 2022 data available).
Azerbaijan showed a decrease in the percentage of enterprises using computers from 81.1 % in 2012 to 72.2 % in 2022. By contrast, the percentage of enterprises having a website increased from 9.2 % in 2012 to 16.2 % in 2022.
In the EU, the percentage of enterprises having a website increased from 69.7 % in 2012 to 78.1 % in 2022. Data for enterprises using computers are not available.
Data for Armenia is not available for both categories.
Persons using the internet by frequency of use
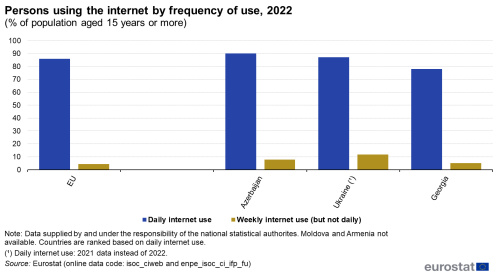
The data provided in Figure 4 shows the frequency of internet usage among population aged 15 years or more, highlighting variations in internet access and usage patterns.
(% of population aged 15 years or more)
Source: Eurostat (isoc_ciweb) and Eurostat (enpe_isoc_ifp_fu)
In 2022, Azerbaijan showed the highest frequency of internet usage amongst the countries available, with 90.1 % of the population using it daily and 7.8 % using it on a weekly basis but not daily.
In Ukraine, the percentage of daily internet users was at 87.2 % in 20221 (no 2022 data available), with 11.8 % using it on a weekly basis but not daily.
Georgia had the lowest proportion of daily internet users among the countries available, with 78.0 % of the population using it daily and 5.2 % using it on a weekly basis but not daily.
Data for Armenia and Moldova are not available.
In the EU, 85.9 % of the population aged 15 years or more, reported using the internet on a daily basis, while 4.4 % reported using it on a weekly basis but not daily.
Use of ICT skills by type
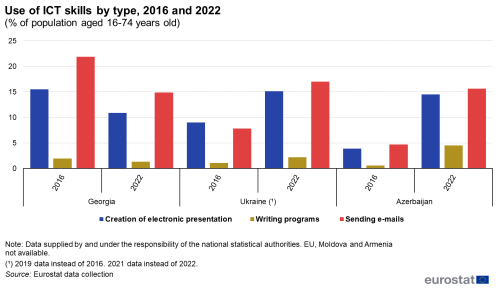
Figure 5 illustrates the changing trends in ICT skills usage among the population aged 16-74 years old, reflecting evolving technological adoption and proficiency levels over the years.
Georgia recorded a decline in the percentages of the population engaged in ICT activities between 2016 and 2022. In 2016, 15.5 % were involved in the creation of electronic presentations, 2.0 % in writing programs, and 21.9 % in sending e-mails. By 2022, these percentages decreased to 10.9 %, 1.3 % and 14.9 %, respectively.
In Ukraine, there was an increase in the percentages of the population engaging in ICT activities between 2019 and 2021 (no 2016 and 2022 data available). In 2019, 9.0 % were involved in the creation of electronic presentations, 1.1 % in writing programs and 7.8 % in sending e-mails. By 2022, these percentages rose to 15.1 %, 2.2 % and 17.0 %, respectively.
In Azerbaijan, there was a notable increase in the percentages of the population engaged in ICT activities between 2016 and 2022. In 2016, 3.9 % were involved in the creation of electronic presentations, 0.6 % in writing programs and 4.7 % in sending e-mails. By 2022, these percentages increased to 14.5 %, 4.5 % and 15.6 %, respectively.
Data for the EU, Armenia and Moldova are not available.
Gross domestic expenditure on R&D by source of funds
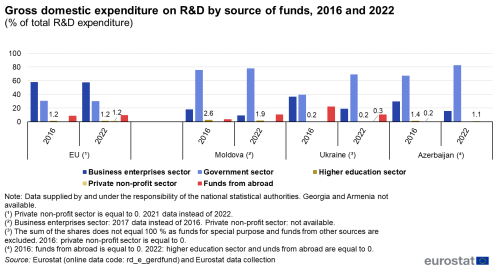
The data presented in Figure 6 reflects changes in the distribution of R&D expenditure across different sectors between 2016 and 2022, indicating shifts in funding priorities and sources for research and development activities.
(% of total R&D expenditure)
Source: Eurostat (re_e_gerdfund) and Eurostat data collection
In Moldova, there was a change in the distribution of R&D expenditure between 2016 and 2021 (no 2022 data available). In 2016, the contribution of the government sector was at 75.8 % while the contribution of the business enterprises sector at 17.9 %, the contribution of the higher education sector at 2.6 % and the contribution of funds from abroad at 3.7 %. In 2022, the most noticeable change in the distribution concerned the business enterprises sector, contributing at 9.2 %, and funds from abroad, contributing at 10.8 %. To complete the picture, the contribution of the government sector was at 78.1 % and the contribution of the higher education sector at 1.9 %. There was no contribution from the private non-profit sector in 2016 and 2022.
Ukraine showed a notable change in the distribution of R&D expenditure between 2016 and 2022. In 2016, the government sector contributed at 39.3 %, the business enterprises sector at 36.9 %, funds from abroad at 22.1 % and the higher education sector at 0.2 %. There was no contribution from the private non-profit sector in 2016. In 2022, the distribution shifted substantially, with the contribution of the government sector increasing to 69.0 %, the contribution of the business enterprises sector decreasing to 19.1 %, the contribution of funds from abroad falling to 10.8 %. The contribution of the higher education sector remained the same at 0.2 % and the private non-profit sector contributed at 0.3 %. It should be noted that the sum of the shares does not equal 100 % as funds for special purposes and funds from other sources are excluded.
Azerbaijan also recorded some changes in the distribution of R&D expenditure between 2016 and 2022. In 2016, the government sector contributed at 67.2 %, the business enterprises sector at 29.9 %, the higher education sector at 1.4 %, the private non-profit sector at 0.2 %. In 2022, the contribution of the government sector increased to 82.9 %, the contribution of the business enterprises sector fell to 16.0 % and the contribution of the private non-profit sector increased to 1.1 %, while there was no contribution from the higher education sector. There was no contribution of funds from abroad in 2016 and 2022.
Data for Armenia and Georgia are not available.
Source data for tables and graphs
Data sources
The data for ENP-East countries are supplied by and under the responsibility of the national statistical authorities of each country on a voluntary basis. The data result from an annual data collection cycle that has been established by Eurostat. These statistics are available free-of-charge on Eurostat's website, together with a range of additional indicators for ENP-East countries covering most socio-economic topics.
Information society
Eurostat's survey on ICT usage in households and by individuals is an annual survey used to benchmark ICT-driven developments. Eurostat's survey on ICT usage in enterprises is also an annual survey and generally covers enterprises with at least 10 persons employed. Note that the activity coverage excludes financial and insurance activities (NACE Rev. 2 Section K). These surveys follow developments of a set of core variables over time and provide greater depth for specific subjects through ad-hoc additional survey modules. While the surveys initially concentrated on access and connectivity issues, their scope has subsequently been extended to cover a range of subjects, for example, e-government, social media or
e-commerce. Within the European statistical system, these two surveys are based on two methodological manuals: one for enterprise statistics and one for statistics related to households and individuals; these manuals are updated annually. The definitions which the ENP-East countries have been asked to follow when providing data are based on the methodology contained within these two manuals.
Internet access of households refers to the percentage of households that have an internet access, so that anyone in the household could use the internet at home, if so desired, even simply to send an e-mail.
Research and development
Eurostat data on research and development (R & D) aim to show a comprehensive picture of the situation in the EU, covering indicators related to expenditure and personnel. The international standards for collecting and reporting data on research and experimental development are specified in the Frascati Manual. The definitions which the ENP countries have been asked to follow when providing data are based on the methodology contained within that manual.
Gross domestic expenditure on R & D (otherwise referred to as GERD) includes expenditure on R & D performed by business enterprises, higher education institutions, as well as government and private non-profit organisations. R & D expenditure by source of funds describes the origin of R & D funding.
Tables in this article use the following notation:
| Value in italics | data value is forecast, provisional or estimated and is therefore likely to change; |
| : | not available, confidential or unreliable value. |
Context
<newarticle>Information and communication technologies (ICTs) affect people's everyday lives in many ways, both at work and in the home, for example, through communications with friends and colleagues or buying and ordering goods online. The development and expansion of the information society is regarded as critical to improve the competitiveness of the EU, while EU policymakers also seek to regulate specific areas, such as e-commerce or the protection of an individual's privacy when using such technologies.</newarticle
In 2019, the European Commission President, Ursula von der Leyen, described how she wanted the EU to grasp the opportunities presented by the digital age. Indeed, A Europe fit for the digital age has been one of the Commission’s priorities for the period 2019-2024. Such a digital transformation is based on the premise that digital technologies and solutions should: create new opportunities for businesses; boost the development of trustworthy technology; foster an open and democratic society; enable a vibrant and sustainable economy; help fight climate change. With this in mind, in February 2020, the European Commission adopted an overarching presentation of the Commission's ideas and actions for Shaping Europe’s Digital Future, as well as specific proposals in relation to:
- A European strategy for data (COM(2020) 66 final) which seeks to promote the EU as a leading role model for a society empowered by data to make better decisions — in business and the public sector; and
- a White Paper on Artificial Intelligence — A European approach to excellence and trust (COM(2020) 65 final) which supports a regulatory and investment oriented approach with the twin objectives of promoting the uptake of artificial intelligence and addressing the risks associated with certain uses of this new technology.
In December 2022, European Parliament and Council Decision (EU) 2022/2481 established the Digital Decade Policy Programme 2030. This programme aims to encompass social, moral and economic impacts of digital technologies, to promote and drive the digital transformation toward a sustainable and inclusive path in order to reach a fair economy.
Statisticians are well aware of the challenges posed by rapid technological change in areas related to the internet and other new applications of ICTs. As such, there has been a considerable degree of development in this area, with statistical tools being adapted to satisfy new demands for data. Indeed, statistics within this domain are reassessed on an annual basis in order to meet user needs and reflect the rapid pace of technological change.
The Digital Economy and Society Index (DESI) is a composite index that summarises relevant indicators on Europe's digital performance and tracks the evolution of EU countries in digital competitiveness. DESI is managed by DG Communications Networks, Content and Technology and contains 37 indicators, some of which are based on Eurostat's Community surveys on ICT usage.
On 2 July 2021, the European Commission and the EU High Representative for Foreign Affairs and Security Policy presented the Eastern Partnership: a Renewed Agenda for cooperation with the EU's Eastern partners. This agenda is based on the five long-term objectives, with resilience at its core, as defined for the future of the Eastern Partnership (EaP) in the Joint Communication Eastern Partnership policy beyond 2020: Reinforcing Resilience – an Eastern Partnership that delivers for all in March 2020. It is further elaborated in the Joint Staff Working Document Recovery, resilience and reform: post 2020 Eastern Partnership priorities, amongst others defining the 'Top Ten Targets for 2025'. The Eastern Partnership’s agenda for recovery, resilience and reform is underpinned by an 'Economic and Investment Plan for the Eastern Partnership (EaP): Investing in resilient and competitive economies and societies' (Annex I of the Joint Staff Working Document). More detailed overviews are given in a Factsheet on the Eastern Partnership Joint Communication, presenting the policy objectives and the specific priorities, as well as in a Factsheet on EU-Eastern Neighbourhood flagship projects 2023-2024.
The Joint Declaration of the Eastern Partnership Summit 'Recovery, Resilience and Reform' of 15 December 2021 reaffirmed the strong commitment to a strategic, ambitious and forward-looking Eastern Partnership.
At the Eastern Partnership Foreign Affairs Ministerial meeting of 11 December 2023, the EU, its countries and partners declared that they will step up their efforts to implement the Eastern Partnership’s agenda for recovery, resilience and reform, as well as tackling challenges related to the ongoing consequences of the Russian war of aggression against Ukraine for the entire region.
In cooperation with its ENP partners, Eurostat has the responsibility 'to promote and implement the use of European and internationally recognised standards and methodology for the production of statistics, necessary for designing and monitoring policies in important areas’. Eurostat manages and coordinates EU efforts to increase the capacity of the ENP countries to develop, produce and disseminate good quality data according to European and international standards. Additional information on the policy context of the ENP is provided on the website of Directorate-General European Neighbourhood Policy and Enlargement Negotiations (NEAR).
Direct access to
- All articles on non-EU countries
- European Neighbourhood Policy countries — statistical overview — online publication
- Statistical cooperation — online publication
- All articles on the information society and use of ICT
Books
Factsheets
- Basic figures on the European Neighbourhood Policy-East countries — 2023 edition
- Basic figures on the European Neighbourhood Policy-East countries — 2022 edition
- Basic figures on the European Neighbourhood Policy-East countries — 2021 edition
Leaflets
- Basic figures on the European Neighbourhood Policy — East countries — 2020 edition
- Basic figures on the European Neighbourhood Policy — East countries — 2020 edition
- Basic figures on the European Neighbourhood Policy — East countries — 2019 edition
- Basic figures on the European Neighbourhood Policy — East countries — 2018 edition
- Basic figures on the European Neighbourhood Policy — East countries — 2016 edition
- Basic figures on the European Neighbourhood Policy — East countries — 2015 edition
- Basic figures on the European Neighbourhood Policy — East countries — 2014 edition
- Research and development, digital society (enpe_sci)
- R&D expenditure (enpe_rd)
- Digital society (enpe_isoc)
- Research and development, digital society (enpe_sci)
- ICT usage in households and by individuals (isoc_i)
- ICT usage in enterprises (isoc_e)
- Eastern European Neighbourhood Policy countries (ENP-East) (ESMS metadata file — enpe_esms)
- European Commission — European Neighbourhood Policy and Enlargement Negotiations
- European External Action Service — European Neighbourhood Policy
- Joint Communication JOIN(2020) 7 final: Eastern Partnership policy beyond 2020: Reinforcing Resilience - an Eastern Partnership that delivers for all (18 March 2020)
- Joint Staff Working Document SWD(2021) 186 final: Recovery, resilience and reform: post 2020 Eastern Partnership priorities (2 July 2021)
- Joint Declaration of the Eastern Partnership Summit: 'Recovery, Resilience and Reform' (15 December 2021)
- European Commission — Digital single market
- European Commission — European digital strategy
- European Commission — Communications Networks, Content and Technology (CONNECT)
- International Telecommunication Union (ITU)
- Decision (EU) 2022/2481 of the European Parliament and of the Council (14 December 2022)
