Data from April 2024.
Planned article update: December 2025
Highlights
Almost as much rented farmland as owned in the EU in 2020.
Almost two-thirds of rented land in the EU was on farms over 100 hectares in size in 2020.
This article provides information about farm tenure in the European Union (EU). It consists of an overview of data, complemented by all information on definitions, measurement methods and context needed to interpret them correctly.
Analysis
There were 9.1 million agricultural holdings (hereafter named ‘farms’) in the EU in 2020. In the vast majority of these farms, the land is either owned by the holder or rented (as tenant farms). However, a large number of farms include a mix of part-owned and part-rented land. As the data are not mutually exclusive for farms nor for farm managers, and some farms / managers would be counted twice, analysis is limited to the tenure of the area used for farming.
Almost as much rented farmland as own-farmed land in the EU
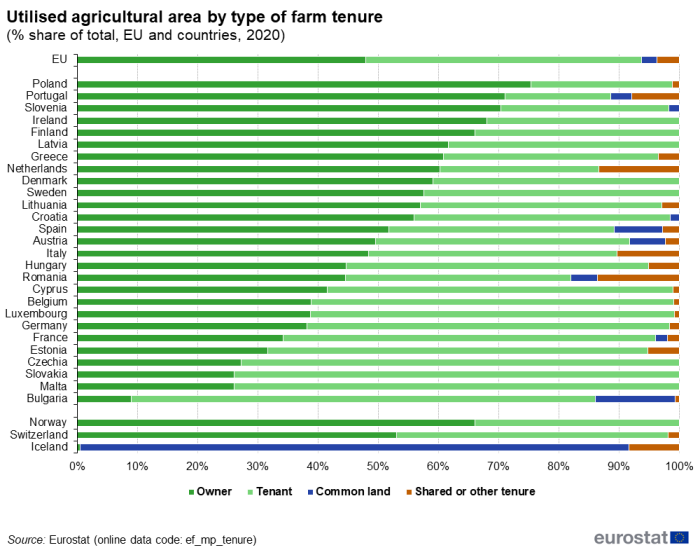
The area used for agricultural production in the EU (otherwise known as the utilised agricultural area) is found on farms under different types of tenure. Across the EU as a whole, rented land accounted for 46 % of the total utilised agricultural area in 2020, only a very slightly lower share than that for land that was owned and farmed by its manager (48 %). Together, these two forms of tenure accounted for the overwhelming use of agricultural land in the EU, with common land (3 %), and share farming and other tenure modes (4 %) being much less common – see Figure 1.
The distribution of farmland by tenure among EU countries was mixed. In 14 EU countries, owner farmed land accounted for a majority of utilised agricultural area, with the highest shares in Poland (75 %) and Portugal (71 %). In 11 EU countries, rented land accounted for a majority of utilised agricultural area, with the highest shares being in Bulgaria (77 %), Slovakia (74 %), Malta (74 %) and Czechia (73 %).

Source: Eurostat (ef_mp_tenure)
Forms of tenure other than own-land and rented land were notable in some EU countries. In Bulgaria, common land accounted for 13 % of utilised agricultural area, the highest share among EU countries. In Romania, shared land or other tenure modes accounted for 14 % of utilised agricultural area, slightly higher than the shares in the Netherlands (13 %) and Italy (10 %).
Almost two-thirds of rented land on farms over 100 hectares in size
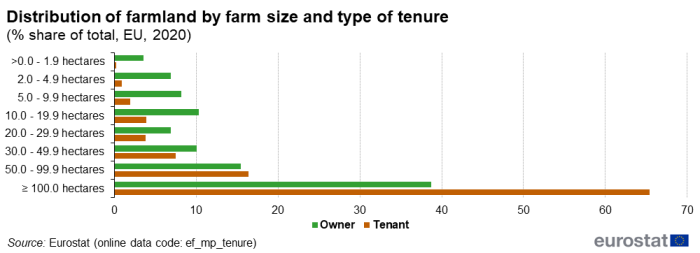
Slightly more than one half (51.8 %) of the total area used for agricultural production in the EU in 2020 was found on farms with at least 100 hectares. This proportion was higher still among rented land and contrasted starkly with owned farmland; almost two-thirds (65.4 %) of rented farmland was on farms of over 100 hectares compared with about two fifths (38.7 %) of owned farmland (see Figure 2).

Source: Eurostat (ef_mp_tenure)
Small growth in rented farmland
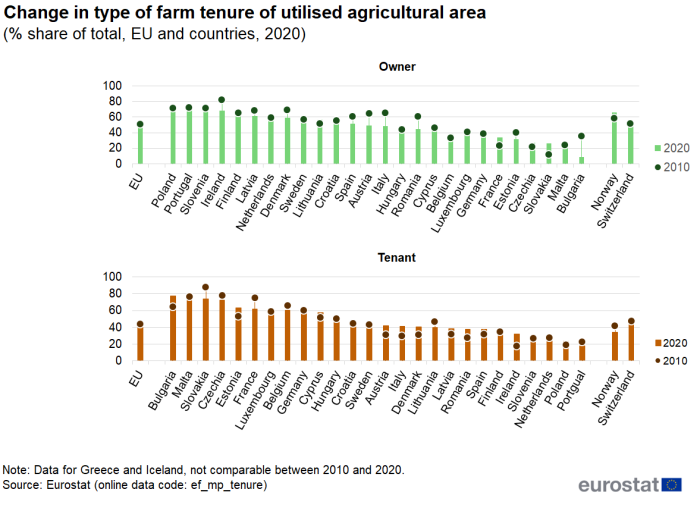
Although the amount of utilised agricultural area in the EU declined by an estimated 1.1 million hectares between 2010 and 2020 to 157.4 million hectares, the amount of land that was rented increased by an estimated 1.5 million hectares, whilst the amount of own-land farmed declined by an estimated 5.6 million hectares.
In some EU countries, there were notable changes in farm tenure between 2010 and 2020 (see Figure 3). There was greater owner-farmed utilised agricultural area in Slovakia (up 14 percentage points, albeit from a relatively low level) and, to a lesser extent, France (up 11 percentage points). In contrast, there was greater rented utilised agricultural area in a number of others; the increase was between 10 to 15 percentage points in Ireland, Bulgaria, Italy, Austria, Estonia and Romania.

Source: Eurostat (ef_mp_tenure)
Source data for tables and graphs
<datadetails>
Data sources
Indicator definition
Farm tenure refers to the ownership of land parcels used for farming. It includes:
- Farming on own-land, where the utilised agricultural area on a holding (farm) is owned by its holder.
- Farming on rented land, where the utilised agricultural area farmed on a holding is rented for a fixed, agreed sum.
- Farming on common land, where the utilised agricultural area farmed does not belong directly to a holding but is an area to which common rights apply.
- Share farming and other tenures, such as where the utilised agricultural area is farmed in partnership by the share cropper and landlord under a written or oral contract.
</datadetails>
<context>
Context
Both family-owned and tenant-run farms are a cornerstone of the agricultural sector in the EU, reflecting circumstances under which some tenures are better suited to particular economic and social conditions.
When farmland tenure is secure, there is greater confidence in making investment decisions for economic growth. Insecurity and instability in farmland tenure can lead to conflict and exclusion, particularly of poorer farmers. An added dimension in the EU has been the transition to liberalised land markets through the process of accession to the EU and the slow pace of land restitution in some of the Member States.
Access to financial capital, escalating land prices and the lack of access to land are some of the barriers to entry in farming. At a time when a majority (57.6 % in 2020 and climbing) of farm managers are over the age of 55 years (see ef_m_farmang), looking at supporting the move of younger people into farming is increasingly important for the EU’s food security and the longer-term sustainability of the sector. Only 11.9 % of EU farm mangers were under 40 years old in 2020 (see ef_m_farmang). Tenure security is also highlighted as an enabler of more local, inclusive and sustainable food chains [1].
</context>
Notes
Explore further
Database
- Farm structure (ef)
- Management and practices (ef_mp)
- Tenure of agricultural holdings by utilised agricultural area, sex and age of farm manager (ef_mp_tenure)
- Management and practices (ef_mp)
Thematic section
Methodology
The table ef_mp_tenure contains the population covered by the core data sent to Eurostat in 2020 detailed in item 3.6.1 of the metadata file for each country. Virtual entities (common land units without a farm manager) are excluded from the table as they are not agricultural holdings according to the definition set in Art 2(a) of the Regulation (EU) 2018/1091 of the European Parliament and of the Council of 18 July 2018 on integrated farm statistics and repealing Regulations (EC) No 1166/2008 and (EU) No 1337/2011. Moreover, agricultural holdings with missing information about age and sex of farm manager are excluded from the table which is mostly applicable for 2016 data. For these reasons, the figures can slightly vary from those published in ef_lus_main.
External links
Legislation
- Regulation (EC) No 1166/2008 of the European Parliament and of the Council on farm structure surveys and the survey on agricultural production methods (farm structure survey from 2010 to 2016)
- Summaries of EU Legislation: EU integrated farm statistics
- Commission Regulation (EU) No 715/2014 of 26 June 2014 amending Annex III to Regulation (EC) No 1166/2008 of the European Parliament and of the Council on farm structure surveys and the survey on agricultural production methods, as regards the list of characteristics to be collected in the farm structure survey 2016
Implementing legislation
- Commission Regulation (EC) No 1200/2009 implementing Regulation (EC) No 1166/2008 on farm structure surveys and the survey on agricultural production methods (farm structure survey from 2010 to 2016)
- Commission Regulation (EU) 2015/1391 amending Regulation (EC) No 1200/2009
- Commission Implementing Regulation (EU) 2018/1874 of 29 November 2018 on the data to be provided for 2020 under Regulation (EU) 2018/1091 of the European Parliament and of the Council on integrated farm statistics and repealing Regulations (EC) No 1166/2008 and (EU) No 1337/2011, as regards the list of variables and their description (Text with EEA relevance.)
Related and older legislation
- Council Regulation (EC) No 1217/2009 setting up a network for the collection of accountancy data on the incomes and business operation of agricultural holdings in the European Community
- Summaries of EU Legislation: Farm incomes and operations - EU statistics
- Commission Delegated Regulation (EU) No 1198/2014 of 1 August 2014 supplementing Council Regulation (EC) No 1217/2009 setting up a network for the collection of accountancy data on the incomes and business operation of agricultural holdings in the European Union
- Commission Implementing Regulation (EU) 220/2015 of 3 February 2015 laying down rules for the application of Council Regulation (EC) No 1217/2009 setting up a network for the collection of accountancy data on the incomes and business operation of agricultural holdings in the European Union
- Council Regulation (EC) No 834/2007 of 28 June 2007 on organic production and labelling of organic products and repealing Regulation (EEC) No 2092/91
- Regulation (EU) No 2018/848 of the European Parliament and of the Council of 30 May 2018 on organic production and labelling of organic products and repealing Council Regulation (EC) No 834/2007
Policy legislation

