- Data from January 2009, most recent data: Further Eurostat information, Main tables and Database
This article belongs to a set of statistical articles which analyse the structure, development and characteristics of the various economic activities in the European Union (EU). According to the statistical classification of economic activities in the EU (NACE Rev 1.1), the present article covers statistics for the public water supply, corresponding to NACE Division 41, which is part of the water supply and recycling sector. The activities covered in this article are four processes performed on water in the public water supply:
- collection;
- purification;
- desalinisation;
- distribution.
This article does not cover the collection and treatment of sewage and other waste (NACE Classes 90.01 and 90.02).
It should also be noted that some water, particularly when used in production processes, does not come from the public water supply system, but rather is extracted directly from its source.
Main statistical findings
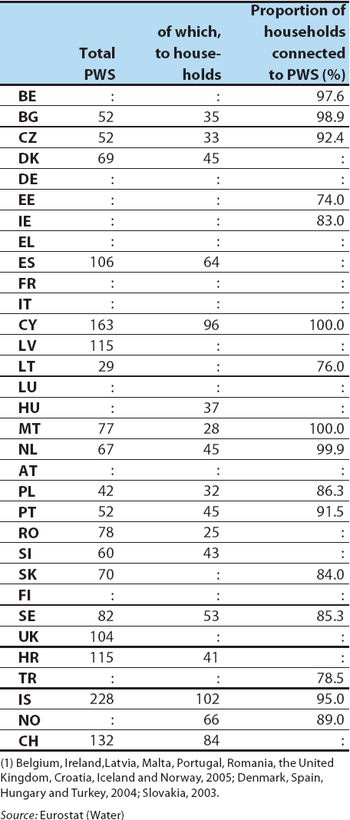
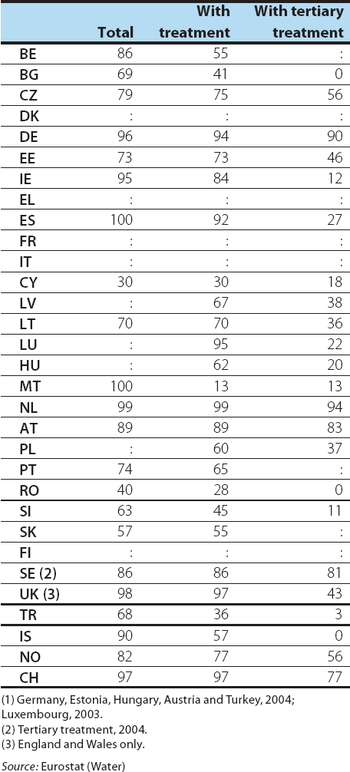
The volume of public water supply (PWS) is shown, with information on the proportion supplied to households and the extent of their connection to the PWS network in 2006. Although the data set is incomplete, in all available Member States the proportion of households connected to the PWS was close to or in excess of three quarters and in many Member States the proportion exceeded 90 %. In most Member States in 2005 the majority of the population was connected to the urban wastewater collecting system and most wastewater was treated after collection.
Structural profile
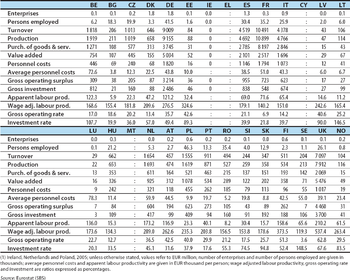
In 2006, the EU-27's water supply sector (NACE Division 41) was made up of approximately 9.0 thousand enterprises which generated EUR 23.3 billion of value added and employed 370.7 thousand persons. As such, this activity accounted for around three quarters of water supply and recycling (NACE Divisions 41 and 37) value added and a slightly smaller share of employment in the EU-27.
The United Kingdom and Germany had the largest water supply sectors in value added terms, both generating over EUR 5 billion of value added in this sector in 2006, twice as much as the next largest Member State, France. In terms of employment, however, this sector was largest in Poland and Germany, both with workforces in excess of 40.0 thousand persons, followed by Romania and France. In value added terms, the water supply sector was relatively most important in Slovakia and Bulgaria (2005)[1], where it contributed more than 1 % to non-financial business economy (NACE Sections C to I and K) value added; Sweden was by far the least specialised in this sector in that its contribution to Swedish non-financial business economy value added was just 0.04 % in 2006.
Expenditure and productivity
Investment by the EU-27's water supply sector was valued at EUR 11.4 billion in 2006, equivalent to 49.2 % of the sector's value added, making this the highest investment rate of any industrial NACE division and the fourth highest among all non-financial business economy NACE divisions. Exceptionally high investment rates were recorded in Sweden, Lithuania and Belgium, all in excess of 100 %.
Personnel costs accounted for 28.5 % of operating expenditure in the EU-27's water supply sector in 2006, a share that was well above the non-financial business economy average, and the third highest among the industrial NACE divisions. Despite this high share, average personnel costs in this sector in 2006 were EUR 27.3 thousand per employee, slightly below the non-financial business economy average. In contrast, apparent labour productivity was particularly high, at EUR 62.8 thousand per person employed, resulting in a wage-adjusted labour productivity ratio of 229.8 %. Exceptionally high wage-adjusted labour productivity ratios were recorded in the United Kingdom (537.4 %) and Finland (373.5 %) where this indicator for the water supply sector was at least twice as high as national non-financial business economy averages.
Data sources and availability
The main part of the analysis in this article is derived from structural business statistics (SBS), including core, business statistics which are disseminated regularly, as well as information compiled on a multi-yearly basis, and the latest results from development projects.
Other data sources include the Eurostat water statistics.
Context
The organisation of water supply within the EU varies between countries, with state-owned, private and mutual enterprises, as well as municipalities involved in terms of the ownership or operation of infrastructure.
Among the key issues that affect this sector are the quality of drinking water, and the efficient use of water resources, the latter concerning issues such as pricing, repair of leakages, metering of water use, and water efficient practices. Furthermore, the cost of related services (such as wastewater collection and treatment) is an important factor, as is the impact of changes in consumption patterns, for example, the increased use of water related to growth in tourism particularly in areas with scarce water resources.
Further Eurostat information
Publications
Main tables
Database
Dedicated section
See also
Notes
- ↑ Bulgaria, Poland and Romania, 2005; Ireland, Greece, Cyprus, Malta and the Netherlands, not available.


