Quality of life indicators - leisure
Data extracted in May 2024.
Planned article update: June 2029.
Highlights
This article is part of the Eurostat online publication that focuses on Quality of life indicators, providing recent statistics on the European Union (EU). The publication presents a detailed analysis of various dimensions that can form the basis for a more profound analysis of the quality of life, complementing gross domestic product (GDP) which has traditionally been used to provide a general overview of economic and social developments.
This article focuses on the fifth dimension —leisure and social interactions — of the nine quality of life indicators dimensions that form part of a framework endorsed by the Eurostat expert group on quality of life indicators, and more specifically on leisure time. The time that people spend outside their productive activities, has a major impact on their sense of well-being, happiness and life satisfaction.
Full article
Key findings
• Data from 2022 suggests that Europeans are rather satisfied with their amount of leisure time, and this has not changed since 2018 when this question was last surveyed.
• Men and women rate their satisfaction with their amount of leisure time similarly, while older and younger people, as well as those with a lower level of education are more satisfied.
• Adults living in households with dependent children are less satisfied, while the satisfaction does not differ much between people living in urban and rural areas.
One reason why people can be dissatisfied is not having time for activities they would like to do in their leisure time. For reasons of data availability in this article, only one such activity is analysed: reading books.
• On average, a bit more than one in five Europeans who did not read any books, declared lack of time as the main reason in 2022.
• This varied significantly by country (ranging between 35.2 % in Romania to 15. 5% in Portugal) as well as between sexes and age groups (with women between 25 and 54 much more likely to declare not having enough time for reading books than men at any age).
Satisfaction with leisure time
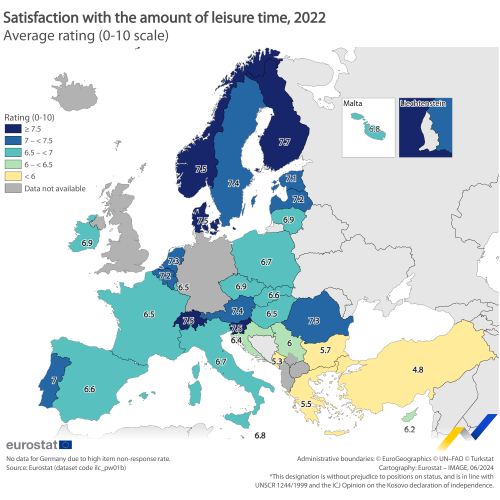
The time that people spend outside their work-related activities has a major impact on their sense of well-being, happiness and life satisfaction. In 2022, based on a scale from 0 (not satisfied at all) to 10 (fully satisfied), satisfaction with the amount of leisure time in the EU averaged 6.8 points. The score was unchanged compared with the result of the previous survey in 2018. Map 1 highlights the differences between Member States. There were 11 EU countries which scored 7.0 points or more. The highest scores were in Finland (7.7), Denmark and Slovenia (both 7.5). At the other end of the scale were two countries of the EU where the satisfaction level was below 6.0 points, namely Bulgaria (5.7) and Greece (5.5).

(% share of people aged 16 years and over)
Source: Eurostat (ilc_pw01b)
Figure 1 shows the change across time for the satisfaction with leisure time, by comparing the data for the years 2018 and 2022. The satisfaction level measured remained largely stable. Small increases were seen in Lithuania (+0.8 points), Portugal (+0.6) and Romania (+0.5). People in Ireland, Luxembourg, France and Cyprus registered a small decrease in the level of satisfaction with the amount of their leisure time (with -0.6, -0.5, -0.4 and -0.4 points, respectively). The data in remaining 19 Eu countries showed increases and decreases between -0.2 and 0.3 points or no difference at all, which means it remained stable in a majority of countries.

Source: Eurostat (ilc_pw01b)
Figure 2 offers an overview of differences by sex, age and degree of urbanisation.
Both in 2018 and 2022, men and women expressed the same level of satisfaction with the amount of their leisure time, averaging at 6.8 points. In terms of age, the highest rate of satisfaction with the amount of leisure time use was registered among older people (65 years and older), with 7.6 points, followed by the youngest group (16-24 years), with 7.1. The least satisfied were people between 35 and 49. In terms of the degree of urbanisation, people living both in towns and suburbs and in rural areas were slightly more satisfied with their amount of leisure time (6.8) than people in cities (6.7).

(Rating 0-10)
Source: Eurostat (ilc_pw02b)
Looking at the satisfaction with leisure time by level of education (Figure 3) we notice a slight trend that people with lower education level are more satisfied with the amount of their leisure time and this satisfaction decreases the higher the education level. This can be noticed at EU level (with levels of satisfaction of 6.9, 6.8 and 6.6 points for primary, secondary and tertiary education, respectively). Data in 14 EU countries show this pattern, and in 2 countries the holders of secondary and tertiary education have equal levels of satisfaction, while people with primary education are reporting to be more satisfied. The opposite pattern can be observed in Greece, Bulgaria, Italy, Lithuania and Romania.
The highest levels of satisfaction were recorded among the people with primary education in Finland (8.2), Slovenia and Sweden (both at 7.9) and people with tertiary education in Romania (7.9).

(Rating 0-10)
Source: Eurostat (ilc_pw01b)
Figure 4 shows that people living in households without dependent children are more satisfied with the amount of their leisure time than people living in households with dependent children. This holds true across the EU, exception being Romania, Latvia and Greece where the satisfaction levels are rather equal for these groups.

(Rating 0-10)
Source: Eurostat (ilc_pw02b)
Lack of time as main reason for not reading books
One reason why people can be dissatisfied is not having time for the activities they would like to do in their leisure time. For reasons of data availability in this article only one such activity is analysed; reading books. While in the EU overall 21 % of people not having read any book for the past 12 months indicate that this was because of a lack of time (other reasons being lack of interest, or financial reasons) there is great variation between countries in this respect.
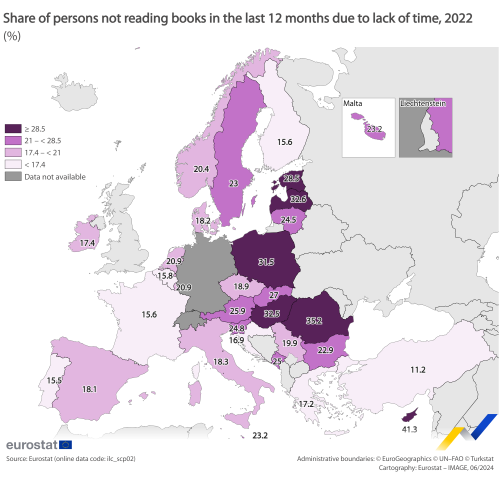
As Map 2 shows, in Cyprus, Romania, Hungary, Latvia and Poland the share of persons indicating lack of time as a reason for not reading books is over 30 %. The share is half of that in France, Finland, Belgium, Portugal, Croatia and Greece. The result may well be linked to a limited amount of leisure time as well as other subjective reasons.
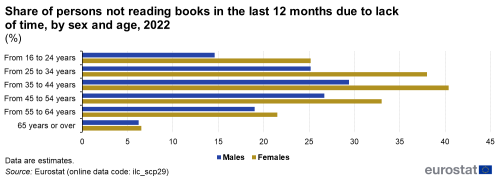
The data are analysed by age and sex in Figure 5. It becomes apparent that women indicate much more often lack of time as a reason for not reading books than men, and, echoing the findings showed by Figure 2, people in the middle of their lives are much more likely to indicate lack of time as a reason for not reading books than people under 24 or above 65.
For both sexes, the share of persons not reading books due to lack of time is smallest for those above 65, thus, at pension age, followed by young people between 16 and 24. The largest percent of people indicating lack of time for not reading books is, for both sexes, between 35 and 44, going as high as 40.4 % for women between 35 and 44.
The difference between women indicating lack of time for not reading books and men is largest, 12.8 percentage points (pp) between the ages 25 and 34. Women aged 16-24 and 35-44 also indicate lack of time by at least 10 pp more often than men. While for those between 45 and 54 years the difference between sexes decreases to 6.3 percentage points (pp), for those between 55 and 64 years is 2.5 pp and for those above 65 is almost equal (difference of 0.3 pp). While Figure 4 shows clearly that households with dependent children are less satisfied with the amount of their leisure time, Figure 5 suggests that it is in fact women in the age brackets that can be associated with raising dependent children who suffer more from lack of time.

Source: Eurostat (ilc_scp29)
Data sources
Within the quality-of-life framework, information on leisure and social interactions cover quantitative and qualitative aspects, as well as an assessment of access or the proximity of such activities/services.
The data used in this article are from the EU statistics on income and living conditions (EU-SILC), which is an annual survey that is the principal European source for measuring income and living conditions, and the leading source of information for analysing different aspects related to the quality of life of households and individuals. Most of the data used in this article come from the EU-SILC module on quality of life surveyed in 2022. It is surveyed every six years.
In the 2022 survey, there were 20 variables on personal wellbeing and social and cultural participation covering topics such satisfaction with different life domains (including leisure time); social support and participation; perceived feelings of exclusion, loneliness and happiness, as well as participation in cultural activities and reasons for not participating.
Data for Germany is missing in 2022 due to high non-response rates for the variables included in this module.
Source data for tables and graphs
Context
Subjective perception of well-being, happiness and life satisfaction is fundamentally influenced by the ability to engage in and spend time on activities we enjoy. The importance attributed by modern societies to work-life balance underlines the role that leisure and social interactions play in our quality of life. They have a quantitative aspect (in other words, the availability of time for taking part in activities we enjoy) and a qualitative aspect (for example, the ease of access to leisure activities).
Several EU policies affect leisure: the EU seeks to preserve Europe’s shared cultural heritage (Article 167 of the Treaty on the Functioning of the European Union) in language, literature, theatre, cinema, dance, broadcasting, art, architecture and handicrafts, and to help make it accessible through initiatives such as the Culture programme. To this end, the EU has also developed policies for audio-visual and media markets, including the audio-visual media services through the Creative Europe framework programme on culture and media.
Direct access to
- All articles on poverty and social exclusion
- Quality of life indicators (online publication)
- Quality of life, see:
- Material living conditions (qol_mlc)
- Productive or other main activity (qol_act)
- Health (qol_hlt)
- Education (qol_edu)
- Leisure and social interactions (qol_lei)
- Economic security and physical safety (qol_saf)
- Governance and basic rights (qol_gov)
- Natural and living environment (qol_env)
- Overall experience of life (qol_lif)
- EU-SILC ad-hoc modules (ilc_ahm)
- 2015 - Social and cultural participation (ilc_scp)
- 2018 - Material deprivation, well-being and housing difficulties (ilc_pw)
- EU-SILC ad-hoc modules (ilc_ahm)
