Extra-EU trade by invoicing currency
Data extracted in May 2024
Planned update: June 2025
Highlights
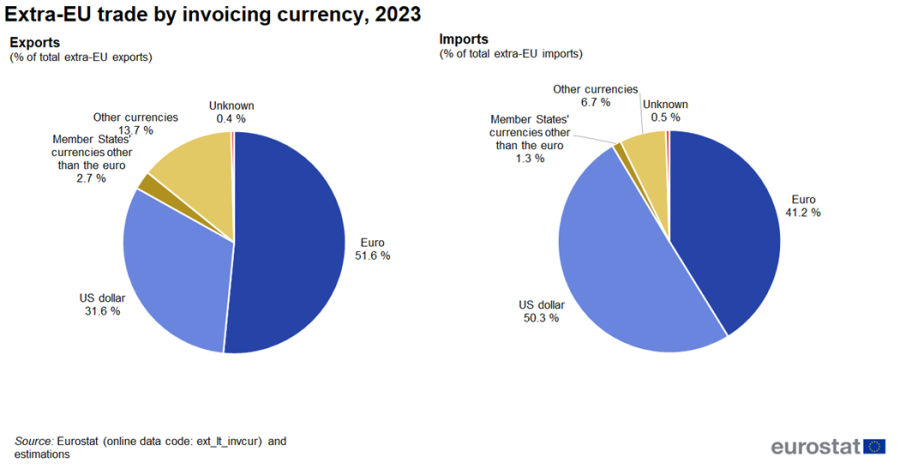
In 2023, the euro was the most used currency for EU exports with a share of 52% ahead of the US dollar with 32%.
The US dollar was the most used currency for imports into the EU with a share of 50% in 2023 ahead of the euro with 41%.
Goods imported and exported by the European Union (EU) can be invoiced in a range of currencies. This article focuses on the trade in goods by invoicing currency (TIC) of the EU with countries outside the EU in 2023. It provides information about the share of trade declared in euro, US dollars, EU Member States' currencies other than the euro and currencies of countries outside the EU (further denoted as other currencies) for imports and exports. The TIC data collection is only mandatory in even reference years.
This article is part of an online publication providing recent statistics on international trade in goods, covering information on the EU's main partners, main products traded, specific characteristics of trade as well as background information.
Full article
US dollar most used for EU imports, euro most used for EU exports in 2023
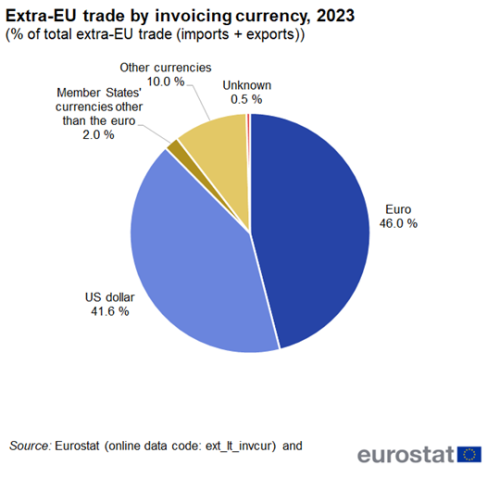
Figure 1 shows that in total extra-EU trade in goods (imports plus exports), the euro was the most used currency in 2023, with a share of 46 %. The US dollar followed with a share of 42 %. Member States' currencies other than the euro had a share of 2 %, the share of other currencies was 10 %. However, the shares are rather different when looking at imports and exports separately.
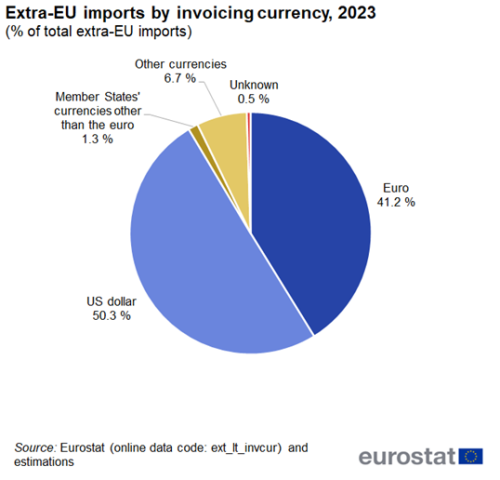
Figure 2 shows that the US dollar was the most used currency for imports into the EU in 2023, with a share of 50 %. The euro was the second most used currency with a share of 41 %. The share of Member States' currencies other than the euro was 1 %. Other currencies had a share of 7 %.
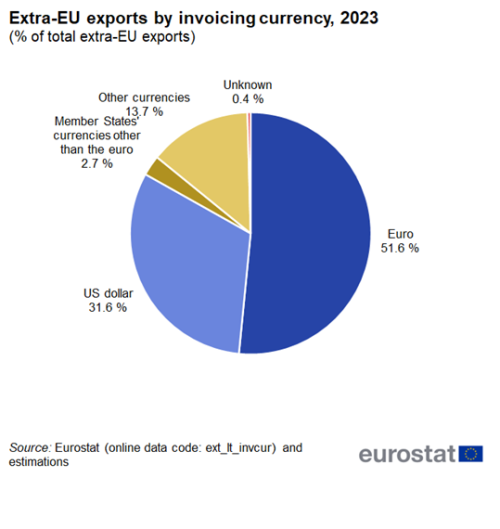
Compared with imports, the positions of the euro and the US dollar are reversed for EU exports (see Figure 3). The share for the euro in 2023 was 52 %, ahead of the US dollar with 32 %. Member States' currencies other than the euro had a share of 3 % and other currencies had a share of 14 %.
In 16 of the 27 Member States the US dollar was the most used currency for extra-EU imports of goods in 2023 (Figure 4). Its share was highest in Finland (67 %) and lowest in Slovenia (16 %). The euro was the most used currency in ten Member States: Slovenia (77 %), Croatia (70 %), Slovakia (60 %), Austria (59 %), Latvia (56 %), Italy (55 %), Estonia (50 %), Malta (49 %) and Luxembourg (47 %) while Belgium had equal shares for the euro and dollar (both 46 %). Member States' currencies other than the euro had a share above 10 % only in Czechia (24 %) and Denmark (13 %). Finally, other currencies had a share above 10 % in Denmark (12 %), Ireland (15 %), Malta and Sweden (both 12 %).
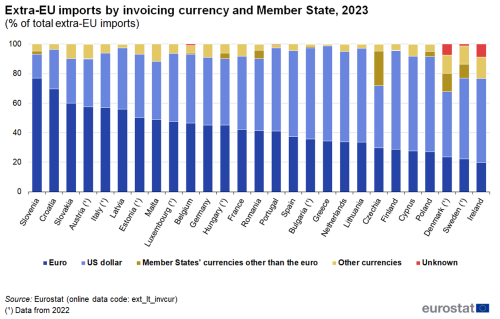
(% of total extra-EU exports)
Source: Eurostat (ext_lt_invcur)
In 19 of the 27 Member States the euro was the most used currency for extra-EU exports of goods in 2023 (Figure 5). Its share was above 70 % in Slovenia (90 %), Croatia (82 %), Latvia and Lithuania (both 78 %) and lowest in Ireland (15 %). The US dollar was the most used currency in six Member States. Its share was highest in Cyprus (76 %) and Ireland (65 %). Member States' currencies other than the euro had a share above 10 % only in Sweden (50 %) and Denmark (28 %). Lastly, other currencies had a share above 10 % in 12 countries. It was above 20 % in Denmark (25 %) and Slovakia (23 %).
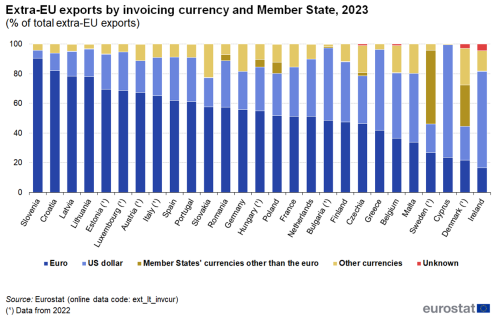
(% of total extra-EU imports)
Source: Eurostat (ext_lt_invcur)
Oil predominantly traded in US dollars, primary goods more often in euros
Looking at imports based on the Standard International Trade Classification (SITC) sections (see Figure 6), the US dollar stands out as the main currency used for imports of petroleum products (SITC 33) (82 % in 2023). In manufactured goods (SITC 5-8) the US dollar (47 %) was also the main currency just ahead of the euro (43 %). In primary goods (SITC 0-4) excluding petroleum, the euro (52 %) had the highest share ahead of the US dollar (41 %).
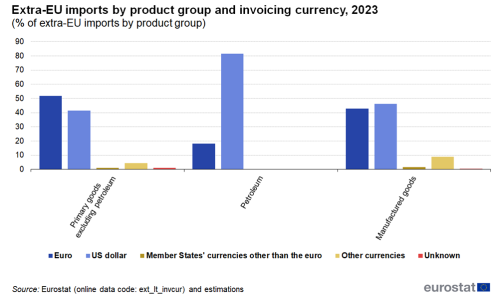
(% of extra EU imports by product group)
Source: Eurostat (ext_lt_invcur)
In extra-EU exports of petroleum products, the US dollar (68 %) is also the most used currency, although somewhat less dominant than in imports. With 60 % the euro is the most used currency in primary goods ahead of the US dollar with 25 %. In manufactured goods the euro has a share of 52 % and the US dollar had 30 % (see Figure 7).
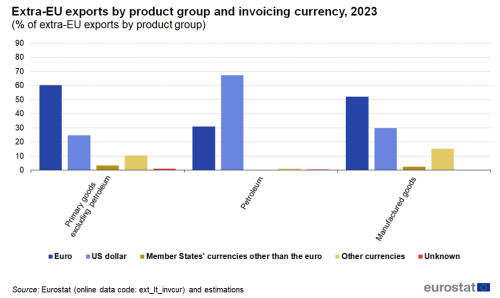
(% of extra EU exports by product group)
Source: Eurostat (ext_lt_invcur)
Source data for tables and graphs
Data sources
Data on trade by invoicing currency (TIC) is collected by using the customs declarations. Trade operators fulfilling their reporting obligations to the customs authorities in a Member State provide at the same occasion these statistical data elements, including the invoicing currency. The Member States collect, compile and transmit TIC data to Eurostat in line with the legislation in force. The data source shall be the information recorded from customs declarations according to Article 4(1) of Regulation (EC) No 471/2009. However, if the invoicing currency for exports is not available on the customs declaration, Member States shall carry out a survey for compiling exports broken down by invoicing currency which provides statistics with accurate results. The first reference year for which extra-EU trade by invoicing currency is available is 2010. Data collection is mandatory for every second calendar year since then, i.e. 2012, 2014, 2016 etc. while being voluntary for the other years.
Product classification
Information on exported and imported goods are presented according to the Standard international trade classification (SITC) at a more general level.
- SITC 5-8 Manufactured goods
- SITC 33 Petroleum, petroleum products and related materials
- SITC 0-4A Primary goods excluding SITC division 33
- Total All products
A full description is available from Eurostat's classification server [1].
Context
Currencies are the means by which wealth is stored, protected and exchanged between countries, organisations and individuals. A global currency, such as the euro, does this on a global scale. As well as serving as the currency of the euro area, the euro has a strong international presence. Since its introduction in 1999, it has firmly established itself as a major international currency, second only to the US dollar. The size, stability and strength of the euro-area economy make the euro increasingly attractive beyond its borders, too. Public and private sectors in third countries acquire and use the euro for many purposes, including for trade or as currency reserves.
Direct access to
- Publications issued by the European Central Bank (ECB):
- European Commission
