Human resources in science and technology
Data extracted in May 2024
Planned article update: May 2025
Highlights
In 2023, over 71.8 million people aged from 25 to 64 were employed in science and technology in the EU, an increase of 2.7 % compared with 2022. HRST by occupation are highly trained or experienced staff in physical and life sciences, or social sciences and humanities.
This article provides information on statistics on human resources in science and technology (HRST). This is a very broad concept looking at both the education and occupation of the human resources actually or potentially devoted to the systematic generation, advancement, diffusion and application of scientific and technological knowledge. The figures in the article focus on the age group 25-64 as this age group covers most of the employment. Data for the broader age group 15-74 are available in Eurostat free online data base.
Education refers to the people having completed tertiary education studies. According to the ISCED manual International standard classification of education - ISCED-2011 (unesco.org) tertiary education corresponds to educational levels 5 to 8, which translate in a university degree at level 5 for a Bachelor degree, level 6 and 7 for Master degree and level 8 corresponding to a PhD degree, i.e. a doctorate diploma.
Occupation refers to the occupations that could be involved in the systematic generation, advancement, diffusion and application of scientific and technological knowledge, independently of the level of studies. More concretely, the focus is on professionals such as scientists and engineers, technicians and associates professionals. As the HRST concept is very broad, the article focuses on the occupation component (HRST by occupation – HRSTO) rather than on the educational background.
The article also looks at the different age groups with an emphasis on the senior human resources in science and technology (S&T) as well as to the regional and gender imbalances. These dimensions help us to better understand the demand for S&T professionals. The article describes the currently employed HRST in the European Union, the EFTA countries and the candidate countries.
Investment in research, development, education and skills is a key policy area for the EU as it is essential for economic growth and for the development of a knowledge-based economy. There is, therefore, a great need to measure and analyse the skilled part of the labour force, both within the EU and internationally.
Full article
Professionals and technicians employed in science and technology occupations
In 2023, over 78 million people in the EU aged from 15 to 74 were employed in science and technology (and therefore considered as human resources in science and technology by occupation, an increase of 2.9 % compared with 2022. The science and technology occupations comprise the occupations whose main tasks require either a high level of professional knowledge or technical knowledge and experience in one or more fields of physical and life sciences, or social sciences and humanities.
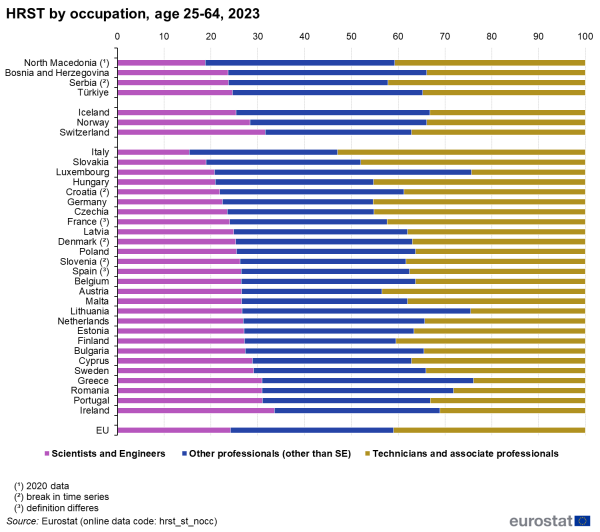
Within this 78 million, 71.8 million people were in the 25 to 64 age group, an increase of 2.7 % compared with 2022. From this broad group 59.0 % were 'professionals'. However, the percentage differed greatly between Member States. Greece (76.1 %), Luxembourg (75.7 %) and Lithuania (75.5 %) reported the highest proportion of professionals. Other Member States with more than two thirds professionals were Romania (71.8 %), Ireland (68.9 %), Portugal (66.9 %) and Sweden (66.0 %). (see Figure 1).
The ‘professionals’ subgroup includes a special category of interest, ‘scientists and engineers’, covering people employed in science and engineering, health and information and communications technology. In 2023, scientists and engineers made up 24.1 % of people employed in S&T occupations in the EU. In absolute terms, the number of scientists and engineers increased by 4.7 % in the EU compared with 2022 and the country with the largest number of scientists and engineers was Germany, with over 3.6 million scientists and engineers.
Apart from scientist and engineers, the professional subgroup also contains 34.8% of ‘other professionals' (other than scientists and engineers)’. Besides these two groups, the remaining 41.0 % of the persons employed in science and technology occupations were ‘technicians and associate professionals’.
Regional characteristics of people in science and technology occupations
The stock of persons employed in science and technology occupations (HRST by occupation) can be used as an indicator of the development of the knowledge-based economy and is the key to the development of knowledge and technological innovation in all regions of the European Union.
The employment in science and technology occupations tends to be concentrated in capital cities and the surrounding regions, in regions with key universities and research institutions and in regions where large businesses have set up their headquarters and main research units. In 2023, fourteen of the 25 NUTS 2 regions with the highest share of persons employed in science and technology in their labour force in the EU, EFTA and Candidate countries were capital cities (see Figure 2).
The Nordic capital regions were among the top regions. The top list also included a number of regions with key universities and research centres, such as Hamburg in Germany and Utrecht in the Netherlands.
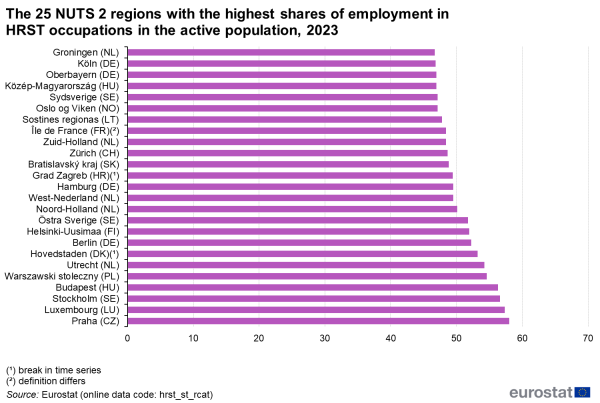
Source: Eurostat (hrst_st_rcat)
Senior human resources in science and technology
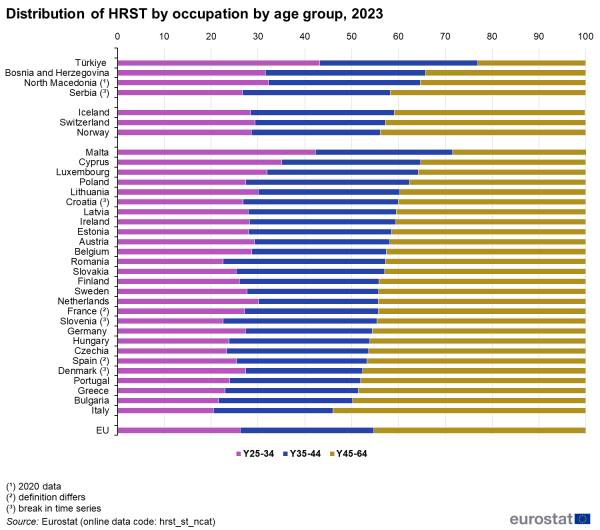
In 2023, from the 71.8 million people employed in science and technology in the EU, more than 32.5 million were ‘senior’ HRST by occupation, i.e. between 45 and 64 years old. This corresponds to 45.2 % of persons employed in S&T occupations in the EU. Making a comparison, the 18.8 million people aged 25-34 in the HRST by occupation in 2023 corresponded to 26.2 % of persons employed in S&T occupations in the EU.
Among the Member States, Italy has the largest share of senior HRST by occupation with 53.9 %. Bulgaria, Greece, Portugal, Denmark, Spain, Czechia, Hungary and Germany also have more than 45 % of senior HRST by occupation (see Figure 3). At the other end of the scale, Malta (28.5 %) has the smallest share of senior persons employed in S&T occupations.
Women in science and technology
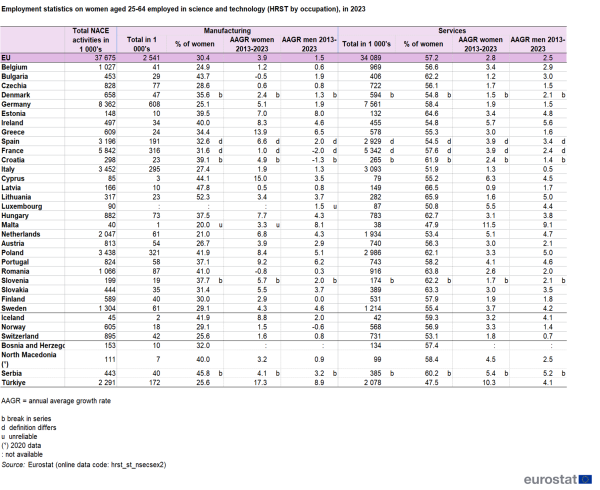
In 2023, out of the 37.7 million working in science and technology occupations, 34.1 million women were working in service activities, compared to only 2.5 million in manufacturing activities in the EU. Malta is the only Member State where women made up less than 50% of the science and technology employment in services with 47.9 % of the persons working in science and technology occupations in services being women
(see Table 1).
Source: Eurostat (hrst_st_nsecsex2)
The situation was different in manufacturing, where at EU level, women accounted for only 30.4 % of persons employed in S&T occupations. In 2023, only Lithuania reported that more than 50 % of HRST by occupation employed in manufacturing were women.
Between 2013 and 2023, the average annual growth rate (AAGR) in the EU for HRST by occupation for women employed in the services sector was higher than for men, increasing by 2.8 % a year compared to 2.5 % for men. The same happened for HRST women employed in manufacturing sector, where numbers grew by 3.9 % a year compared to 1.5 % for men.
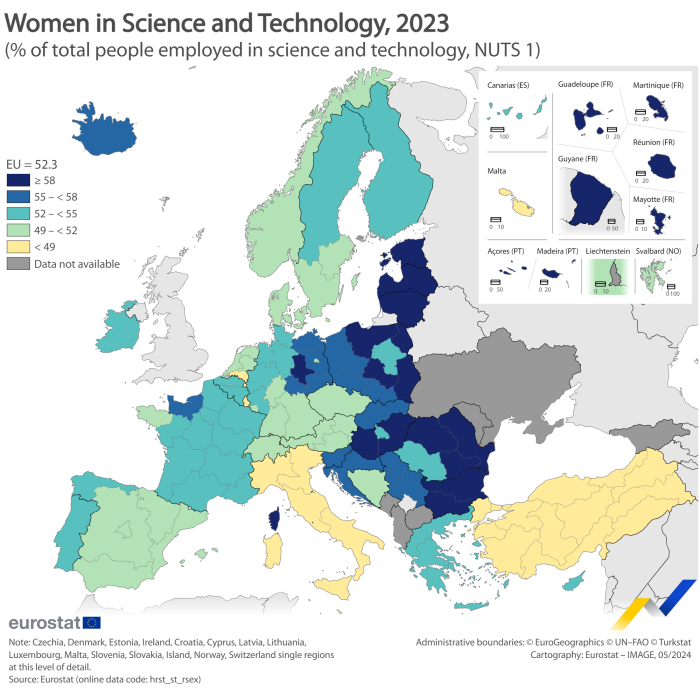
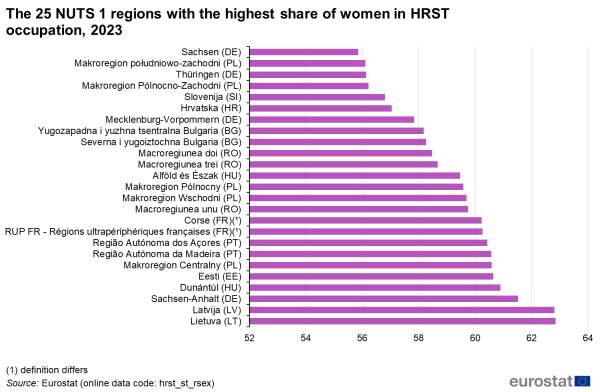
Analysing the employment of the 15-74 age population in science and technology occupations by NUTS 1 regions shows that the highest shares of women employed in science and technology occupations in 2023, with more than 60 %, can be observed in Lietuva (LT) (62.9 %), Latvija (LV) (62.8 %), Sachsen-Anhalt (DE) (61.5 %), Dunántúl (HU) (60.9 %), Eesti (EE) (60.6 %), Makroregion Centralny (PL) (60.6 %), Região Autónoma da Madeira in Portugal (PT) (60.6 %), Região Autónoma dos Açores in Portugal (PT) (60.4 %) and Régions ultrapériphériques françaises (FR) (60.2 %) followed by Corse (FR) (60.2 %). The top 25 regions in the EU, EFTA and Candidate countries are ranked in Figure 4.
Source: Eurostat (hrst_st_rsex)
Source data for tables and graphs
Data sources
The data on the workforce in science and technology are obtained from the EU Labour Force Survey. Particular attention is paid to scientists and engineers, who are often the innovators at the centre of technology-led development.
The data on the workforce in science and technology cover employment status, occupation and education. Statistics are broken down by gender, age, region, sector of economic activity, occupation, educational level, fields of education, nationality and country of birth. Not all data combinations are possible.
Context
Innovation Union
The Innovation Union initiative seeks to improve both the framework for research and innovation in the EU and access to finance. The aim is to ensure that innovative ideas can be turned into products and services that create growth and jobs.
A key element of the Innovation Union involves completion of the European Research Area (ERA), aiming to increase the competitiveness of European research institutions by bringing them together and encouraging a more inclusive way of work. Increased mobility of knowledge workers and deeper cooperation among EU research institutions are central ERA goals.
The ERA should inspire the best talents to enter research careers in Europe and encourage industry to invest more in European research. It will enable European researchers to develop strong links with partners around the world, so that Europe benefits from the advancement of knowledge worldwide, contributes to global development and takes a leading role in international initiatives to solve issues that affect us all.
Direct access to
- Human Resources in Science & Technology (t_hrst)
- Human resources in science and technology (HRST) (tsc00025)
- Human resources in science and technology (HRST) by NUTS 2 regions (tgs00038)
- Human Resources in Science & Technology (hrst)
- Stocks of HRST at the national and regional levels (hrst_st)
- Flows of HRST at the national level (hrst_fl)
- Science, technology and innovation in Europe - Pocketbook, 2013 edition
Definitions
Eurostat uses harmonised concepts, methods and definitions to produce HRST statistics. It draws on the Manual on the Measurement of Human Resources devoted to Science and Technology, the ‘Canberra Manual’, jointly written by the OECD, UNESCO, the International Labour Organisation, the European Commission’s Directorate-General for Research and Innovation and Eurostat.
The Canberra Manual describes highly skilled human resources as essential for the development and flow of knowledge and as forming the crucial link between technological progress and economic growth, social development and environmental well-being. Countries and international organisations have highlighted the political and economic importance of internationally comparable, harmonised and high-quality data on human resources.
The Manual defines human resources in science and technology as persons fulfilling at least one of the following two conditions (see Figure 5):
- human resources in terms of education: individuals who have successfully completed a university-level education (HRSTE);
- human resources in terms of occupation: individuals who are employed in a science and technology occupation as ‘Professionals’ or ‘Technicians and associate professionals’ (HRSTO).
The group that fulfils both of these criteria is called the HRST core (HRSTC).
Comparability of concepts and data
Since statistics on the number of people and the mobility of human resources in science and technology are all sourced from Eurostat’s Labour Force Survey, they can be compared to and combined with each other and with the part of the high-tech statistics relating to employment in high-tech sectors and knowledge-intensive activities. Nevertheless, users should pay close attention to concepts and definitions when comparing or combining HRST statistics with statistics from other domains and/or sources.
For example, ‘total HRST’ cannot be compared with total employment, as total HRST also covers unemployed and inactive HRST. If comparisons need to be made, either the ‘HRST in terms of occupation’ or the ‘HRSTC’ subgroups, or a HRST table that explicitly contains only HRST who are employed, could be used.
Comparisons between HRST numbers, mobility statistics and statistics on HRST education inflow must be drawn with caution, as the sources for these statistics apply a different methodology. For example, a HRST table showing the field of education cannot be compared to one showing employed HRST, because only ‘HRST in terms of education’ covers the education dimension (not all employed HRST have a university-level education).
HRST data are derived from the Labour Force Survey data, which are provided as part of the integrated European social statistics based on EU regulation 2019/1700 (IESS Regulation), starting with survey year 2021.
