Archive:Key figures on the changes in the labour market
Data extracted in November 2022
Planned article update: February 2022
Highlights
This article addresses the most significant changes in the European Union (EU) labour market from the second quarter of 2021 to the second quarter of 2022, with a focus on employment of young people.
This overview of the changes to the labour market aims to answer the following questions: for whom the employment rate increased the most? Is the trend different for young people still in education compared to those not in education? Which occupations recorded the highest number of job starters?
The analyses are carried out for the EU as a whole, for the 27 EU Member States individually, for 3 EFTA countries (Iceland, Norway, Switzerland) and for 4 candidate countries (Montenegro, North Macedonia, Serbia and Turkey). It makes use of non-seasonally adjusted quarterly data from the European Union Labour Force Survey (EU-LFS).
This article is part of the online publication Labour market in the light of the COVID 19 pandemic - quarterly statistics.
Full article
Disparate increase in employment
The population by labour category can be analysed using the European Union Labour Force Survey (EU-LFS) data. A closer look at the various categories of the labour market shows that the age, the sex as well as the level of education are key factors for employment but also for unemployed people or those outside the labour force.
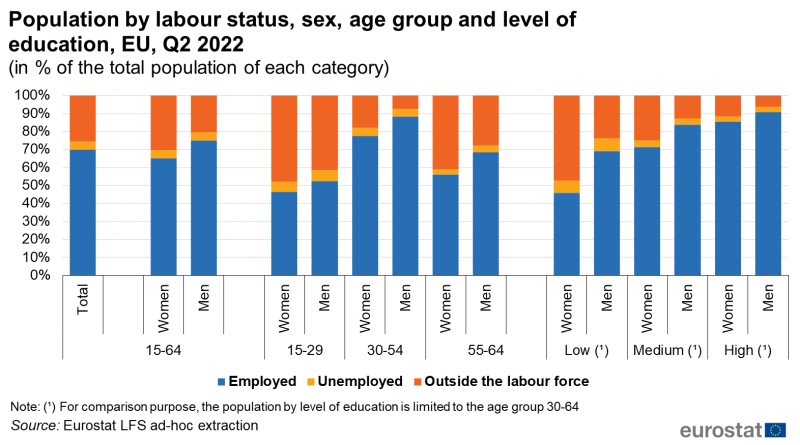
In Q2 2022, exactly 7 in 10 persons aged 15-64 (70.0 %) were employed in the EU, 4.5 % were unemployed and 25.4 % were outside the labour force (Figure 1). The employment rate in Q2 2022 varied significantly from a category to another as shown in Figure 1: 52.4 % of men and 46.5 % of women aged 15-29 were employed against 88.4 % of men and 77.5 % of women aged 30-54, and 68.7 % of men and 56.2 % of women aged 55-64. The older the people, the larger the employment gap between men and women. Looking at unemployment, the highest share expressed in percentage of the population was found among young men aged 15-29 (6.3 %) and the lowest among women aged 55-64 (2.9 %). Furthermore, almost half men and women aged 15-29 were outside the labour force against 7.4 % of men and 17.9 % of women aged 30-54, and 27.9 % of men and 41.0 % of women aged 55-64.
The level of education also affects significantly the employment rate. Figure 1 also compares people aged 30-64 by level of education and labour status in the EU. The lowest employment rates in Q2 2022 were reported by people with a low level of education: 69.1 % of men and less than half of women were employed (46.0 %). People with a medium level of education followed with 71.2 % of employed women and 83.7 % of employed men. The highest shares were recorded among men and women with a high level of education with 91.0 % and 85.5 % respectively of those people who had a job. It is worth noting that the large differences observed in the male and the female employment rates were also clearly visible in the shares of men and women outside the labour force while the shares of unemployed men and unemployed women were much more closer.
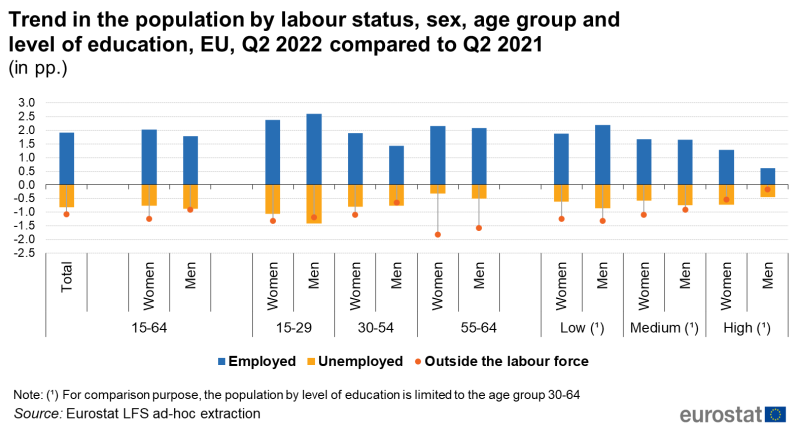
From Q2 2021 to Q2 2022, the employment rate increased more for younger people aged 15-29 (+2.4 pp. for women and + 2.6 pp. for men) than for older people who recorded an increase from 1.4 pp. (reported by men aged 30-54) to 2.2 pp. (women aged 55-64).
A relevant finding is that the increase in the employment rate of young people and in the employment rate of men aged 30-54 was accompanied by a significant decrease in the share of people outside the labour force as well as in the share of unemployed people (from +1.1 to +1.4 pp. for young men and women and around 0.7 pp. for men aged 30-54). However, the increase in the employment rate of women aged 30-54 and of men and women aged 55-64 was accompanied by a substantial decrease in people outside the labour force while the share of unemployed decreased in a much lesser extent. For older people, it is very likely due to the longer retention of older workers in employment observed in most countries. In addition, the employment increased slightly more for women than for men over this one-year period regardless the age group.
Moreover, the increase in the employment rate from Q2 2021 to Q2 2022 was more pronounced among men and women aged 30-64 with a low level of education (+2.2 pp. and +1.9 pp.) than men and women with a higher level of education. In particular, men and women with a high level of education recorded the lowest increases, +0.6 pp. and +1.3 pp. respectively.
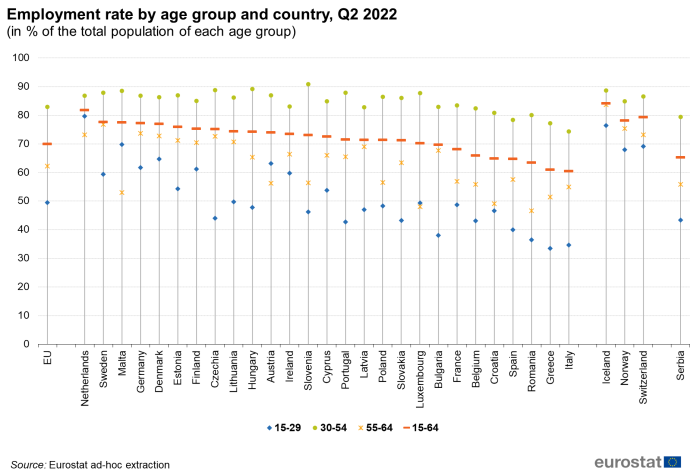
At national level (see Figure 3), the employment rate of people aged 15-64 was the highest and surpassed 77 % in the Netherlands (81.8 %), Sweden (77.6 %), Malta (77.5 %) and Germany (77.6 %). By contrast, two thirds of people aged 15-64 or less were employed in Italy (60.5 %), Greece (61.1 %), Romania (63.5 %), Spain (64.8 %), Croatia (64.9 %) and Belgium (66.0 %):
- For people aged 15-29: less than 40% of people were employed in Greece, Italy, Romania and Bulgaria while they were more than two thirds in Malta (59.7 %) and in the Netherlands (81.8 %). The next section of this article focuses on this specific age group and investigates the effect on employment of considering separately those still in formal education and those who are not in formal education.
- For people aged 55-64: half of people or less were employed in Romania (45.4 %), Luxembourg (49.3 %) and Croatia (49.1 %) while they were more than 73 % in Sweden (76.8 %), Germany (73.6 %) and the Netherlands (73.2 %).
Effect of the participation to the formal education on youth employment
As seen in the previous section, people aged 15-29 recorded the highest increases in their employment rate over the 1-year period from Q2 2021 to Q2 2022. Therefore, it may be worth investigating which proportions of employed young people are still in formal education and whether all categories of young people benefited from this increase in employment.
Slightly more than half people aged 15-29 in the EU participated to formal education in Q2 2022
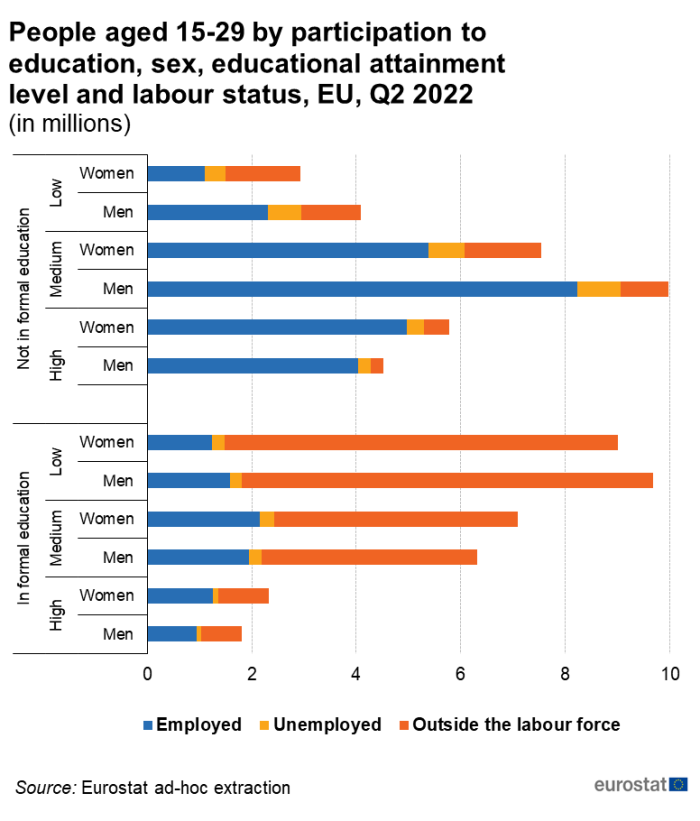
Figure 4 provides a first overview of the total population of people aged 15-29 at EU level in Q2 2022. This figure shows that 51.0 % of young people were still in formal education (36.2 millions) while 49.0 % were not (34.8 millions). For both groups, the higher the level of educational attainment, the higher the employment rate for both men and women.
Among those who were still in formal education, the employment rates varied significantly according to the educational attainment level but were very close for men and women: around 15 % for men and women who attained a low level of education, 30 % for those with a medium level of education and around 53 % for those with a high level.
Looking at people who were not in formal education in Q2 2022, the picture differs significantly. Slightly more than one third of women (37.6 %) but more than half men (56.3 %) with a low level of education were employed. As well as for people with a low level of education, the male population with a medium educational attainment level is bigger than the female population. Men also recorded a higher employment rate (82.6 %) than women (71.4 %). Over the same period, the female population with a high level of education was bigger than for men but the employment rate of women was also slightly below compared to the male employment rate. The employment gap between both sexes was much more pronounced for all levels of education among the population who are not in education compared to those who are still in education.
At EU level, 74.7 % of young people aged 15-29 who are not in formal education were employed in Q2 2022 against 25.2 % for those who were in formal education. However, as clearly visible in Figure 5, the employment rate of people still in education changed significantly from a country to another. It goes from more than 40 % in the Netherlands, Denmark, Finland, Germany and Austria to less than 6 % in Romania, Slovakia and Hungary.
(share in % of total of each category)
Source: Eurostat LFS ad-hoc extraction
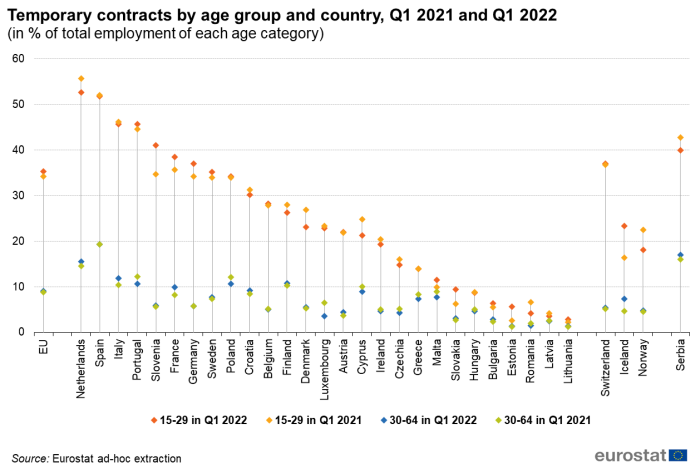
In the EU, 35.4 % of employed people aged 15-29 had a temporary contract in Q1 2022 compared to 34.3 % in Q1 2021 (+1.1 pp.) (see Figure 8). At country level, more than 40 % of employed young people in Q1 2022 had this type of contract in the Netherlands (52.6 %), Spain (51.8 %), Italy (45.7 %), Portugal (45.6 %) and Slovenia (41.0 %) but less than 5 % in Lithuania (2.8 %), Latvia (3.5 %) and Romania (4.2 %).
From Q1 2021 to Q1 2022, the share of temporary contracts in the total employment aged 15-29 increased the most in Slovenia (+ 6.3 pp.), Slovakia (+ 3.2 pp.), Estonia (+ 3.1 pp.), Germany and France (both with + 2.8 pp.) and decreased the most in Denmark (-3.8 pp.), Cyprus (-3.6 pp.) and the Netherlands (-3.1 pp.).
Moreover, 9.0 % of employed people aged 30-64 had a temporary contract in Q1 2022 (+0.2 pp. compared to Q1 2021). The 3 highest shares were found in Spain (19.3 %), the Netherlands (15.5 %) and Italy (11.9 %). The share of temporary contracts in the total employed people aged 30-64 increased by 1 pp. or more in France (+1.6 pp.), Italy (+1.5 pp.) and the Netherlands (+1.0 pp.), and fell from -3 pp. to -1 pp. in Luxembourg, Portugal, Poland, Malta, Cyprus and Greece.
Across EU countries, there is clear relationship between the shares of temporary contracts among young people (age 15-29) and among people aged 30-64. Countries with a high (or a low) share of temporary contracts for young people have more likely a high (or a low) share of temporary contracts among people aged 30-64.
Number of workers: trend by occupation and economic activity
A quarter more food preparation assistants, the occupational group that grew the most
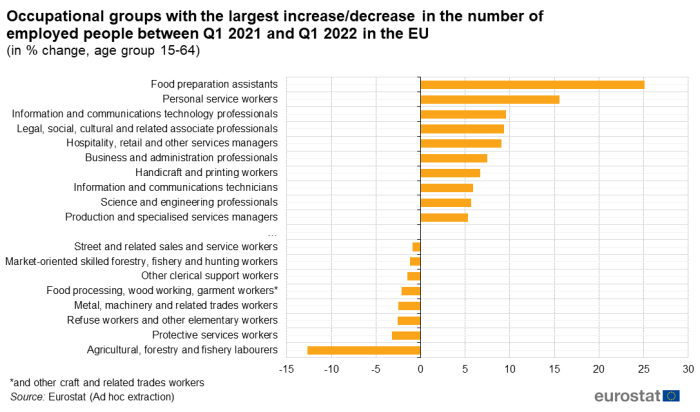
Food preparation assistants were the occupational group (according to ISCO) that saw the largest relative increase in the number of employed people in the EU from Q1 2021 to Q1 2022: from 1.093 million to 1.368 million, i.e. an increase of 25.1 % (see Figure 9 showing only the occupational groups with the largest increases/decreases in the number of workers at EU level).
The occupational groups that also knew a large increase in the number of workers from Q1 2021 to Q1 2022 were:
- personal service workers, that relate to travel attendants, conductors, guides, cooks, waiters and bartenders, hairdressers, beauticians, and building and housekeeping supervisors (+15.6 %, from 6.594 million to 7.622 million),
- information and communications technology professionals, that include software and applications developers and analysts and database and network professionals (+9.6 %, from 4.129 million to 4.525 million), and
- legal, social, cultural and related associate professionals (+9.4 %, from 3.172 million to 3.469 million).
Instead, some occupational groups had fewer workers in Q1 2022 than in Q1 2021. Agricultural, forestry and fishery labourers recorded the most sizeable decrease in the EU, amounting to -12.6 %, from 1.624 million in Q1 2021 to 1.419 million in Q1 2022.
After this occupational group, the number of employed people fell the most among the groups of:
- protective services workers (-3.2 %, from 3.213 million to 3.110 million),
- refuse workers and other elementary workers (-2.5 %, from 1.832 million to 1.785 million), as well as
- metal, machinery and related trades workers (also -2.5 %, from 7.499 million to 7.311 million).
And what about the situation in the different sectors of economic activity?
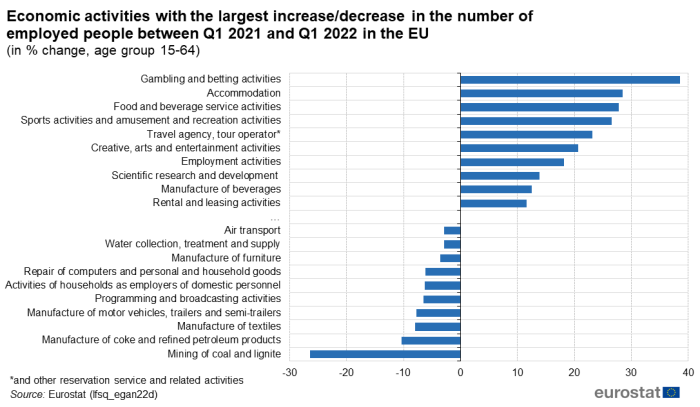
The number of workers in the sector of gambling and betting activities grew from 0.229 million to 0.317 million over the one-year period between the first quarter of 2021 and 2022, corresponding to an increase of 38.6 %. This sector recorded the largest relative increase in the number of workers in the EU considering the NACE divisions (see Figure 10).
The following sectors with the largest relative increases in the number of employed people between Q1 2021 and Q1 2022 were:
- accommodation (+28.5 %, from 1.429 million to 1.837 million),
- food and beverage service activities (+27.8 %, from 4.923 million to 6.293 million), and
- sports activities and amusement and recreation activities (+26.5 %, from 1.084 million to 1.372 million).
Source: Eurostat (lfsq_egan22d)
Not all of the sectors of economic activity saw an increase in the number of employed people from Q1 2021 to Q1 2022. Indeed, some recorded a decrease. Among these, the largest cut in the number of workers was reported for the sector of mining of coal and lignite, from 0.233 million to 0.171 million corresponding to a decrease of 26.5 %.
Other sectors recording a large drop in the number of employed people between Q1 2021 and Q1 2022 were:
- manufacture of coke and refined petroleum products (-10.4 %, from 0.157 million to 0.140 million),
- manufacture of textiles (-8.0 %, from 0.602 million to 0.554 million), and
- manufacture of motor vehicles, trailers and semi-trailers (-7.7 %, from 3.273 million to 3.020 million).
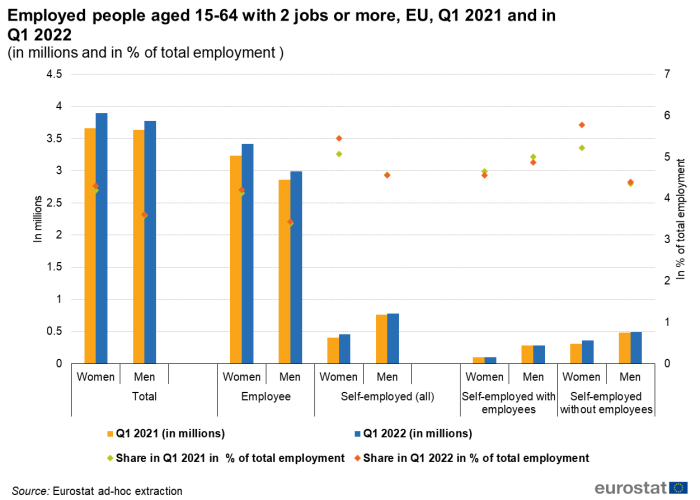
In Q1 2022, 4.3 % of employed women and 3.6 % of employed men aged 15-64 in the EU had two jobs or more (Figure 11). Having a second job was more common among women than among men. Looking at the shares of employees, this difference is even slightly more pronounced: 4.2 % of female employees had more than one job against 3.4 % of men.
However, self-employed people had more likely a second job (or more jobs) than employees. Having more than one job concerned in Q1 2022 5.4 % of self-employed women and 4.6 % of self-employed men. If only self-employed women and men without employees are considered, these shares reached a higher level: 5.8 % for women and 4.4 % for men.
Looking at the development between Q1 2021 and Q1 2022, self-employed women without employees recorded the most substantial increase in the share of people with more than one job (+0.6 pp.).
While 3.9 % of employed people had a second job in the EU, this share varied from a EU country to another. In Q1 2022, it reached 10.1 % in the Netherlands, 7.4 % in Finland, 7.1 % in Denmark and 6.6 % in Estonia. However, this phenomenon was quite marginal in Bulgaria, Romania, Slovakia, Italy, Hungary and Croatia where less than 1.5 % of employed people had more than one job in the same quarter.
This share increased the most from Q1 2021 to Q1 2022 in Belgium and Slovenia (both with +1.0 pp.) and in Portugal (+0.8 pp.) and decreased the most in Latvia (-0.9 pp.) over the same one-year period (Figure 12).
Source data for tables and graphs
Methods and definitions
All figures in this article are based on non-seasonally adjusted quarterly results from the European Union Labour Force Survey (EU-LFS).
Data sources
Source: The European Union Labour Force Survey (EU-LFS) is the largest European household sample survey providing quarterly and annual results on labour participation of people aged 15 and over as well as on persons outside the labour force. It covers residents in private households. Conscripts in military or community service are not included in the results. The EU-LFS is based on the same target populations and uses the same definitions in all countries, which means that the results are comparable between the countries. The EU-LFS is an important source of information about the situation and trends in the national and EU labour markets. Each quarter around 1.8 million interviews are conducted throughout the participating countries to obtain statistical information for some 100 variables. Due to the diversity of information and the large sample size, the EU-LFS is also an important source for other European statistics like Education statistics or Regional statistics.
Coverage: The results from the survey currently cover all European Union Member States, the EFTA Member States Iceland, Norway and Switzerland, as well as the candidate countries Montenegro, North Macedonia, Serbia and Turkey. For Cyprus, the survey covers only the areas of Cyprus controlled by the Government of the Republic of Cyprus.
In the analysis by economic activity and occupational group, only those activities and groups with more than 100 thousand employed people at EU level are taken into account.
European aggregates: EU and EU-27 refer to the totality of the EU of 27 Member States. If data are unavailable for a country, the calculation of the corresponding aggregates takes into account the data for the same country for the most recent period available. Such cases are indicated.
Country notes
In Germany, from the first quarter of 2020 onwards, the Labour Force Survey (LFS) is part of a new system of integrated household surveys. Technical issues and the COVID-19 crisis has had a large impact on data collection processes in 2020, resulting in low response rates and a biased sample. For more information, see here.
In the Netherlands, the 2021 LFS data remains collected using a rolling reference week instead of a fixed reference week, i.e. interviewed persons are asked about the situation of the week before the interview rather than a pre-selected week.
Definitions
The concepts and definitions used in the EU-LFS follow the guidelines of International Labour Organization (ILO). In particular, employed people comprise: (a) persons who during the reference week worked for at least one hour for pay or profit or family gain; (b) persons who were not at work during the reference week but had a job or business from which they were temporarily absent.
The LFS employment concept differs from national accounts domestic employment, as the latter sets no limit on age or type of household, and also includes the non-resident population contributing to GDP and conscripts in military or community service.
More information
More information on the LFS can be found via the online publication EU Labour Force Survey, which includes eight articles on the technical and methodological aspects of the survey. The EU-LFS methodology in force from the 2021 data collection onwards is described in methodology from 2021 onwards. Detailed information on coding lists, explanatory notes and classifications used over time can be found under documentation.
Context
The COVID-19 pandemic hit Europe in January and February 2020, with the first cases confirmed in Spain, France and Italy. COVID-19 infections have been diagnosed since then in all European Union (EU) Member States. To fight the pandemic, EU Member States took a wide variety of measures. From the second week of March 2020, most countries closed retail shops, with the exception of supermarkets, pharmacies and banks. Bars, restaurants and hotels were also closed. In Italy and Spain, non-essential production was stopped and several countries imposed regional or even national lock-down measures which further stifled economic activities in many areas. In addition, schools were closed, public events were cancelled and private gatherings (with numbers of persons varying from 2 to over 50) banned in most EU Member States.
The majority of the preventive measures were initially introduced during mid-March 2020. Consequently, the first quarter of 2020 was the first quarter in which the Labour Market across the EU was affected by COVID-19 measures taken by Member States.
In the following quarters of 2020, as well as 2021, the preventive measures against the pandemic were continuously relaxed and re-enforced in accordance with the number of new cases of the disease. New waves of the pandemic began to appear regularly (e.g. peaks in October-November 2020 and March-April 2021). Furthermore, new strains of the virus with increased transmissibility emerged in late 2020, which additionally alarmed the health authorities. Nonetheless, as massive vaccination campaigns started all around the world in 2021, people began to anticipate improvement of the situation regarding the COVID-19 pandemic.
The quarterly data on employment allows regular reporting of the impact of the COVID-19 pandemic crisis on employment. In the publication Labour market in the light of the COVID-19 pandemic, a specific article depicts employment in general and specifically by gender, age and level of educational attainment while another article focuses on employed people and job starters by sector of economic activity and occupation.
However, in this exceptional context of the COVID-19 pandemic, employment and unemployment as defined by the International Labour Organisation (ILO) are not sufficient to describe the developments taking place in the labour market. In the first phase of the crisis, active measures to contain employment losses led to absences from work rather than dismissals, and individuals could not look for work or were not available due to the containment measures, thus not counting as unemployed. Only referring to unemployment might consequently underestimate the entire unmet demand for employment, also called the labour Market slack.
The three indicators supplementing the unemployment rate presented in this article provide an enhanced and richer picture than the traditional labour status framework, which classifies people as employed, unemployed or outside the labour force, i.e. in only three categories. The indicators create ‘halos’ around unemployment. This concept is further analysed in a Statistics in Focus publication titled "New measures of labour market attachment", which also explains the rationale of the indicators and provides additional insight as to how they should be interpreted. The supplementary indicators do not alter or put in question the unemployment statistics standards used by Eurostat. Eurostat publishes unemployment statistics according to the ILO definition, the same definition as used by statistical offices all around the world. Eurostat continues publishing unemployment statistics using the ILO definition and they remain the benchmark and headline indicators.
Direct access to
- All articles on the Labour Market
- Labour market in the light of the COVID 19 pandemic - quarterly statistics
- Employment - quarterly statistics
- Employment in detail - quarterly statistics
- Employment - annual statistics
- Labour market slack – annual statistics on unmet needs for employment
- Labour market statistics at regional level
- New measures of labour market attachment - Statistics in focus 57/2011
- Labour force survey in the EU, EFTA and candidate countries — Main characteristics of national surveys, 2020, 2022 edition
- Quality report of the European Union Labour Force Survey 2020, 2022 edition
- Labour market in the light of the COVID 19 pandemic — online publication
- EU labour force survey — online publication
- European Union Labour force survey - selection of articles (Statistics Explained)
- LFS main indicators (lfsi)
- Unemployment - LFS adjusted series (une)
- Supplementary indicators to unemployment - annual data (lfsi_sup_a)
- Supplementary indicators to unemployment - quarterly data (lfsi_sup_q)
- Unemployment - LFS adjusted series (une)
- LFS series - Detailed annual survey results (lfsa)
- Total unemployment - LFS series (lfsa_unemp)
- Supplementary indicators to unemployment by sex and age (lfsa_sup_age)
- Supplementary indicators to unemployment by sex and educational attainment level (lfsa_sup_edu)
- Supplementary indicators to unemployment by sex and citizenship (lfsa_sup_nat)
- Total unemployment - LFS series (lfsa_unemp)
- LFS series - Detailed quarterly survey results (lfsq)
- Total unemployment - LFS series (lfsq_unemp)
- Supplementary indicators to unemployment by sex and age (lfsq_sup_age)
- Supplementary indicators to unemployment by sex and educational attainment level (lfsq_sup_edu)
- Total unemployment - LFS series (lfsq_unemp)
Methodology
Publications
- EU labour force survey — online publication
- Labour force survey in the EU, EFTA and candidate countries — Main characteristics of national surveys, 2020, 2022 edition
- Quality report of the European Union Labour Force Survey 2020, 2022 edition
- New measures of labour market attachment - Statistics in focus 57/2011
ESMS metadata files and EU-LFS methodology
- Employment and unemployment (Labour Force Survey) (ESMS metadata file — employ_esms)
- LFS series - detailed quarterly survey results (from 1998 onwards) (ESMS metadata file — lfsq_esms)
- LFS series - detailed annual survey results (ESMS metadata file — lfsa_esms)
- LFS ad-hoc modules (ESMS metadata file — lfso_esms)
- LFS main indicators (ESMS metadata file — lfsi_esms)
- LFS regional series (ESMS metadata file — reg_lmk)
