International trade in goods by mode of transport
Data extracted in June 2024
Planned article update: no update planned
Highlights
Measured in value, in 2023, sea transportation accounted for 47 % of goods traded between the EU and the rest of the world, measured in volume the share was 74 %.
Globalisation patterns in EU trade and investment is an online Eurostat publication presenting a summary of recent European Union (EU) statistics on economic aspects of globalisation, focusing on patterns of EU trade and investment.
This article focuses on developments for international trade in goods analysed by mode of transport. Goods would historically have been stored in a warehouse close to a port until an empty vessel was available, onto which they would typically be loaded by hand (in sacks, crates, barrels); this process was known as break bulk cargo. In 1956, the container ship was invented, while a set of international standards for container sizes was agreed at the end of 1970, including the industry standard for referencing cargo volumes, the Twenty foot Equivalent Unit (TEU). During the 1970s there was a restructuring of the maritime industry, with considerable investment in new vessels and port facilities, after which container ships became the most common and economically viable means of transporting goods over lengthy distances. Their introduction drastically lowered transport freight charges and may be viewed as one of the main drivers behind globalisation; furthermore, shipping containers offer interoperability insofar as they can also be used for further transportation by road or rail.
Statistics on international trade in goods by mode of transport
International trade statistics by mode of transport are collected for the 'active means of transport' (for example, road, rail, sea) with which goods are presumed to leave from or arrive in the statistical territory of an EU country. Such data may be used to formulate transport policy, monitor international transport routes or assess the impact of international trade on the environment.
Note that all of the statistics presented in this article refer to trade in goods for extra-EU flows. By contrast, road transportation is often the most flexible and common mode of transporting goods within the EU, as there is an extensive motorway network and the single market provides for a seamless transition when crossing national borders.
Full article
Trade by mode of transport in value and quantity
There are a wide range of factors that may influence the decisions of enterprises as to which type of transport they use when trading goods, among others: the destination country, the size and weight of the goods being transported, the speed of delivery (for example, perishable goods), rules and regulations (for example, concerning the transport of animals), environmental or security considerations (for example, dangerous goods).
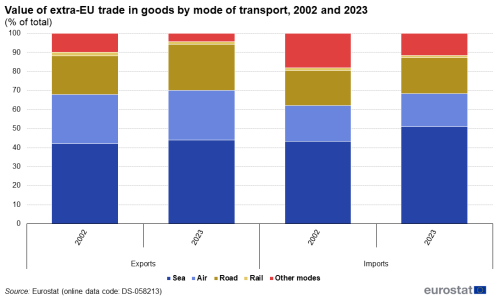
Measured in value, in 2023, sea transportation accounted for 47 % of goods traded between the EU and the rest of the world, measured in volume the share was 74 %.
Figure 1 shows the structure of extra-EU trade by mode of transport, with sea transportation accounting for 43.9 % of the value of goods exported from the EU and 51.0 % of goods imported into the EU in 2023. Air transportation accounted for 26.2 % of the EU's exports and 17.4 % of its imports. Road transportation accounted for 24.1 % of the EU's exports and 18.7 % of its imports. Other modes of transport which include pipelines accounted for 4.3 % of exports and 11.6 % of imports. Rail transportation (1.5 % exports, 1.3 % imports) had only a minor share.
The share of imported goods that were transported by sea rose by 7.8 percentage points (pp) during the period under consideration, while there was a much smaller increase in the use of sea transportation for EU exports, their share rising by 1.9 pp. The share of goods transported by road increased by 0.5 pp for imports and 3.8 pp for exports. Imports and exports by other modes of transport decreased by 6.5 pp and 5.7 pp respectively.

(% of total)
Source: Eurostat Comext DS-058213
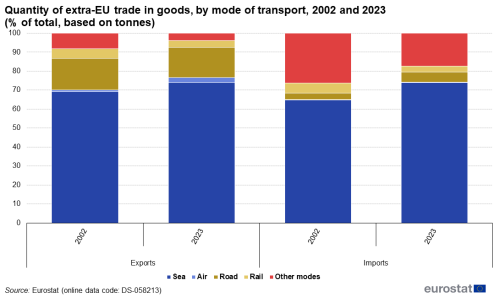
Figure 2 shows a similar analysis but in quantity rather than value terms. It shows that the relative importance of sea transportation was even greater, accounting for 74.1 % of EU exports and 74.0 % of EU imports in 2023. There was also confirmation that the relative share of sea transportation in the total quantity of goods transported to and from the EU rose between 2002 and 2023. It is interesting to note that in quantity terms (based on tonnes), air transportation accounted for just 2.5 % of the EU's exported goods and 0.2 % of its imported goods in 2023; the difference when compared with the shares of air transportation in value terms gives an indication as to the high unit value of goods transported by air.

(% of total, based on tonnes)
Source: Eurostat Comext DS-058213
Variations by EU country
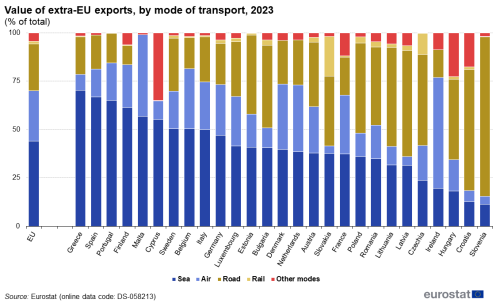
Among the EU countries, Greece, Spain and Portugal recorded the highest shares of their extra-EU exports in 2023 carried by sea
As noted above, geographical location may play an important role in determining the relative importance of different modes of transport that are used for transporting goods. For example, Ireland, Cyprus and Malta are all islands separated from mainland Europe, while countries such as Greece, Portugal and Finland are found around the periphery of the EU, a relatively long distance away from some of Europe's main transport hubs. That said, infrastructure developments have improved connections (in the form of new roads and rail links, tunnels, bridges and pipelines) so that there are nowadays far greater possibilities for onward transport to these countries.
Figure 3 presents information on the preferred mode of transport for each of the EU countries in 2023; note again that the statistics presented concern only extra-EU trade. The highest proportions of extra-EU exports (in value terms) carried by sea were recorded in Greece (70.2 %), Spain (66.8 %) and Portugal (65.1 %); sea was the principal mode of transport for extra-EU exports in a majority (16) of the EU countries. Air transportation was the preferred mode of transport for exports from Ireland (57.3 %) in 2023. By contrast, road transportation had the highest share in several of the eastern countries that joined the EU in 2004 or more recently, reflecting their geographical location close to a number of neighbouring countries on the Eurasian landmass.

(% of total)
Source: Eurostat Comext DS-058213
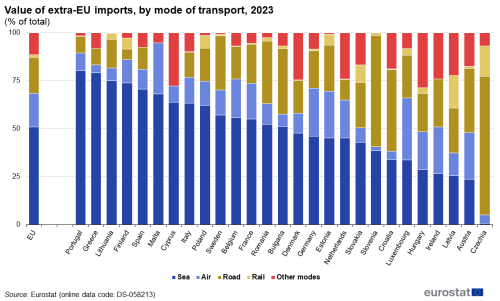
As regards goods imported into the EU (as shown in Figure 4), the relative importance of sea transportation was generally even greater. Indeed, sea was the preferred mode of transport for imports in 23 of the EU countries in 2023. It accounted for more than 75 % of the total value of imports from countries outside the EU in Portugal (80.3 %), Greece (79.0 %) and Lithuania (75.0 %). Road transportation was the preferred mode of transport in Czechia (72.1 %), Slovenia (58.0 %), Croatia (42.4 %) and Austria (33.3 %).

(% of total)
Source: Eurostat Comext DS-058213
Source data for tables and graphs
Direct access to