Archive:Enlargement countries - education statistics
Data extracted in June 2021.
Planned article update: April 2022.
Highlights
In 2019, the proportion of early leavers from education and training among persons aged 18-24 was the highest in Turkey among the candidate countries and potential candidates, with 28.9 % of young men and 28.6 % of young women.
In all candidate countries and potential candidates for which data is available (no data for Kosovo), the ratio of men having graduated from a science or technology discipline was higher than the ratio of women in 2019.
Persons of 30-34 years old having completed tertiary or equivalent education, 2009 and 2019
This article is part of an online publication and provides information on a range of education statistics for the European Union (EU) enlargement countries, in other words the candidate countries and potential candidates. Montenegro, North Macedonia, Albania, Serbia and Turkey currently have candidate status, while Bosnia and Herzegovina and Kosovo* are potential candidates.
The article gives an overview of education developments, presenting an analysis of the different educational levels in terms of enrolment, educational attainment and tertiary education.
Full article
Number of pupils and students
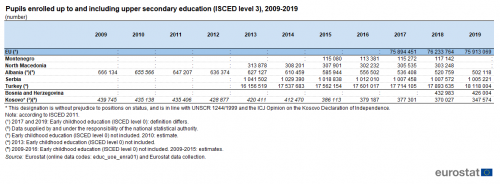
Table 1 presents the number of pupils attending up to and including upper secondary education (as covered by ISCED 2011 level 3) over the period 2009-2019 when data is available. Among the candidate countries and potential candidates, Turkey was the country with the highest number of pupils, which constantly increased between 2013 and 2018, and reached a level of 18.1 million in 2019. The second highest country, but with much lower numbers, was Serbia, with 1.0 million pupils in 2019. However, Serbia showed a continuous small decrease of attendance between 2013 and 2019, with an exception between 2017 and 2018 when the numbers were approximately identical. Albania and Kosovo also reported a decrease in education attendance between 2009 and 2019. Albania went from 666 134 pupils in 2009 to 502 118 in 2019, and Kosovo from 439 745 in 2009 to 347 574 in 2019 (with a small increase between 2010 and 2011). With data available for only two years, Bosnia and Herzegovina had 432 983 pupils in 2018 and 426 004 in 2019. From 2013 and 2018, North Macedonia also decreased from 313 878 pupils to 303 248 (with a small increase in 2017). Finally, the candidate country and potential candidate with the lowest attendance number of pupils up to upper secondary education, was Montenegro, with numbers 2.6 times smaller than in North Macedonia, reaching 117 142 pupils in 2018 and an increase of 1.6 % compared to 2017.
(number)
Source: Eurostat (educ_uoe_enrp01) and (educ_uoe_enra01) and from annual data collection cycle – see Data Sources
Overall in 2018, there were approximately 20.6 million pupils enrolled up to and including upper secondary education in the candidate countries and potential candidates; this was equivalent to a little over one quarter (27.1 %) of the total number of pupils enrolled up to and including upper secondary education in the EU, which was 76.2 million in 2018. After a slight decrease, this number reached 75.9 million pupils in 2019.
While the absolute number of pupils and students is closely linked to the size and age structure of populations, there is a range of other factors that influence how long students remain in the education system, such as the length of compulsory schooling, opportunities in the labour market and the availability and cost of tertiary education. In recent years, policy interest has focused on encouraging young people to remain within educational systems so they may develop skills and gain qualifications that may help in the search for work in an increasingly knowledge-driven economy.
Early leavers from education and training
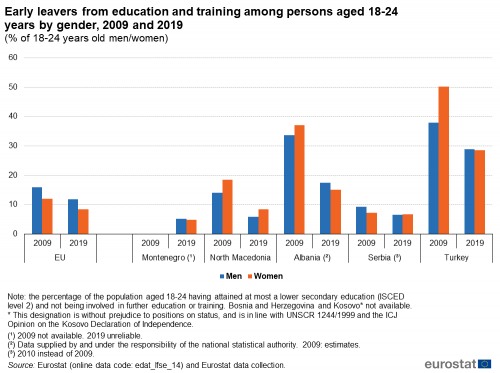
Figure 1 presents the share of early leavers (who finished no more than a lower secondary education and were not involved in further education or training) from education and training among persons aged 18-24 years by gender in 2009 and 2019.
In 2019, the proportion of early leavers from education and training among persons aged 18-24 was the highest in Turkey, with at 28.9 % of young men and 28.6 % of young women. These proportions were also relatively high in Albania with 17.5 % of young men and 15.1 % of young women. However, there were lower proportions of early leavers from education and training in Montenegro (5.2 % of young men and 4.9 % of young women), North Macedonia (5.9 % of young men and 8.4 % of young women) and Serbia (6.5 % of young men and 6.7 % of young women). In comparison, the proportion of early leavers from education and training in 2019 stood at 11.8 % in the EU among young men and 8.4 % among young women.
In Albania, Turkey and Montenegro, the proportion of early leavers was higher for young men than for young women, as in the EU, whereas in North Macedonia and Serbia the reverse situation was observed.
(% of 18-24 years old men/women)
Source: Eurostat (edat_lfse_14) and from annual data collection cycle – see Data Sources
Youth education attainment
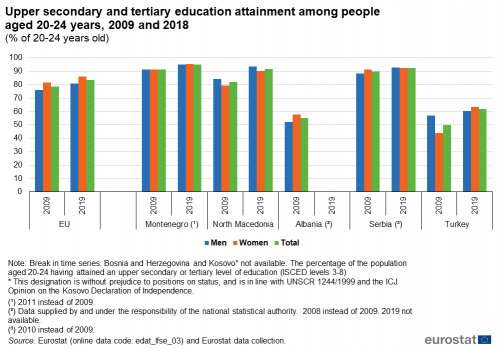
An alternative measure for analysing the outcomes of education systems is the youth education attainment level. This indicator is defined as the proportion of 20-24 year olds who have achieved at least an upper secondary level of education attainment (at least ISCED level 3). Data by gender are presented in Figure 2 as well as for the total population.
In 2019, there were three candidate countries and potential candidates which reported a higher proportion of persons aged 20-24 having attained at least an upper secondary level of education, compared to the EU. These were Montenegro (95.2 %), Serbia (92.5 %) and North Macedonia (91.9 %). A considerably lower level of youth educational attainment was recorded in Turkey (62.0 %). No 2019 data are available for Albania, Bosnia and Herzegovina and Kosovo. The share of the EU population aged 20-24 with at least an upper secondary level of education stood at 83.5 % in 2019.
(% of 20-24 years old)
Source: Eurostat (edat_lfse_03) and from annual data collection cycle – see Data Sources
The proportion of persons aged 20-24 having attained at least an upper secondary level of education rose in all candidate countries and potential candidates for which data is available between 2009 and 2019, most notably in Turkey (+12.0 percentage points (pp) and North Macedonia (+10.0 pp). In the EU, the overall youth education attainment rose by 4.9 pp over the same period. It should be noted that there is a break in series.
When comparing the proportion of men and women, Montenegro and Turkey reported higher proportions for young women in 2019. The gender gap was the highest in Turkey with 2.9 pp while it was 0.2 pp in Montenegro. By contrast, North Macedonia and Serbia recorded higher rates for young men than young women, with a difference of 3.5 pp and 0.3 pp, respectively. If the situation regarding the gender gap was quite similar in 2009 for Montenegro (2011 data) and North Macedonia, it was reversed for Serbia (2010 data) and Turkey. In 2009, the proportion for young men in Turkey was much higher than for young women (13.1 pp of difference), while it was the contrary in Serbia with 2.8 pp difference in favour of young women. Within the EU, the gender gap in youth education attainment levels stood at 5.2 pp in 2019, with a higher level of attainment for young women than for young men; similar to the situation in 2009 (5.8 pp).
Tertiary education
Figure 3 shows the annual average change rate of students in tertiary education (ISCED levels 5-8) between 2014 and 2019. Among the candidate countries and potential candidates, there was an increase in the number of tertiary students in three cases: Turkey (+ 7.3 % per year), Kosovo (+6.6 %) and Serbia (+0.6 %). An average decrease of 4.4 % per year was recorded in Albania, with smaller annual average decreases in Montenegro (2.6 % between 2016 and 2019) and North Macedonia (0.1 % between 2014 and 2018). No data is available for Bosnia and Herzegovina. Some of these changes in student numbers may reflect demographic developments (for example, a growing number of young people in countries characterised by relatively high birth rates, or an overall decline in the number of young people in those countries with declining rates), rather than changes in the uptake of tertiary education among young people. In comparison, the number of tertiary education students in the EU increased on average by 0.4 % per year between 2014 and 2019.

(% average change rate)
Source: Eurostat (educ_uoe_enrt01) and from annual data collection cycle – see Data Sources
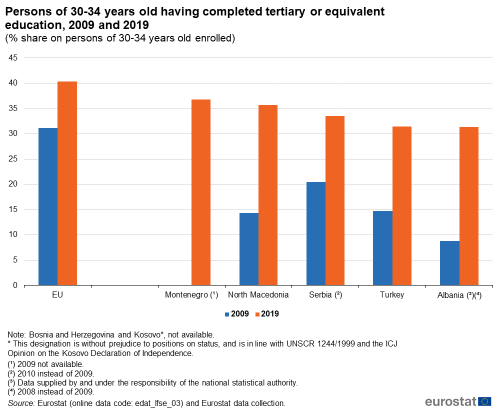
Figure 4 shows the proportion of 30-34 year olds who had completed a tertiary level of education. Montenegro reported the highest proportion in 2019 among the candidate countries and potential candidates for which data are available, with 36.8 %. There is no data for Bosnia and Herzegovina and Kosovo. The other countries ranged from just under one third in Albania and Turkey (31.3 and 31.4 % respectively) to just above it in Serbia and North Macedonia (33.5 and 35.7 % respectively). All these countries reported lower proportions of 30-34 year olds having completed a tertiary level of education than in the EU, where it stood at two fifths (40.3 %) of this subpopulation in 2019.
When comparing to 2009, the change in the proportion of 30-34 year olds who had completed a tertiary level of education was the highest in Albania (+22.5 pp between 2008 and 2019), followed by North Macedonia (+21.4 pp), Turkey (+16.7 pp) and Serbia (+13.0 pp between 2010 and 2019). There is no 2009 data for Montenegro. In the EU, there was a change of 9.2 pp between 2009 and 2019.
(% share on persons of 30-34 years old enrolled)
Source: Eurostat (edat_lfse_03) and from annual data collection cycle – see Data Sources
Figure 5 presents the repartition between men and women in tertiary education graduates in science and technology in 2014 and 2019. In all candidate countries and potential candidates for which data is available (no data for Kosovo), the ratio of men having graduated from a science or technology discipline was higher than the ratio of women in 2014 and 2019, with one exception. Indeed, Albania was the only candidate country where the ratio of women having graduated from a science and technology discipline was higher (in 2014) than the ratio for young men.
In 2019, the lowest ratio of women having graduated from a science or technology discipline was observed in Turkey, with 34.5 %, which is a similar share than in 2014 (34.7 %). In all the other countries, this ratio was higher than 40 % in 2019. In Serbia, it was 42.1 % (+1.8 pp compared to 2014); in Montenegro 44.6 % (+4.9 pp compared to 2014); in Bosnia and Herzegovina 47.4 % (no data for 2014); in North Macedonia 47.6 % (+6.7 pp compared to 2014) and in Albania 48.1 % (-4.3 pp compared to 2014).
In comparison, the number of male graduates in 2018 with a science or technology degree was 66.8 % in the EU (2019 data not available). This was approximately twice as high as the corresponding ratio for women (33.2 %). The situation was similar in 2014 (67.0 % for men and 33.0 % for women).
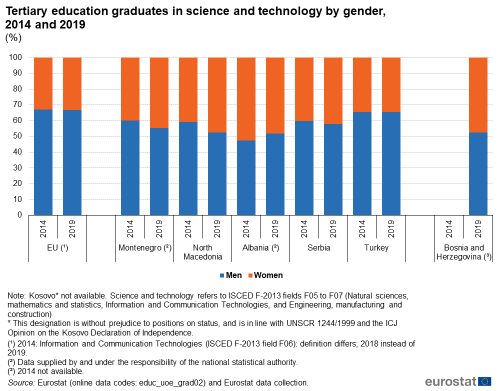
(%)
Source: Eurostat (educ_uoe_grad02) and from annual data collection cycle – see Data Sources
Source data for tables and graphs
Data sources
Data for the candidate countries and potential candidates are collected for a wide range of indicators each year through a questionnaire that is sent by Eurostat to candidate countries or potential candidates. A network of contacts has been established for updating these questionnaires, generally within the national statistical offices, but potentially including representatives of other data-producing organisations (for example, central banks or government ministries). The statistics shown in this article are made available free-of-charge on Eurostat’s website, together with a wide range of other socio-economic indicators collected as part of this initiative.
Education statistics cover a range of subjects, including: expenditure, personnel, participation and attainment. The standards for international statistics on education are set by three organisations:
- the United Nations Educational, Scientific, and Cultural Organisation (UNESCO) institute for statistics (UIS);
- the Organisation for Economic Cooperation and Development (OECD);
- Eurostat, the statistical office of the European Union (EU).
The main source of data for the EU aggregate is a joint UNESCO/OECD/Eurostat (UOE) questionnaire on education systems and this is the basis for the core components of the Eurostat database on education statistics; Eurostat also collects data on regional enrolments and foreign language learning. EU data on educational attainment are mainly provided through household surveys, in particular the EU labour force survey (LFS).
Tables in this article use the following notation:
| Value in italics | data value is forecasted, provisional or estimated and is therefore likely to change; |
| : | not available, confidential or unreliable value. |
Context
Each EU Member State is responsible for its own education and training systems. As such, EU policy in this area is designed to support national action and address common challenges, by providing a forum for exchanging best practices. Through the strategic framework for European cooperation in education and training (known as ET 2020), which was adopted by the Council in May 2009, EU Member States identified four common objectives for 2020: making lifelong learning and mobility a reality; improving the quality and efficiency of education and training; promoting equity, social cohesion, and active citizenship; and enhancing creativity and innovation, including entrepreneurship, at all levels of education and training. The strategy sets a number of benchmarks in relation to education that are to be achieved in the EU by 2020, including:
- at least 95 % of children between the age of four and the age for starting compulsory primary education should participate in early childhood education;
- the share of early leavers from education and training should be less than 10 %;
- the share of low-achieving 15-year olds in reading, mathematics and science should be less than 15 %;
- the share of 30-34 year olds with tertiary educational attainment should be at least 40 %.
While basic principles and institutional frameworks for producing statistics are already in place, the candidate countries and potential candidates are expected to increase progressively the volume and quality of their data and to transmit these data to Eurostat in the context of the EU enlargement process. EU standards in the field of statistics require the existence of a statistical infrastructure based on principles such as professional independence, impartiality, relevance, confidentiality of individual data and easy access to official statistics; they cover methodology, classifications and standards for production.
Eurostat has the responsibility to ensure that statistical production of the candidate countries and potential candidates complies with the EU acquis in the field of statistics. To do so, Eurostat supports the national statistical offices and other producers of official statistics through a range of initiatives, such as pilot surveys, training courses, traineeships, study visits, workshops and seminars, and participation in meetings within the European Statistical System (ESS). The ultimate goal is the provision of harmonised, high-quality data that conforms to European and international standards.
Additional information on statistical cooperation with the candidate countries and potential candidates is provided here.
Notes
* This designation is without prejudice to positions on status, and is in line with UNSCR 1244/1999 and the ICJ Opinion on the Kosovo Declaration of Independence.
Direct access to
Other articles
- Enlargement countries — statistical overview — online publication
- Statistical cooperation — online publication
Publications
- Statistical books/pocketbooks
- Key figures on enlargement countries — 2019 edition
- Key figures on enlargement countries — 2017 edition
- Key figures on the enlargement countries — 2014 edition
- Leaflets
- Basic figures on enlargement countries — 2019 edition
- Basic figures on enlargement countries — 2018 edition
- Basic figures on enlargement countries — 2016 edition
Database
- Population and social conditions (cpc_ps)
- Candidate countries and potential candidates: education (cpc_pseduc)
- Participation in education and training (educ_part)
- Pupils and students - enrolments (educ_uoe_enr)
- Education and training outcomes (educ_outc)
- Educational attainment level (edat)
- Population by educational attainment level (edat1)
- Transition from education to work (edatt)
- Early leavers from education and training (edatt1)
- Educational attainment level (edat)
- Education administrative data until 2012 (ISCED 1997) (educ_uoe_h)
- Education indicators - non-finance (educ_indic)
- Distribution of pupils/ students by level (educ_ilev)
- Tertiary education graduates (educ_itertc)
- Enrolments, graduates, entrants, personnel and language learning (educ_isced97)
- Students by ISCED level, age and sex (educ_enrl1tl)
- Education indicators - non-finance (educ_indic)
Dedicated section
Methodology
- Candidate countries and potential candidates (ESMS metadata file — cpc_esms)