Archive:SDG cross-cutting issues - spillover effects
Developing experimental indicators for estimating spillover effects caused by consumption — a model-based approach
Data extracted in May 2021.
Planned article update: June 2022.
Highlights
This article is a part of a set of statistical articles, which are based on the Eurostat publication ’Sustainable development in the European Union — Monitoring report on progress towards the SDGS in an EU context — 2021 edition’. This report is the fifth edition of Eurostat’s series of monitoring reports on sustainable development, which provide a quantitative assessment of progress of the EU towards the SDGs in an EU context.
Full article
Developing experimental indicators for estimating spillover effects caused by consumption — a model-based approach
Strategies to achieve the SDGs need to be implemented at multiple scales — from local to global. Ideally, achieving the SDGs should mutually foster positive impacts in all regions while negative impacts on other regions should be avoided. The impacts that policies and strategies in one region have on other regions are called spillover effects (or simply ‘spillovers’). At the level of countries, the term transboundary effects is also often used. Transboundary effects are said to occur when one country’s actions generate benefits or impose costs on another country.
The demand for assessing spillover effects is immense while quantifying them accurately is challenging. Many organisations emphasise the importance of international spillovers for achieving the SDGs globally. The OECD conducted an expert-based assessment which concluded that 97 out of 169 SDG targets have a transboundary component [1]. Half of these targets related to support for developing countries in achieving the SDGs. Most of the transboundary targets were in the environment-related SDGs (SDG 6, 12, 13, 14 and 15). The Sustainable Development Solutions Network (SDSN) has incorporated an international spillover index in its SDG Index and Dashboards assessment which tracks the annual performance of all UN member states on the SDGs. Some EU Member States have begun to reflect spillovers in their SDG implementation [2]. For example, Finland has included a section on international spillovers in its 2020 Voluntary National Review (VNR) presented at the UN.
Many organisations have carried out studies on spillover effects and have examined and tested relevant data and methods to measure them but so far a common understanding on methods and mature global data seem to be lacking.
SDG 17 ‘Partnerships for the goals’ calls for a global partnership for sustainable development and highlights the importance of trade and policy coherence for sustainable development. Trade and investment liberalisation can promote the transfer of environmentally sound technologies and trade may also provide incentives to companies to apply higher environmental standards in their business models and supply chains. SDG Target 8.a ‘Increase Aid for Trade support’ therefore aims to strengthen the trade relationships with developing countries. EU trade agreements consequently feature dedicated chapters on trade and sustainable development, with binding commitments on labour standards, environmental protection and responsible business conduct. At government level, developed countries support developing countries with direct investments and official development assistance which help strengthen, for instance, health and education systems and infrastructure.
At the same time, it is harder for countries to achieve the SDGs if negative spillovers from other countries counteract their efforts. As an example, unsustainable supply chains to produce imported goods can cause environmental degradation — such as deforestation and biodiversity loss — in the countries that supply raw materials.
It is therefore essential that the achievement of national or EU-wide sustainability targets (for instance on climate neutrality or biofuel strategies) do not undermine other countries’ action on sustainable development. Better estimates of greenhouse gas emissions, air pollutants, water scarcity, biodiversity threats, jobs and income as well as other impacts generated through production and consumption of globally traded goods and services will allow developing more effective policies. At the same time, the EU needs more reliable data and information to underpin the development agendas it is working on together with developing countries.
The purpose of this article is to provide an initial attempt to estimate positive and negative environmental, economic and social spillover effects due to the consumption of imported goods and services. It is important to note that there are other types of spillover effects that are relevant in the context of the SDGs but are not covered in this article. These include spillover effects related to international financing (for example official development assistance or profit shifting), those linked to physical flows of air and water carrying pollution across borders, and those related to peacekeeping and security. Further work on assessing spillover effects in a broader sense will be necessary over the coming years.
Measuring the spillover effects embedded in imports and exports requires a change of approach from ‘production-based’ to ‘consumption-based’. ‘Production-based’ means, for example, direct observation of CO2 emissions as they are generated, while ‘consumption-based’ refers to, for example, CO2 emissions that are generated throughout the supply chain and are hence ‘embedded’ in the products and services consumed. These CO2 emissions are generated before the products are consumed, in different locations, and scattered across supply chains that may involve many countries.
Measuring spillover effects remains challenging as it requires both extensive geographic coverage and granular data on global supply chains. Statistical measures of cross-border flows are typically limited to direct flows, such as imports and exports of goods and services. Measuring spillover effects requires data on both countries’ consumption and production flows and on the socioeconomic and environmental impacts of specific products and sectors throughout the entire supply chain. Many of these (often indirect) impacts cannot be directly observed and therefore quantifying them requires making assumptions and model-based estimates.
So far, modelling tends to be outside the normal range of activities of most national statistical offices and, consequently, methods to track environmental and social impacts embedded in imports and exports mainly come from research projects and civil society organisations rather than official statistics. However, there is a growing set of model-based estimates that rely on official statistics. Eurostat as a supra-national statistical office has for several years invested heavily in tracking transboundary environmental impacts by modelling footprint indicators based on official statistics.
In addition, the European Commission has several ongoing projects and activities related to consumption-based accounting. In 2019, the European Commission’s Joint Research Centre (JRC) released a detailed study [3] on the development of two sets of life-cycle assessment-based indicators to assess the environmental impacts of EU consumption covering 130 representative products [4]. The full international and global accounts for research in input–output analysis (FIGARO) involving Eurostat and the JRC aims to provide tools for analysing the socio-economic and environmental effects of globalisation in the EU [5].
Consumption-based indicators are currently less developed and generally less reliable than other indicators based on official statistics. Therefore, the indicators presented here are not yet part of the EU SDG set and the trends are not assessed according to the standard Eurostat assessment methodology used in the rest of this report. Eurostat will continue to strengthen its work on measuring consumption-based spillovers for future editions of this report.
The data used in this chapter belong to two principal categories of data sources:
- Eurostat footprints based on the System of Economic-Environmental Accounts (SEEA) standard.
- Multi-regional input–output (MRIO) tables for a range of environmental, social and economic indicators from the research and policy-oriented Global Industrial Ecology Virtual Laboratory platform (Global MRIO Lab).
Indicators on consumption-based spillovers
This section presents a selection of indicators on environmental, social and economic spillover effects of consumption in EU Member States, including effects caused globally for the production of goods and services. The indicators were selected primarily on the bases of data availability and therefore they do not yet cover the full range of SDGs concerned by spillover effects.
Environmental spillover effects
Three environmental footprint indicators can be presented: material footprint, carbon footprint and air pollution footprint. These are primarily related to SDG 13 (Climate action), SDG 8 (Decent work and economic growth) and SDG 12 (Responsible consumption and production).
Material footprint
Eurostat’s material footprint indicators quantify the worldwide demand for material extraction (biomass, metal ores, non-metallic minerals and fossil energy materials/carriers) triggered by consumption and investment by households, governments and businesses in the EU. In the official UN SDGs monitoring framework, this is covered under SDG 8 (Decent work and economic growth) and SDG 12 (Responsible consumption and production with the Indicator 12.2.1: Material footprint, material footprint per capita, and material footprint per GDP).
In addition to statistics on physical imports and exports, Eurostat produces estimates of material footprints of imported and exported products by calculating the actual weight of materials extracted to produce the traded goods instead of the weight when the goods cross country borders — so-called raw material equivalents (RME) of imports and exports. In other words, the weight of processed goods traded internationally is converted into the corresponding raw material extractions they would have required. This is typically two to three times more than the actual weight. This enables users to compare the material footprints of imports and exports and the material footprint of extractions made in the EU, and Eurostat can produce indicators on this basis.
The material footprint of domestic extractions plus imports in RME minus exports in RME is also called raw material consumption, which measures the total volume of raw materials required to produce the goods used by the economy. According to Eurostat estimates, raw material consumption was 14.5 tonnes per capita in the EU in 2018.
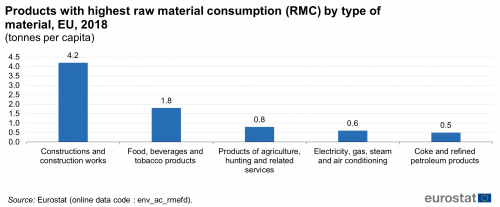
Figure 1 shows in more detail which product groups are the main drivers of material extraction. The product categories with highest material footprint in the EU are construction (4.2 tonnes per capita), food, beverages and tobacco products (1.8 tonnes per capita), agricultural products (0.8 tonnes per capita), electricity generation (0.6 tonnes per capita) and coke and refined petroleum products (0.5 tonnes per capita).
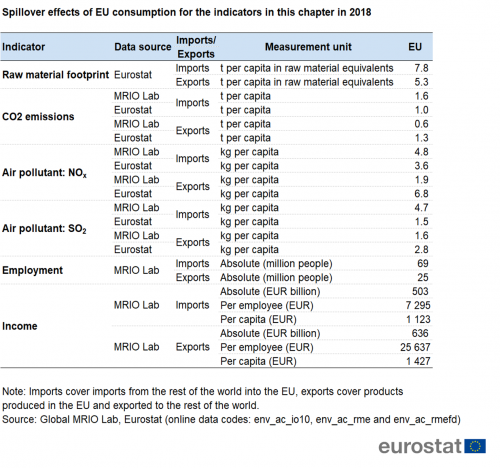
Imports from outside the EU expressed in raw material equivalents are estimated at 7.8 tonnes per capita (RME) in 2018, while exports are estimated at 5.3 tonnes per capita (RME). This means that in 2018 the EU was a net importer of materials.
Figure 2 shows the total raw material footprint of the 7.8 tonnes per capita of imports in RME, broken down by high-level groupings of material categories. The shares of the categories metal ores and fossil energy materials and carriers are the largest. This suggests that imported materials are not only used for consumption products, such as food or clothes, but also for housing and energy. It is worth noting that not all materials create the same environmental pressure — such as land use — or generate pollution or social impacts at their places of origin. For example, mining and agriculture have different impacts on land use. A deeper analysis per product using more detailed information on production technologies and place of origin is therefore needed to understand the full picture.
Of the raw products (in physical terms), including metal ores and non-metallic minerals, that are imported into the EU, 23.9 % come from Latin American countries, 19.7 % from Asia and 9.4 % from Africa [6].

Source: Eurostat (env_ac_rmefd)

Source: Eurostat (env_ac_rme)
Carbon footprint and CO2 emissions
Eurostat and MRIO tables represent two different methodologies for estimating the EU’s carbon footprint.
Building on Eurostat’s air emission accounts, Eurostat uses the ‘domestic technology assumption’ and hence estimates the volume of emissions ‘avoided’ on the EU territory through imports. In other words, Eurostat estimates the volume of emissions that would have been emitted by European industry if the imported goods had been produced in the EU. This volume per capita can at the same time be considered an approximation of the emissions occurring in the rest of the world. However, the ‘real’ emissions occurring abroad could be higher or lower, depending on the technologies and energy used in the countries that export to the EU.
Based on economic information and air emissions accounts (AEA), Eurostat estimates the CO2 emissions embedded into EU exports and imports in 2019 at 1.28 and 1.02 tonnes of CO2 per capita, respectively [7]. This means that the EU emitted 0.26 tonnes of CO2 per person more to produce exports than it avoided in the EU by importing goods and services. This can be explained by the relatively higher volume of raw materials imported into the EU (see above) and the relatively higher volume of processed products exported from the EU, which require energy for processing and manufacture. Services, which constitute a large share of the EU economy and its exports, also have substantial amounts of CO2 emissions embedded.
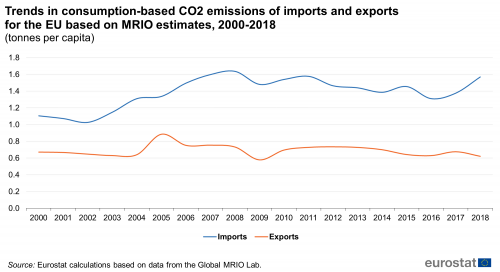
In contrast to Eurostat’s methodology, the MRIO data from the Global MRIO Lab seek to estimate the ‘real’ emissions in the rest of the world for goods delivered to the EU. This is very challenging due to limited information about local production technologies. MRIO estimates show that in 2018, around 1.6 tonnes of CO2 per capita were emitted abroad for the production of goods and services for the EU. Figure 3 shows that according to the MRIO estimates for 2000 to 2018, the EU has been a net-importer of CO2 emissions. This means that the EU’s emissions embedded in the import of goods and services were higher than the emissions embedded in its exports.
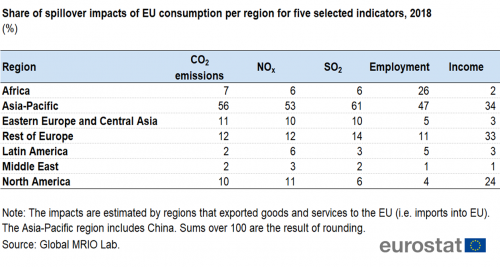
Both the Eurostat method and the MRIO-based estimates include transport-related CO2 emissions. According to MRIO Lab data, most CO2 emissions embedded in the EU’s imports are generated by imports from countries in the Asia-Pacific region (see Table 2).

Source: Eurostat calculations based on data from the Global MRIO Lab.
Air pollution footprint
The air pollution footprint covers gases such as sulphur dioxide (SO2) and nitrogen oxide (NOx) that are mostly emitted during fossil fuel combustion, for example in power plants, and have documented adverse health effects, such as respiratory illnesses. Goods and services have embedded air pollution whenever these gases are emitted during the production process, throughout the supply chain. According to the ‘real’ emissions estimates based on MRIO Lab data, NOx emissions embedded in EU imports and exports in 2018 were 4.84 kg and 1.95 kg per capita, respectively. The SO2 pollution levels per capita are comparable, estimated at 4.7 kg per capita for imports and 1.5 kg per capita for exports.
This means that the consumption of imported products in the EU is estimated to contribute more to air pollution in exporting countries worldwide than the production of exported products generates in the EU [8]. This might be partially explained by differences in environmental standards but information on local production technologies is limited. The global SDG target 17.7 to ‘promote the development, transfer, dissemination and diffusion of environmentally sound technologies to developing countries’ aims to reduce these differences.
For both gases, the highest share of total emissions caused by consumption in the EU (52 % for NOx and 61 % for SO2) were generated in the Asia-Pacific region.
Social spillover effects: employment
The social indicator ‘employment’ primarily links with SDG 8 (Decent work and economic growth). It estimates the number of people employed directly or indirectly in the production of goods and services for EU Member States along the full supply chain. The indicator is based on MRIO data and includes both male and female employment but does not include child labour [9]. Employment is considered to be a positive spillover effect as EU consumption generates jobs in global supply chains.
In 2018, around 25 million people worked in the EU in the production of goods and services that were destined for exports. By contrast, around 69 million people worked outside the EU in the supply chains of products (such as food, textiles, other manufactured items) consumed in the EU. This means that imports into the EU generated around 44 million more jobs in exporting countries than demand from those countries for EU goods and services generated in the EU. In other words, the EU is a net exporter of jobs. As shown in Table 2, most of these jobs are located in the Asia-Pacific region (47 %) and in Africa (27 %). Eastern Europe and Central Asia, Latin America, the Middle East, North America and the rest of Europe together accounted for the remaining 26 % of the spillover effects on employment.
Economic spillover effects: income
The economic indicator tracking income primarily links with SDG 8 (Decent work and economic growth), SDG 12 (Responsible consumption and production) and SDG 17 (Partnerships for the goals). It estimates wages and salaries paid to people directly or indirectly employed in the supply chains of goods for EU consumption and is based on MRIO data.
The income generated abroad in 2018 through the production of goods and services for the EU is estimated at around EUR 500 billion, while the income generated in the EU associated with exports to the rest of the world is estimated at around EUR 636 billion (see Table 1).
Income exports per employee are around EUR 25 600, and income imports are around EUR 7 300 per employee. This means that in 2018 exports to the rest of the world generated an income of about EUR 18 300 per employee more than the income generated in countries that produce goods and services for the EU. In other words, the EU is a net exporter for this indicator and wages and salaries paid to workers in the EU for the production of exports are higher than the income received by workers overseas for the production of EU imports. Differences in purchasing power may explain to some extent this pay gap.
A breakdown of the EU’s total imports by global regions reveals that the income-related spillover effects primarily take place in the Asia-Pacific region, the rest of Europe and in North America.
Conclusions
Trade with the EU is a crucial source of income and economic activity in many EU partner countries, including some of the poorest countries in the world. This is recognised notably under SDG 17 (Partnerships for the goals). The indicator on income used in this report suggests that in 2018 the EU’s imports provided employment to 69 million people and generated EUR 500 billion of income in the rest of the world.
However, environmental impacts embedded in EU trade are significant. Using the Eurostat model, the EU’s imports are estimated to have generated more than one tonne of CO2 per capita in 2018 in countries outside the EU. This is around 15 % of the carbon footprint of the EU, which is 6.7 tonnes per capita. According to Eurostat estimates, the net impact (emissions embedded in imports less emissions embedded in exports) is, however, small.
The SDGs call on developed regions such as the EU to reduce the global negative effects of consumption and trade by transferring cleaner and more modern production technologies and by helping to raise global social standards. The European Green Deal outlines the Commission's commitment to the transformation of global value chains, by promoting new environmental and social standards for sustainable growth. Currently there are also discussions in the EU on a mandatory due diligence legislation for multi-national companies.
This article has been a first step in quantifying spillovers. Better and more granular data are needed to track the spillover effects embedded in consumption. Methods that integrate multi-regional assessments and connect material extractions and production technologies with socioeconomic and environmental impacts have the potential to provide meaningful insights, but require data that is currently not yet available. As a result, the indicators so far are less reliable than official statistics. More indicators have to be developed to cover the targets and goals of the SDGs that are related to transboundary effects, such as the spillover effects of tourism, social impacts and further environmental impacts such as water use and land use.
Overview of the experimental spillover indicators
The following two tables provide an overview of the indicators that were developed for this chapter.

Source: Global MRIO Lab, Eurostat (env_ac_io10), (env_ac_rme) and (env_ac_rmefd)

Source: Global MRIO Lab.
Direct access to
More detailed information on EU SDG indicators for monitoring of progress towards the UN Sustainable Development Goals (SDGs), such as indicator relevance, definitions, methodological notes, background and potential linkages, can be found in the introduction of the publication ’Sustainable development in the European Union — Monitoring report on progress towards the SDGS in an EU context — 2021 edition’.
Notes
- ↑ OECD (2019), Measuring distance to the SDG targets: An assessment of where OECD countries stand, OECD Publishing, Paris.
- ↑ Schmidt-Traub, G., Hoff, H. & Bernlöhr, M. (2019), International spillovers and the Sustainable Development Goals (SDGs): SDG Policy Brief.
- ↑ Sala, S. et al. (2019), Consumption and Consumer Footprint: methodology and results.
- ↑ Moreover, the report found that the environmental impacts of the consumption of an average EU citizen are outside the safe operating space for humanity, a concept designed by J. Rockström (Nature, 461).
- ↑ Eurostat (2019), European Union Inter-Country Supply, Use and Input-Output Tables — Full International and Global Accounts for Research in Input-Output Analysis (FIGARO).
- ↑ Source: Eurostat (ext_lt_mainrawm).
- ↑ Eurostat (2021), Greenhouse Gas Emission Statistics — Carbon Footprints.
- ↑ It should be noted that the Eurostat estimates using the domestic technology assumption differ from the MRIO estimates (see Table 1) and in fact invert the net balance. As a result, the EU becomes a net-exporter of air pollution. This shows that results of spillovers estimates need to be interpreted with care.
- ↑ Alsamawi, A., Murray, J. & Lenzen, M. (2014), The Employment Footprints of Nations, Journal of Industrial Ecology 18, 59–70.