Employment statistics within national accounts
Data extracted: 18 April 2024
Planned article update: April 2025
Highlights
Source: Eurostat (nama_10_a10_e)
Employment data in National Accounts covers employees and self-employed persons working in resident production units, i.e. the domestic employment concept. The methodology is consistent with other national accounts variables, but differs from the employment estimates published by the Labour Force Survey (more information here). Employment in persons counts all persons engaged in productive activities. Employment in hours worked refers to all hours actually worked, whether paid or not.
This article presents key messages and data extractions based on Eurostat's annual employment figures. Information on quarterly employment developments can be found in the article on Quarterly national accounts - GDP and employment.
Full article
General overview
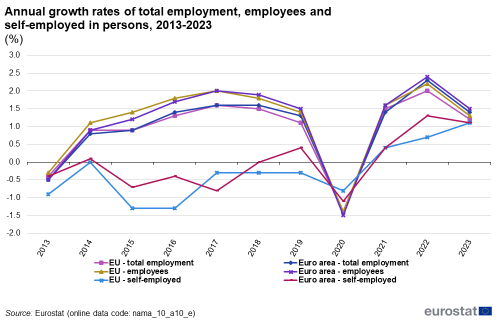
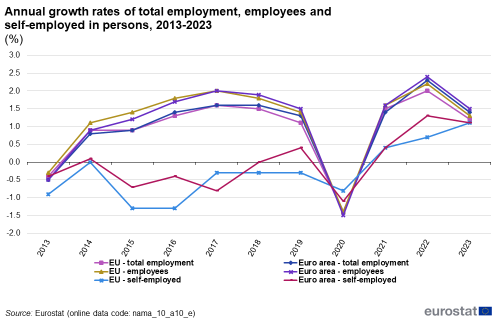
In 2023, total employment in persons increased by 1.4 % in the euro area and by 1.2 % in the EU. In comparison, the annual growth rate for 2022 was 2.3 % in the euro area and 2.0 % in the EU.
Total employment can be split into 'number of employees' and 'number of self-employed'. The number of employees increased by 1.5 % in the euro area and 1.3 % in the EU in 2023 , and the number of self-employed increased by 1.1 % in both the euro area and the EU (see Figure 1).
Source: Eurostat (nama_10_a10_e)
Variations among EU countries
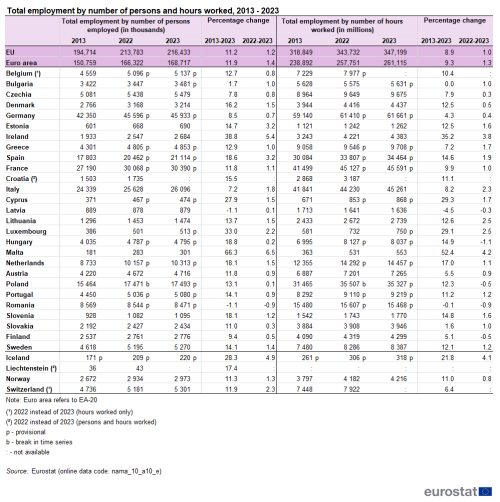
Based on annual data, the level of employment based on persons was below its 2013 level for two EU countries (Latvia, -1.1 % and Romania, -1.1 %). The largest increases were visible in Malta (+66.3 %), Ireland (+38.8 %), and Luxembourg (+33.0 %). Please note these variations can also be related to population changes. Compared to the previous year, all EU countries had higher employment levels in 2023, except for Romania (-0.9 %). The largest increases were recorded in Malta (+6.5 %) and Ireland (+5.4 %).
For employment based on total hours worked, values in 2023 were below its 2013 level for two EU countries. Compared to the previous year, an increase in hours worked could be observed for 20 EU countries, while a decrease could be observed for five countries (see Table 1).
Source: Eurostat (nama_10_a10_e)
Contributions from self-employed
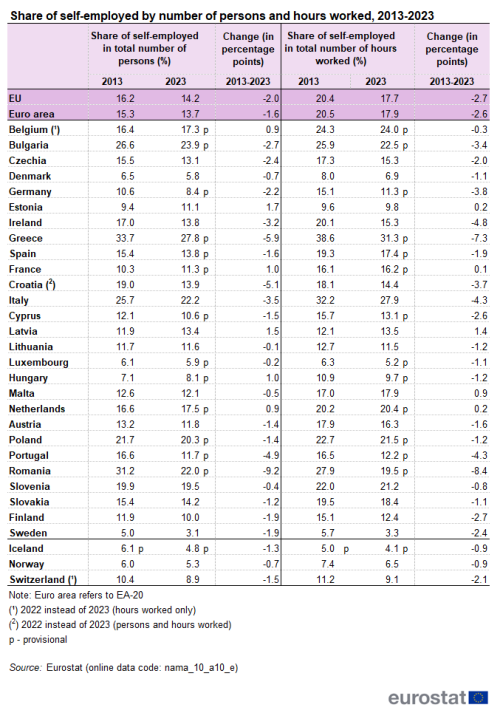
Total employment in the EU can be split into employees and self-employed, which accounted for 85.8 % and 14.2 % respectively of total employment in persons and 82.3 % and 17.7 % respectively of hours worked in the EU in 2023. However, the significance of self-employed persons varies across EU countries (see Table 2). In 2023, in terms of persons, their share was highest in Greece (27.8 %), Bulgaria (23.9 %) and Italy (22.2 %), and lowest in Sweden (3.1 %), Denmark (5.8 %), and Luxembourg (5.9 %).
Changes between 2013 and 2023 vary significantly. The share of self-employed persons decreased in both the EU and the euro area (-2.0 % and -1.6 % respectively), as did their share in total hours worked (-2.7 % and -2.6 % respectively). The largest decreases in the number of self-employed were observed in Romania (-9.2 %) and Greece (-5.9 %) and the highest increase was recorded in Estonia (+1.7 %). For changes in hours worked, the largest decreases were observed in Romania (-8.4 %) and Greece (-7.3 %) and the highest increase was recorded in Latvia (+1.4 %).
Source: Eurostat (nama_10_a10_e)
Evolution by sector
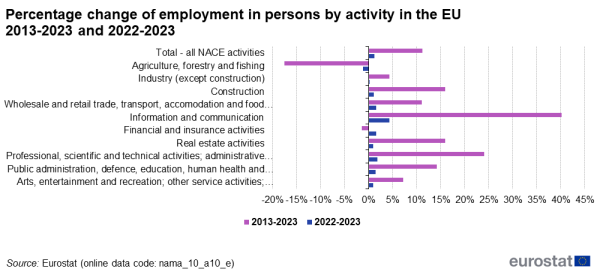
Employment trends can also be decomposed by sector. Figure 2 shows changes in employment in persons by economic activity between 2013-2023, and in 2023. They indicate that there has been a shift in employment across sectors of the economy. Losses of employment over the whole time period 2013-2023 were recorded in agriculture, and financial and insurance activities. In 2023, employment grew in all sectors except for agriculture. The sectors information and communication, and professional, scientific and technical activities exhibited the largest growth in terms of employment over the whole time period.
Source: Eurostat (nama_10_a10_e)
Relation to GDP, productivity and unit labour costs
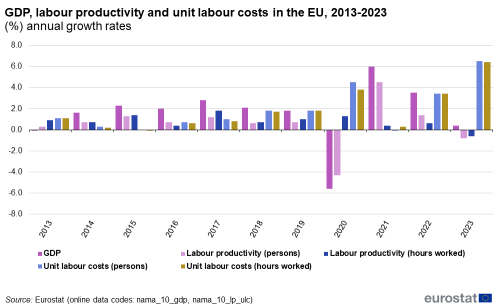
Employment data are also used to compile indicators on productivity[1] and unit labour costs[2], in combination with data on production (GDP) and compensation of employees. Figure 3 shows that labour productivity in persons dropped significantly during 2020 (-4.3 %), since during the COVID pandemic government subsidies maintained number of employees rather stable, while GDP dropped. After a recovery in labour productivity in the years 2021 and 2022, labour productivity decreased by -0.8 % in persons and by -0.6 % in hours in 2023.
Source: Eurostat (nama_10_gdp) and (nama_10_lp_ulc)
Source data for tables and graphs
Data sources
Eurostat collects employment data in the framework of ESA 2010. See here for more details. Additional information on the dissemination of ESA 2010 data is available under publications on the dedicated section on Eurostat's website and in the database section National accounts (ESA 2010) (na10). The ESA 2010 distinguishes between two employment concepts depending on geographical coverage: resident persons in employment (i.e. the national scope of employment) and employment in resident production units irrespective of the place of residence of the employed person (i.e. domestic scope). The ESA 2010 recognises several employment measures: persons, hours worked and jobs. Eurostat publishes mainly employment data measured in persons and in hours worked.
Context
Employment and population have traditionally been considered auxiliary variables in national accounts, aimed to calculate ratios like value added, output, or labour costs per inhabitant or per employed person. Employment, however, has gained importance and nowadays it is an endogenous variable in the national accounts framework. Quarterly employment also stands now as a key short term economic indicator. There are some advantages in estimating employment in the framework of national accounts. First, national accountants integrate information from many sources (labour force surveys, population censuses, employment registers, income tax registers, business production surveys, labour cost surveys, etc). A second level of integration is reached when employment is estimated simultaneously to and consistently with other national accounts variables, like output and compensation of employees i.e. salaries and social contributions. Resulting from it, national accounts employment estimates are best suited to measure the overall level of employment in an economy and its breakdown into main economic categories. National accounts, however, do not provide information on social or gender aspects of employment. The classical and most reliable source for this information is the Labour Force Survey. The differences in methodology between national accounts employment and the Labour Force Survey can be found here.
Direct access to
- Annual national accounts (t_nama10), see:
Annual data: Auxiliary indicators to national accounts /Employment, domestic concept (tec00112)
Quarterly data: Basic breakdowns by GDP aggregates and employment (by industry and assets)/ Employment by NACE Rev.2 (teina310, teina305, tec00108, tec00109)
- Annual national accounts (nama_10), see:
Annual data: Basic breakdowns by GDP aggregates and employment/Employment by A10 industry breakdowns (nama_10_a10_e)
Quarterly data: Basic breakdowns by GDP aggregates and employment (by industry and assets)/Employment by A10 industry breakdowns (namq_10_a10_e)
- Annual national accounts (ESMS metadata file — nama10_esms)
- European system of account — ESA 2010
- European system of accounts — ESA 1995
- NACE Rev.2 publication
- Quarterly national accounts (ESMS metadata file — namq_10_esms)
- NATIONAL ACCOUNTS Legislation
- ESA 2010 Introduction
Notes
- ↑ Labour productivity is defined as the ratio of Gross Domestic Product GDP (in volume) to total employment (according to the domestic concept). Unit labour cost (ULC) measures the average cost of labour per unit of output. It is calculated as the ratio of labour costs to labour productivity. ULC represents a link between productivity and the cost of labour in producing output.
- ↑ See footnote 1