Archive:Employment in detail - quarterly statistics
Data extracted in April 2021
Planned article update: July 2021
Highlights
In most EU Member States, employment was greatly affected by the COVID-19 crisis. Containment measures had a strong impact on economic activity and particularly on some occupations or sectors of activity. Furthermore, self-employment may have been negatively affected as a result of the crisis. The present article complements the article on employment by giving a detailed analysis of the evolution of the employed population by professional status, occupation, sector of economic activity. Both articles use the quarterly results of the European Union Labour Force Survey (LFS) and are part of the publication Labour market in the light of the COVID-19 pandemic.
Note: Given the level of detail, the data used in this article are not seasonally adjusted. For this reason (in order not to be biased by the seasonal effect), data from the last available quarter (fourth quarter 2020) are compared with data from the same quarter of the previous year (fourth quarter 2019). Please take note that figures presented in this article may differ in some cases from the source data, due to continuous revision of the Eurostat database (Employment and unemployment (Labour Force Survey)).
Full article
Volatility in employment according to professional status
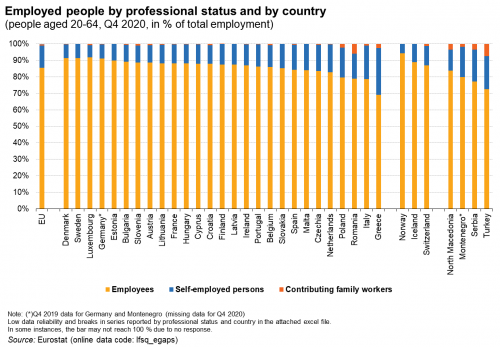
The majority of people in employment in the EU aged 20-64 were employees in the last quarter of 2020, accounting for 85.4 % (see Figure 1). The highest share of employees in the total number of employed people can be found in Denmark with 91.5 %, followed by Sweden (91.4 %) and Luxembourg (91.3 %). In Germany, where Q4 2020 data is not available, employees accounted for 91.1 % of employed people in Q4 2019. The lowest shares of employees in Q4 2020 were reported by Poland (79.6 %), Romania (79.0 %), Italy (78.8 %) and Greece (69.0 %), where less than eight out of ten employed people were employees.
The remaining employed people are mainly self-employed. Poland (18.2 % of self-employed in total employment), Italy (20.2 %) and Greece (28.5 %) recorded the highest share of self-employed persons in Q4 2020. In addition, the lowest share of self-employed were found in Luxembourg (7.3 %), Denmark (8.3 %) and Sweden (8.5 %).
The last category of employed people consists of contributing family workers. This professional status is relatively marginal in the overwhelming majority of EU Member States. However, in some countries, contributing family workers accounted for more than 2 % of total employment in Q4 2020: Romania (5.8 %), Greece (2.5 %) and Poland (2.2 %).

(people aged 20-64, Q4 2020, in % of total employment)
Source: Eurostat (lfsq_egaps)

(people aged 20-64, Q4 2020 compared with Q4 2019, in %)
Source: Eurostat (lfsq_egaps)
Looking at the evolution between the fourth quarter of 2019 and the fourth quarter of 2020, the growth rate of employees fluctuated between a decrease of 4.0 % in Latvia and an increase of 2.6 % in Luxembourg. However, cuts of more than 3 % in the number of employees were also recorded in Bulgaria (-3.2 %), Spain (-3.5 %) and Croatia (-3.8 %), as shown in Figure 2.
Self-employed people, on the other hand, appeared to have relatively high volatility over the same time period. The number of self-employed persons changed by more than 4 % in nine countries. The sharpest decreases in the number of people with this professional status were observed in Estonia (-4.3 %), Sweden (-4.5 %) and Austria (-5.1 %). In contrast, the number of self-employed people was more substantial in Q4 2020 compared with Q4 2019 in Latvia (+13.2 %), Croatia (+11.4 %), Hungary (+9.2 %), Belgium (+6.0 %), Poland (+5.3 %) and Denmark (+4.3 %). It is worth noting that Latvia experienced the greatest decrease in the number of employees while also experiencing the greatest increase in the number of self-employed people. Please note that the high volatility in the number of self-employed can be explained by a low number of people in this category in some countries, particularly in small countries, which might emphasize the changes.
Figure 3 shows that, in the EU in Q4 2020, among the group of employees, men and women were almost equally represented, with a slight over-representation of men (51.8 % men versus 48.2 % women). However, among the group of self-employed people, the over-representation of men is much more pronounced (67.6 % men versus 32.4 % women). The same pattern but to a different extent is observed among all Member States.

(people aged 20-64, Q4 2020, in % of the total)
Source: Eurostat (lfsq_egaps)
Developments by type of occupation
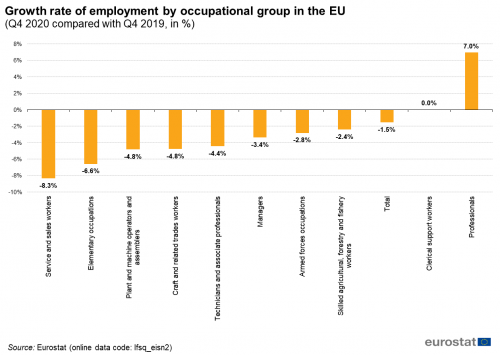
The distribution of employment by occupational group at EU level in Q4 2020 is displayed in Figure 4. It shows that the largest occupational group of employed people consisted of professionals, accounting for 21.2 % of total employment. This category encompasses people working as professionals in various domains: science and engineering, health, teaching, business and administration, information and communications technology and finally, in legal, social and cultural fields, and generally with a high skill level (for further information see the ISCO-08 structure). Moreover, around one in six employed persons reported an occupation as a technician or associate professional (16.2 %). Service and sales workers represented a similar share (15.4 %) of employed people while craft and related trades workers accounted for 11.3 % of total employment.

(Q4 2020, in % of total employment)
Source: Eurostat (lfsq_eisn2)
Most countries with fewer service and sales workers, workers in elementary occupations, craft and related trades workers and plant and machine operators and assemblers in Q4 2020 compared with Q4 2019
Between the fourth quarter of 2019 and the fourth quarter of 2020, at EU level, the number of service and sales workers decreased by 8.3 % (see Figure 5). The second largest drop was recorded for people with elementary occupations (-6.6 %). Elementary occupations involve the performance of simple and routine tasks which may require the use of hand-held tools and considerable physical effort. Workers in elementary occupations include people employed as cleaners and helpers; agricultural, forestry and fishery workers; those employed in mining, construction, manufacturing and transport; food preparation assistants; street and related sales and services workers or refuse workers. Plant and machine operators and assemblers, as well as craft and related workers, have reported the third largest decrease in employment (-4.8 %, both). Nonetheless, the number of employed people increased by 7.0 % for the group of professionals, and it remained stable for the category of clerical support workers, which includes general and keyboard clerks, customer service clerks, numerical and material recording clerks and other clerical support workers.
Moreover, it may be interesting to note that the decrease in the number of sales and service workers was mainly due to the decrease of this occupation in two sectors of activities, i.e. Accommodation and food service activities (I) and Wholesale and retail trade; repair of motor vehicles and motorcycles (G), explaining around two-thirds of the decrease. As regards the decrease in the number of elementary workers, it was caused by the decrease in the following activities: Accommodation and food service activities (I), Manufacturing activities (C), Human health and social work activities (Q) and Activities of households as employers; undifferentiated goods- and services-producing activities of households for own use (T) which explained all together more than half of the decrease. By contrast, the growth in the number of professionals can be explained by the increase of this category in the following sectors of activity (from the larger to the smaller weight in the increase): Education (P) and to a lesser extent: Manufacturing (C), Human health and social work activities (Q) and Information-communication (J).

(Q4 2020 compared with Q4 2019, in %)
Source: Eurostat (lfsq_eisn2)
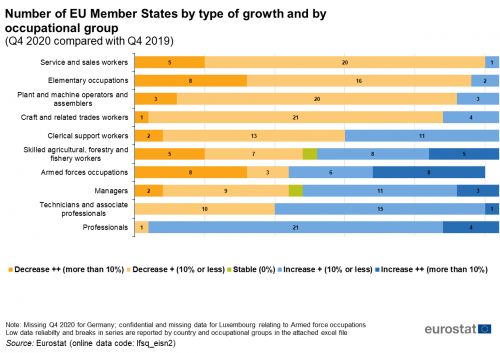
The number of service and sales workers and elementary workers decreased in the vast majority of EU countries where data are available: in 25 out of 26 countries for service and sales workers and in 24 countries for elementary workers (see Figure 6). The decline in the number of employed people exceeded 10 % in five countries for service and sales workers and in eight countries for elementary workers (detailed figures can be found ![]() here).
here).
Other strongly impacted occupational categories include plant and machine operators and assemblers, whose employment decreased in 23 EU Member States, with three reporting a decrease of more than 10 %. Craft and related trades workers were also strongly affected; their numbers fell in 22 countries. The category of craft and related trades workers includes building and related trades workers (excluding electricians); metal, machinery and related trades workers; handicraft and printing workers; electrical and electronic trades workers; food processing, woodworking, garment and other craft and related trades workers. At the other end of the scale, there were more people employed as professionals in the fourth quarter of 2020 than in the fourth quarter of 2019 in 25 out of 26 EU Member States. Finally, the number of technicians and associate professionals also increased in 16 out of 26 EU countries and the number of managers in 14 EU countries.

(Q4 2020 compared with Q4 2019)
Source: Eurostat (lfsq_eisn2)
Developments by type of activity
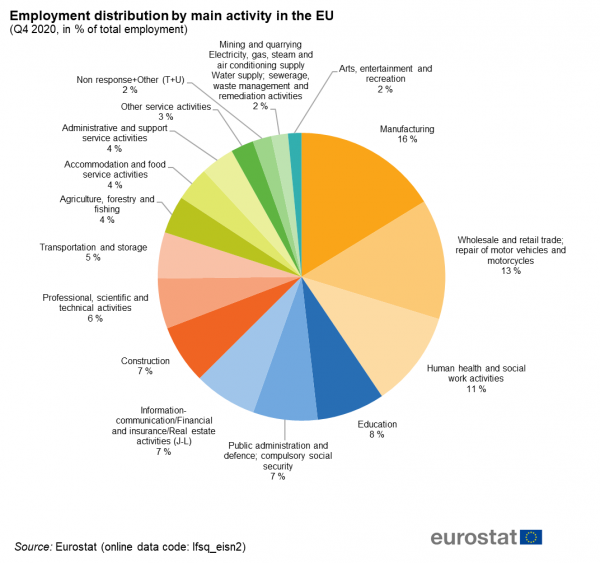
In terms of business lines, an overview of the situation in the fourth quarter of 2020 shows that the five categories listed below accounted for more than half (55.4 %) of the total EU employment: (1) Manufacturing (NACE C) (16.2 % of the total EU employment), (2) Wholesale and retail trade; repair of motor vehicles and motorcycles (13.5 %), (3) Human health and social work activities (10.8 %), (4) Education (7.6 %) and (5) Public administration and defence; compulsory social security (7.3 %) (see Figure 7).

(Q4 2020, in % of total employment)
Source: Eurostat (lfsq_eisn2)
Among all activities, some registered sharp declines in employment between Q4 2019 and Q4 2020 at EU level (see Figure 8). Employment decreased by 5 % or more in the following activities: Accommodation and food service activities (-18.4 %); Arts, entertainment and recreation (-10.2 %); Administrative and support service activities (-10.0 %) and Transportation and storage (-5.0 %). However, growth above 3 % in the number of employed people were registered over this one-year period in Information-communication/Financial and insurance/Real estate activities (J-L) (+7.5 %), in Public administration and defence; compulsory social security (+5.3 %), Education (+3.3%) and "Other service activities" (+3.1 %), which encompasses activities of membership organisations, repair of computers and personal and household goods and other personal service activities, such as washing and (dry-)cleaning of textile and fur products, hairdressing and other beauty treatment, funeral and related activities and physical well-being activities and other personal service activities.

(Q4 2020 compared with Q4 2019, in %)
Source: Eurostat (lfsq_eisn2)
When comparing Q4 2020 to Q4 2019, still based on 26 EU Member States for which data are available, almost all countries, i.e. 25, registered a decrease in accommodation and food service activities (see Figure 9). The fall in employment corresponded to a decrease of more than 10 % in 22 EU countries. Arts, entertainment and recreation, as well as Administrative and support service activities, were the second and third most heavily impacted categories among the EU Member States. Arts, entertainment and recreation declined in 22 out of 26 EU Member States (with ten reporting decreases of more than 10 %), while Administrative and support service activities declined in 21 countries, with seven reporting decreases of more than 10 %. The number of employed people was also lower in Q4 2020 compared to Q4 2019 in 19 countries in terms of Transportation and storage activities and in 18 countries in terms of Manufacturing activities.
In contrast, the number of workers in Information-communication/Financial and insurance/Real estate activities (J-L) increased in the majority of EU countries, with 23 countries reporting growth (from which seven reported increases higher than 10 %). In addition, employment in activities related to Public administration and defence; compulsory social security increased in 20 EU Member States, as did employment in Education (19 countries) and Professional, scientific and technical activities, which increased in 16 countries.
All detailed figures are available ![]() here
here

(Q4 2020 compared with Q4 2019)
Source: Eurostat (lfsq_eisn2)
Source data for tables and graphs
Data sources
All figures in this article are based on detailed quarterly survey results from the European Union Labour Force Survey (EU-LFS).
Source: The European Union Labour Force Survey (EU-LFS) is the largest European household sample survey providing quarterly and annual results on labour participation of people aged 15 and over as well as on persons outside the labour force. It covers residents in private households. Conscripts in military or community service are not included in the results. The EU-LFS is based on the same target populations and uses the same definitions in all countries, which means that the results are comparable between countries.
European aggregates: EU refers to the sum of the 27 EU Member States.
Country note: In Germany, from the first quarter of 2020 onwards, the Labour Force Survey (LFS) has been integrated into the newly designed German microcensus as a subsample. Unfortunately, for the LFS, technical issues and the COVID-19 crisis have had a large impact on the data collection processes, resulting in low response rates and a biased sample. For this reason, the full sample of the whole microcensus has been used to estimate a restricted set of indicators for the four quarters of 2020 for the production of LFS Main Indicators. These estimates have been used for the publication of German results, but also for the calculation of EU and EA aggregates. By contrast, EU and EA aggregates published in the Detailed quarterly results (showing more and different breakdowns than the LFS Main Indicators) have been computed using only available data from the LFS subsample. As a consequence, small differences in the EU and EA aggregates in tables from both collections may be observed. For more information, see here.
Definitions: The concepts and definitions used in the Labour Force Survey follow the guidelines of the International Labour Organisation.
Different articles on detailed technical and methodological information are linked from the overview page of the online publication EU Labour Force Survey.
Context
The COVID-19 pandemic hit Europe in January and February 2020, with the first cases confirmed in Spain, France and Italy. COVID-19 infections have since been diagnosed in all European Union (EU) Member States. To fight the pandemic, EU Member States have taken a wide variety of measures. From the second week of March, most countries closed retail shops, with the exception of supermarkets, pharmacies and banks. Bars, restaurants and hotels were also closed. In Italy and Spain, non-essential production was stopped and several countries imposed regional or even national lock-down measures which further stifled economic activities in many areas. In addition, schools were closed, public events were cancelled and private gatherings (with numbers of persons varying from 2 to over 50) banned in most EU Member States.
The majority of the preventative measures were taken during mid-March 2020, and most of the measures and restrictions were in place for the whole of April and May 2020. The first quarter of 2020 was consequently the first quarter in which the labour market across the EU was affected by COVID-19 measures taken by Member States.
Employment and unemployment as defined by the ILO concept are, in this particular situation, not sufficient to describe the developments taking place in the labour market. In the first phase of the crisis, active measures to contain employment losses led to absences from work rather than dismissals, and individuals could not look for work or were not available due to the containment measures, thus not counting as unemployed.
The quarterly data on employment will allow along the quarters to report on the impact of the economic crisis due to the COVID-19 pandemic on employment. This specific article details the evolution of the employed population by occupation, sector of economic activity, and professional status. It complements another article focusing on the age and the level of educational attainment of employed people, as well as on the evolution of part-time employment and temporary contracts, in order to determine potential categories more or less affected by the economic downturn. Both articles are part of the publication Labour market in the light of the COVID-19 pandemic.
Direct access to
- All articles on employment
- Labour market in the light of the COVID 19 pandemic - quarterly statistics
- Employment rates – annual statistics
- Job vacancy statistics
- Labour market statistics at regional level
- People outside the labour force
- The EU in the world - labour market
- Labour market slack – annual statistics on unmet needs for employment
- LFS main indicators (t_lfsi)
- Population, activity and inactivity - LFS adjusted series (t_lfsi_act)
- Employment - LFS adjusted series (t_lfsi_emp)
- Unemployment - LFS adjusted series (t_une)
- LFS series - Detailed annual survey results (t_lfsa)
- LFS series - Specific topics (t_lfst)
- LFS main indicators (lfsi)
- Employment and activity - LFS adjusted series (lfsi_emp)
- Unemployment - LFS adjusted series (une)
- Labour market transitions - LFS longitudinal data (lfsi_long)
- LFS series - Detailed quarterly survey results (from 1998 onwards) (lfsq)
- LFS series - Detailed annual survey results (lfsa)
- LFS series - Specific topics (lfst)
- LFS ad-hoc modules (lfso)
Publications
- EU labour force survey — online publication
- Labour Force Survey in the EU, candidate and EFTA countries — Main characteristics of national surveys, 2017, 2018 edition
- Quality Report of the European Union Labour Force Survey 2017, 2019 edition
ESMS metadata files and EU-LFS methodology
- Employment and unemployment (Labour Force Survey) (ESMS metadata file — employ_esms)
- Employment growth and activity branches - annual averages (ESMS metadata file — lfsi_grt_a_esms)
- LFS ad-hoc modules (ESMS metadata file — lfso_esms)
- LFS main indicators (ESMS metadata file — lfsi_esms)
- LFS series - Detailed annual survey results (ESMS metadata file — lfsa_esms)
- LFS series - detailed quarterly survey results (from 1998 onwards) (ESMS metadata file — lfsq_esms)
