_AE2020.png)
 AE2020.png&body=Statistics Explained - Range of NUTS level 3 regions with the highest and lowest shares of people aged ≥65 years, 2019 (% share of total population) AE2020.png %0A https%3A%2F%2Fec.europa.eu%2Feurostat%2Fstatistics-explained%2Findex.php%3Ftitle%3DFile%3ARange_of_NUTS_level_3_regions_with_the_highest_and_lowest_shares_of_people_aged_%25E2%2589%25A565_years%2C_2019_%28%2525_share_of_total_population%29_AE2020.png)
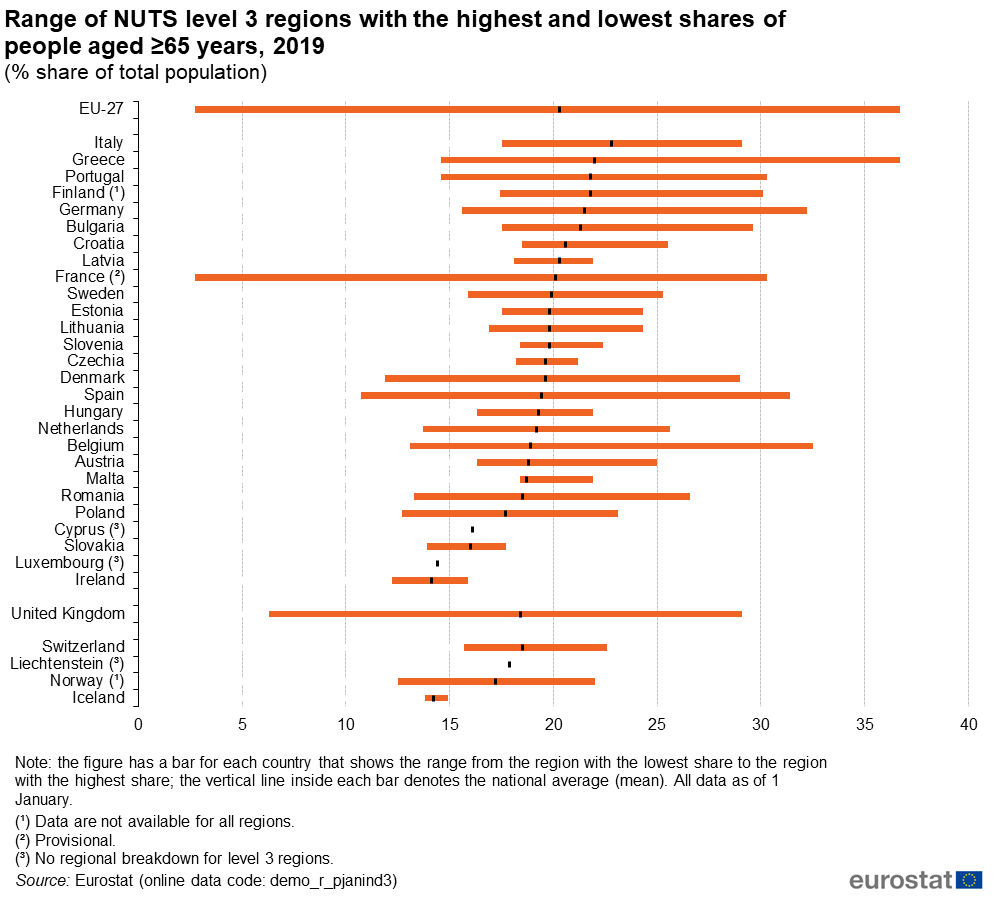
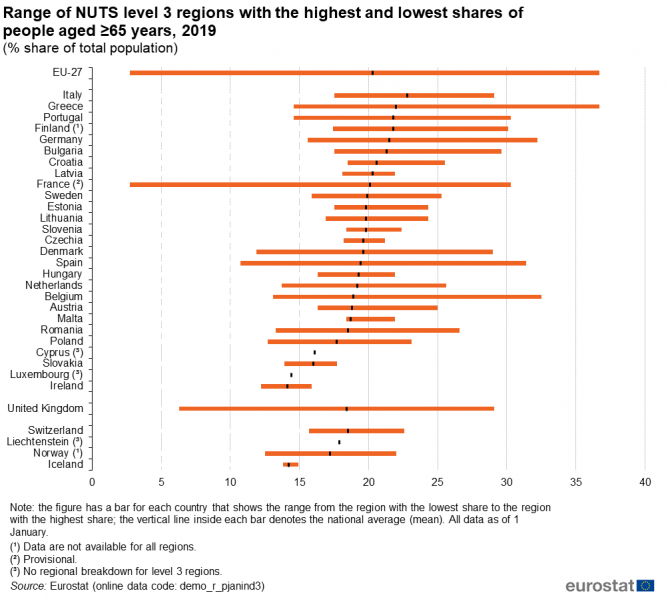
File:Range of NUTS level 3 regions with the highest and lowest shares of people aged ≥65 years, 2019 (% share of total population) AE2020.png
Revision as of 18:18, 24 September 2020 by EXT-S-Allen (talk | contribs)
Size of this preview: 666 × 599 pixels. Other resolutions: 267 × 240 pixels | 1,000 × 900 pixels.
Original file (1,000 × 900 pixels, file size: 56 KB, MIME type: image/png)
File usage
The following page uses this file:
_AE2020.png&oldid=499971)
_AE2020.png)
_AE2020.png&action=edit&redlink=1)
_AE2020.png&action=history)