Archive:Business economy - structural profile
- Data from January 2009, most recent data: Further Eurostat information, Main tables and Database
This article belongs to a set of statistical articles which analyse the structure, development and characteristics of the various economic activities in the European Union (EU). The present article is part of the business economy overview, and covers the structural profile of the business economy.
Main statistical findings
Structural profile of the EU-27's non-financial business economy
There were just over 20 million active enterprises within the EU-27's non-financial business economy in 2006 (see Table 2). The vast majority of these (73.9 %) were operating within non-financial services, while a higher proportion of enterprises were active in the construction sector (14.4 % of the total) than within industry (11.7 %).
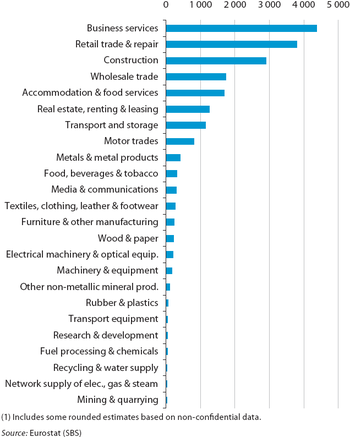
On the basis of the activity aggregates used for the structural business statistics sectoral articles, the highest number of enterprises were often found in activities that are, to some degree, characterised as having relatively low barriers to entry, and large, proximity markets. Business services, retail trade and repair, and the construction sector together accounted for almost 55 % of all enterprises active within the EU-27's non-financial business economy in 2006; almost 4.4 million enterprises were active within business services, and nearly 3.8 million within the retail trade and repair sector.
At the other end of the scale, there were often relatively few enterprises operating within activities characterised by high barriers to entry (such as, those with considerable start-up costs to reach a minimum efficient scale of production). These included capital-intensive activities such as mining and quarrying, transport equipment manufacturing, the network supply of electricity, gas and steam or recycling and water supply; none of these sectors accounted for more than 0.2 % of the total number of enterprises active in the EU-27's non-financial business economy, with fewer than 25 thousand enterprises operating in mining and quarrying activities, the network supply of electricity, gas and steam or the recycling and water supply sector.
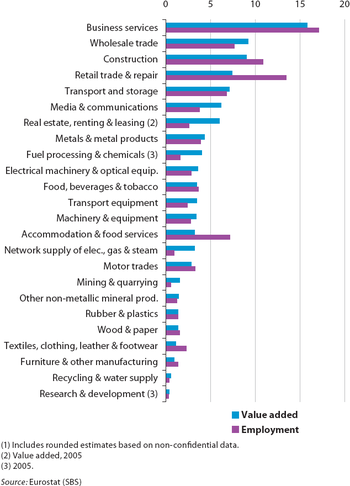
The distribution of enterprises across the EU-27 economy provides little information when analysing the relative economic importance of the different sectors. Economic weight is more generally measured in terms of value added. Non-financial services contributed a 55.5 % share of the total added value in the EU-27's non-financial business economy in 2006. The proportion accounted for by industrial activities (35.5 %) was 23.8 percentage points higher than the corresponding share of industry in the total number of enterprises. The construction sector accounted for the remaining 9.0 % of added value in the EU-27’s non-financial business economy in 2006. Looking in more detail (using the aggregates defining each of the structural business statistics sectoral articles), the three largest sectors together contributed 34.0 % of the value added generated in the EU-27's non-financial business economy; they were business services, wholesale trade and construction.
Comparing two output measures, namely value added and turnover, the most noticeable difference concerned distributive trade activities (especially wholesale trade), where these activities reported a far higher share of sales. The relatively high proportion of turnover occurring within these activities is a direct consequence of the nature of these activities, whereby large volumes of products are purchased and resold, normally with a relatively small margin. For example, wholesale trade activities accounted for 20.6 % of EU-27 sales in the non-financial business economy in 2006, compared with a 9.2 % share of value added. In contrast, the added value of business services (15.8 % of the non-financial business economy total) was considerable higher than its share of turnover (7.9 %).
In employment terms, the importance of the relatively labour-intensive construction and non-financial services sectors was relatively high (when compared with value added). Non-financial services accounted for 60.8 % of the EU-27's non-financial business economy workforce, 28.3 % were employed in industrial activities and the remaining 10.9 % in the construction sector. At a sectoral level, none of the industrial activities represented more than 4 % of the employment total; the highest share being recorded for metals and metal products. Among the services, the largest workforces were found within the activities of business services (17.1 %) and retail trade and repair (13.5 %).
Differences between the relative shares of total value added and employment throw some light on productivity differentials between activities (see Figure 2). Apparent labour productivity (defined as value added divided by the number of persons employed) tended to be highest among those sectors characterised as being capital-intensive or high-tech. The most productive activities in the EU-27 (at the sectoral level used for structural business statistics articles) included real estate, renting and leasing (2005), media and communications, fuel processing and chemicals manufacturing (2005) and the network supply of electricity, gas and steam. In contrast, the least productive areas of the EU-27’s non-financial business economy in 2006 included labour-intensive activities, such as the manufacture of textiles, clothing, leather and footwear, the construction sector, accommodation and food services, or retail trade and repair.
Specialisation and concentration within the Member States
Table 2 shows that the economies of Germany, the United Kingdom, France, Italy and Spain together generated about three quarters (74.1 %) of the added value within the EU-27's non-financial business economy in 2006. They made 71.2 % of all sales and employed nearly two thirds (63.9 %) of the EU-27’s workforce within 60.6 % of all enterprises. These aggregated figures hide considerable differences between Member States, as Italy and Spain had relatively large numbers of enterprises, while Germany, France and the United Kingdom tended to account for relatively high shares of value added and turnover.
Poland was the next largest economy, accounting for more than 7 % of the enterprises in the EU-27’s non-financial business economy, and 6 % of value added or employment. At the other end of the range, the smallest economies included Estonia, Cyprus, Latvia, Lithuania, Luxembourg, Malta (for which there is usually no recent information available), Slovenia and Slovakia. Each of these countries accounted for less than 1 % of the total number of enterprises, turnover, value added or employment in the EU-27.
Table 3 presents (for the activity aggregates used in the structural business statistics sectoral articles) information on the two countries with the highest levels of value added. It shows that Germany was ranked either first or second for the vast majority of activities, with the only exceptions being mining and quarrying, construction, and accommodation and food services. With the exception of textiles, clothing, leather and footwear, where Italy was the largest producer within the EU-27 (on the basis of a breakdown of EU-27 value added), Germany was the biggest, single producer within each of the remaining manufacturing sectors. Italy was the second largest producer across five of the industrial headings used for the articles, while France was the second largest producer for four industrial headings.
The relative importance of manufacturing activities in the German economy was mirrored with respect to other areas of the economy by the United Kingdom, which recorded the highest level of value added among the Member States for mining and quarrying, recycling and water supply, construction and each of the sectoral article headings used for non-financial services – except for motor trades and real estate, renting and leasing, where Germany had a higher level of added value. Germany was generally the second largest contributor to EU-27 value added for these non-manufacturing activities, other than for mining and quarrying (Denmark), construction (Spain) or accommodation and food services (France).
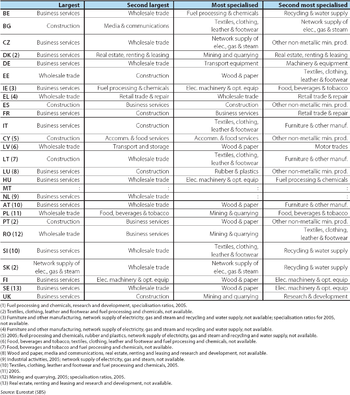
Relative value added specialisation ratios are calculated for each Member State as the share of a particular activity in the non-financial business economy; this share is divided by the same ratio for the EU-27 to create an indicator that is expressed as a ratio in percentage terms (values above 100 % indicating a relative specialisation in relation to the EU-27). Table 3 also shows the two most specialised Member States for each activity. Germany was the most specialised Member State for the manufacture of machinery and equipment or transport equipment, Spain for construction, and the United Kingdom for research and development and business services. Nevertheless, particularly in industrial activities, several of the Member States that joined the EU in 2004 or 2007 were among the most specialised countries, with Bulgaria, the Czech Republic, Estonia, Poland, Romania and Slovakia each appearing at least twice among the most or second most specialised countries. Across the construction and non-financial services sectors, Cyprus and Latvia tended to display high relative specialisation ratios.
The two largest activities (in terms of value added) in each Member State are shown in Table 4. In more than half (15 of the 26 Member States for which data are available, no data available for Malta), business services was the largest activity in 2006. Where this was not the case, construction or wholesale trade generally occupied the position of being the largest activity, except in Slovakia, where the network supply of electricity, gas and steam generated the highest level of added value. As such, this was the only case of an industrial activity being the largest contributor to total value added. Industrial activities were also rare when expanding the criteria to include the second largest activity, although this position was occupied by fuel processing and chemicals manufacturing in Ireland, the manufacture of food, beverages and tobacco in Poland, or the manufacture of electrical machinery and optical equipment in Finland; media and communications was the second largest activity in Bulgaria which is a mixture of industrial and service activities.
Table 4 also presents information on those activities with the highest specialisation ratios. Several Baltic, Nordic and alpine Member States were relatively specialised in the manufacture of wood and paper products, while mining and quarrying was relatively important in countries with North Sea oil/gas or in central and eastern Europe, where coal mining still takes place. Indeed, trends in specialisation are often related to endowments of natural resources, although there are other factors that can play a role, such as the availability of skills and know-how, a breakdown of costs, or access to infrastructure. These may explain, for example, why the manufacture of transport equipment (in particular, motor vehicles) and machinery and equipment is particularly concentrated in Germany, and electrical machinery and optical equipment in Finland and Sweden (mobile telephony). Furthermore, some of these factors (such as lower labour costs) may also explain why there has been a trend in recent years for the textiles, clothing, leather and footwear manufacturing sector to move away from the southern Member States of Italy, Portugal and Spain towards eastern Europe (and beyond).
Specialisation at a regional level
Regional structural business statistics allow this analysis to be taken a stage further and provide data which can be used to study the nature, characteristics and evolution of regional business economies.
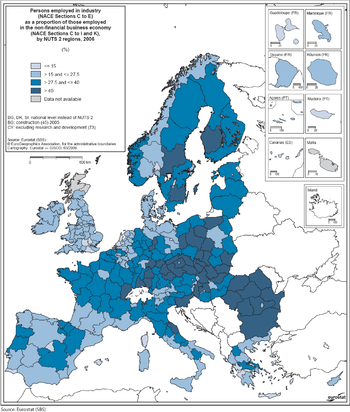
Maps 1 and 2 show the proportion of the non-financial business economy workforce occupied within the industrial and non-financial services sectors in 2006 (note that a similar map for the construction sector is presented within Construction statistics). There is a clear pattern of industrial employment being concentrated within parts of Germany, as well as central and eastern Europe. There were a few regions where industrial employment accounted for around 50 % of the workforce in 2006: these were located in the Czech Republic, Romania and Slovakia (where all regions were highly industrialised, other than Bratislavský kraj, in which the capital city is found).
In contrast, employment within the non-financial services sector (see Map 2) was often concentrated around or in capital cities, for example, almost 90 % of those employed in Inner London in 2006, while upwards of 80 % of the workforce were employed in non-financial services in a number of other regions including Outer London, Berkshire, Buckinghamshire and Oxfordshire, and Surrey, East and West Sussex (all in the United Kingdom), Berlin, Hamburg and Köln (all in Germany), and the Région de Bruxelles-Capitale/Brussels Hoofdstedelijk Gewest (in Belgium).
A relatively high proportion of the workforce was often engaged in construction activities in rural areas and regions associated with being popular tourism destinations. The Province of Luxembourg (Belgium), every region in Spain (except Madrid), some mountainous, southern or island regions of France, Italy and Portugal, as well as Cyprus and Luxembourg, were the only areas where the construction sector accounted for upwards of 15 % of the regional workforce in 2006.
Table 5 shows, for each of the activity aggregates used for the structural business statistics sectoral articles, the three most specialised NUTS 2 level regions – on the basis of employment specialisation. As mentioned above, geographical and geological factors may help explain why some regions are particularly specialised in mining and quarrying or forest-based activities. For example, Śląskie (Poland) and Sud-Vest Oltenia (Romania) are centres for mining and quarrying activities, while the latter is also relatively specialised in the downstream activity of the network supply of electricity, gas and steam.
Other factors that can play a key role in driving regional specialisation include weather, landscape and location. It is perhaps not surprising that Bretagne (France), Podlaskie and Lubelskie (both Poland) are among the most specialised regions for food and beverage manufacturing, as they are largely rural, flat areas with ample precipitation and relatively low levels of population density. Equally, the concentration of textile, clothing, leather and footwear manufacturers in Norte (Portugal) would not be possible without a plentiful supply of water from local rivers, while in Norra Mellansverige (Sweden) the local economy is dominated by activities related to the exploitation of natural resources, such as mining, metal and metal products manufacturing, or paper and pulp industries. Within the field of services, natural landscapes and weather can also play an important role, for example, the most specialised regions for accommodation and food services include the Greek islands, Spanish islands, the Algarve (Portugal) and the Provincia Autonoma Bolzano/Bozen (northern Italy), all of which are popular destinations for tourists.
A critical mass of clients (from other enterprises or from households/consumers) within close proximity, or a supply of highly-skilled or low-cost labour can also drive specialisation trends. For example, research parks or computer services enterprises often develop near to universities, while media and communications, real estate, and other business services are often concentrated around capital cities or other densely populated regions – for example, business services around Inner London (the United Kingdom) and media and communications around Köln (Germany).
The concentration of enterprises within a particular region can also result from strategic clusters that provide upstream/downstream products and services to another activity – for example, suppliers of metals, electronics, rubber and plastics around motor vehicle manufacturers in regions like Stuttgart and Niederbayern (Germany) or Střední Čechy (the Czech Republic).
Most produced products
PRODCOM is a system for the collection and dissemination of statistics on the production of goods in the EU-27. Information provided in PRODCOM includes data for the value and volume of production, as sold by producers in a particular reference year. Commodities are specified in the PRODCOM list, which includes around 4.5 thousand products, and is updated on an annual basis. The products are listed according to an eight-digit code, of which the first six are directly aligned with the statistical classification of products by activity in the European Community (the CPA).
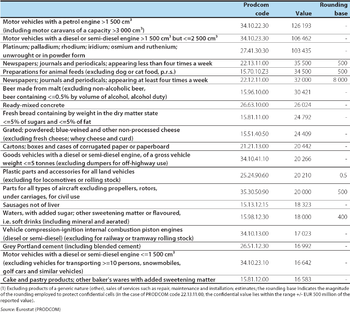
Table 6 shows a selection of the 20 products with the highest values of production sold in the EU-27 in 2007, excluding a few products of a generic nature, or sales of services (such as repair, maintenance and installation). Note that some of the values are presented with a rounding base. When reading the tables, the confidential values are disguised: in order to interpret the table correctly it is necessary to consider that the actual value lies somewhere in the range of the published value +/- the rounding base.
As can be seen, motor vehicles dominated the top of the ranking – as the value of production of motor vehicles with petrol and motor vehicles with diesel engines in excess of 1 500 cc exceeded EUR 100 billion. There was only one other product that reported production sold above this threshold – unwrought or powder forms of platinum; palladium; rhodium; iridium; osmium and ruthenium – while the next highest level for newspapers; journals and periodicals; appearing less than four times a week was approximately one third of this.
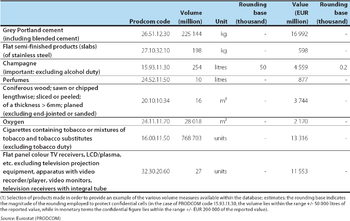
Table 7 provides an example of the type of information available within PRODCOM in volume terms. Note that the units used for these quantity measures can vary depending on the nature of the product (for example, data in quantity terms may be provided in kilograms, litres, square or cubic metres, or simply as a count of the number of units sold). The table is presented merely as an illustration of the detailed product statistics available from this source (and is not based on any particular ranking of products) – for example, there were just over 225 billion kilograms of grey Portland cement sold in the EU-27 in 2007, 10 million litres of perfumes or 27 million flat panel colour television receivers (plasmas or LCDs).
Data sources and availability
The main part of the analysis in this article is derived from structural business statistics (SBS), including core, business statistics which are disseminated regularly, as well as information compiled on a multi-yearly basis, and the latest results from development projects.
Other data sources include the PRODCOM statistics on the production of manufactured goods.
Context
Regulation ((EC) No 58/1997) established a common framework for the collection, compilation, transmission and evaluation of Community statistics on the structure, activity, competitiveness and performance of businesses in the Community. These structural business statistics (SBS) constitute the principal source of information used in the structural business statistics articles. The main SBS aggregates, often referred to in these articles, include:
- the non-financial business economy (NACE Rev. 1.1 Sections C to I and K);
- industry (NACE Rev. 1.1 Sections C to E);
- construction (NACE Rev. 1.1 Section F);
- non-financial services (NACE Rev. 1.1 Sections G to I and K).
Note that financial services (NACE Rev. 1.1 Section J) are kept separate (see Financial and insurance sector statistics) because of their specific nature and the limited availability of most standard business statistics in this area.
The legislation in respect to structural business statistics was modified in 2002 by a Decision (No 2367/2002/EC) of the European Parliament and the Council in order to ensure that the collection of statistics was guided by the principal Community policy priorities of economic and monetary union, enlargement and competitiveness, regional policy, sustainable development and the social agenda.
A recast structural business statistics Regulation ((EC) No 295/2008) came into force in February 2008 and provides ten modules for the production of business statistics. The regulation foresees that the first reference year for which statistics will generally be compiled is calendar year 2008; in addition the statistics should be collected according to the revised classification of economic activities (NACE Rev. 2). This recast Regulation should provide for the continuation of existing statistical support in current policy areas and satisfy additional requirements arising from new Community policy initiatives, as well as reviews of statistical priorities. The Member States will generally have 18 months to deliver these statistics to Eurostat and hence the data for 2008 is expected to be available by the summer of 2010. As such, the structural business statistics articles continue to present data using the NACE Rev. 1.1 classification of economic activities.
Further Eurostat information
Publications
Main tables
Database
Dedicated section
Other Information
- Regulation ((EC) No 58/1997) of 20 December 1996 concerning structural business statistics
- Decision (No 2367/2002/EC) of 16 December 2002 on the Community statistical programme 2003 to 2007
- Regulation ((EC) No 295/2008) of 11 March 2008 concerning structural business statistics
See also
- Business economy - employment characteristics
- Business economy - enterprise demography and size class analysis
- Business economy - evolution of production, employment and turnover
- Business economy - expenditure, productivity and profitability
- Business economy - external trade
- Business economy - macroeconomic outlook

