Labour input indices overview
Data extracted in April 2024.
Planned article update: April 2025.
Highlights
Source: Eurostat (sts_inlb_q), (sts_colb_q), (sts_trlb_q) and (sts_selb_q)
This article presents the labour input indicators, which are business cycle indicators measuring for each quarter how the labour input used by industry, construction, trade and services changes, and provides important information for the analysis and forecast of economic developments in the European Union (EU).
Full article
General overview
Short-term business statistics (STS) provide three different indicators for the input of labour used by European businesses:
- the number of persons employed (sometimes simply referred to as "employment"),
- hours worked ("volume of work done"),
- gross wages and salaries.
As of 2010, these three indicators are generally available for all economic areas covered by European short-term statistics, i.e. for industry, for construction, trade (wholesale and retail trade) and for services (encompassing market business services excluding finance, i.e. basically NACE Rev. 2, H-N) .
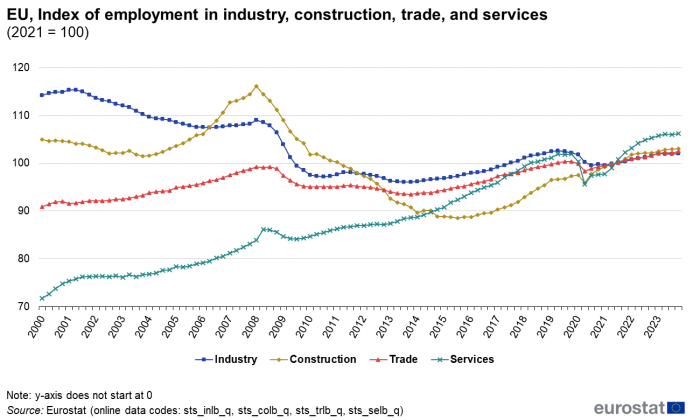
During the last two decades the number of employed persons has developed quite differently in the main economic sectors – industry, construction, trade and services (Figure 1). In industry, the number of persons employed had already begun to decline before the financial crisis and then dropped significantly between 2008 and 2010. Between 2010 and 2016, the level of employment in industry has remained nearly constant. Afterwards a moderate increase could be observed. In the second quarter of 2020, the employment level in industry dropped by several points as a result of the Covid-19 crisis. This fall in employment was, however, less pronounced than in the economic and financial crisis. At the end of 2023, employment in industry has almost regained the level that it had before the pandemic.

Source: Eurostat (sts_inlb_q), (sts_colb_q), (sts_trlb_q) and (sts_selb_q)
After several years of stagnation between 2000 and 2004, employment in construction rose rapidly between 2005 and the first quarter of 2008. Afterwards an equally rapid decline set in which lasted until the end of 2014. In 2015, a relatively dynamic increase set in which lasted until the first quarter of 2020, then, as a result of the Covid-19 crisis, the employment level in construction dropped again, although not as strongly as in other sectors. In the quarters that followed, employment in construction bounced back and is now significantly higher than before the pandemic.
For a long time the development in trade and in services was relatively stable. Employment in trade (wholesale trade, retail trade and trade and repair of motor vehicles) displayed a slow but steady increase until early 2008 and then decreased for two years to stabilise again at the level which it had had around 2005. Just as in industry and construction, the employment level in trade dropped in the second quarter of 2020 but afterwards recovered again and has now somewhat surpassed the pre-crisis level.
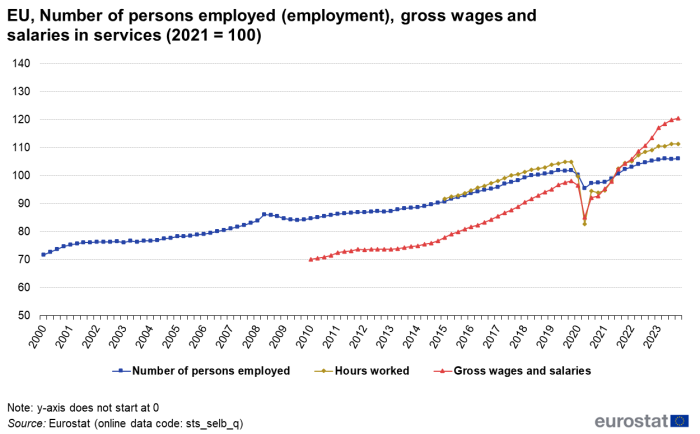
In services, the financial economic crisis became visible in the employment data towards the end of 2008 but the decline lasted only about one year and a month, and afterwards a still continuing steady increase set in which lasted until the first quarter of 2020. In the second quarter of 2020, the employment level in services dropped by more than 6 points and thus to a larger degree than during the whole financial crisis in 2008 and 2009. Since then, however, employment levels have increased quite dynamically and are now clearly above the level before the pandemic.
Industry and construction
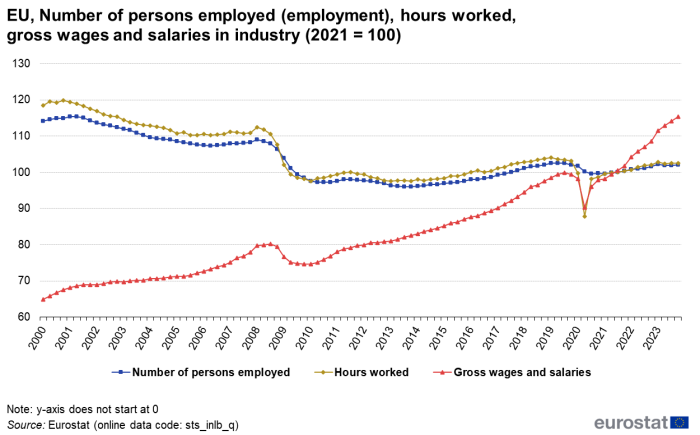
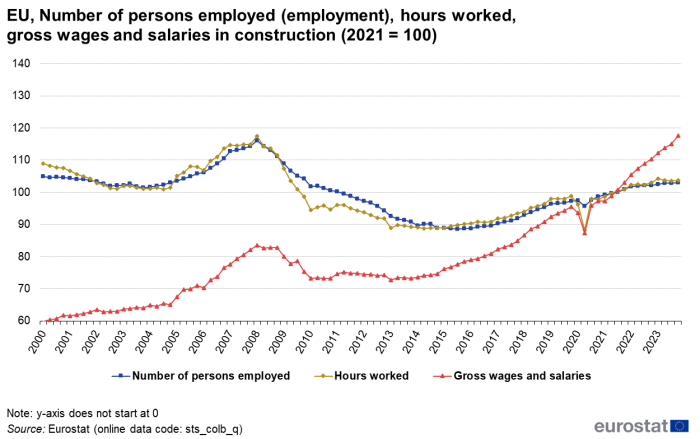
Figure 2 presents the development of the three labour input indicators for industry, Figure 3 for construction activities. In both cases the indicators for employment and for hours worked develop in a largely similar fashion. In both sectors, the indicator for hours worked dropped a little bit faster than the indicators for the number of persons employed, suggesting that measures like the reduction of overtime were taken before dismissals or postponed recruitment. There is, however, a marked difference between these two quantity indicators and the development of the total gross wages and salaries (note that all labour input indicators are based on total numbers and not on average earnings or average working times).
Source: Eurostat (sts_inlb_q)
Source: Eurostat (sts_colb_q)
In industry, before the financial crisis there was a relatively steady increase in total gross wages and salaries despite an ongoing reduction of employment and hours worked. Following the crisis, the remuneration indicator recovered relatively quickly and increased again despite a constant use of total labour input. During the Covid-19 crisis, employment figures dropped, however the declines were moderate in comparison with the declines in the hours worked and the gross wages and salaries. The recovery has so far been different for employment, hours worked and gross wages and salaries. The amount of hours worked is now at a level that had already been reached ten years ago and is not yet back at the level before the pandemic. The level of gross wages and salaries, however, has recovered rather quickly and displayed a dynamic increase during the recent quarters.
In construction, the indicators for gross wages and salaries steadily increased between 2000 and 2008. With the onset of the economic crisis, wages and salaries declined rapidly, as did hours worked and employment. Between 2010 and 2014, the indicator stagnated but has since again displayed a continuous increase which is, however, not as strong as during the pre-crisis years. As in industry, during the Covid-19 crisis employment figures dropped, however the declines were moderate in comparison with the declines in the hours worked and wages and salaries. Employment quickly recovered in the third quarter of 2020 and is now well above the pre-crisis level as is the index of the amount of work done. As in other economic sectors, gross wages and salaries increased very dynamically since the pandemic.
Trade and services
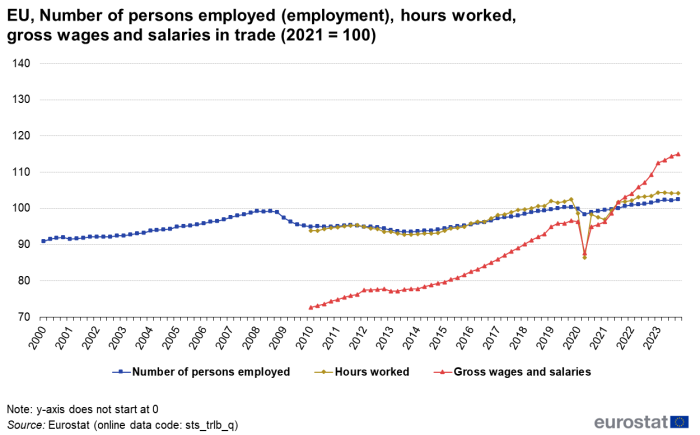
Figure 4 presents the development of employment, hours worked and gross wages and salaries for trade, while Figure 5 presents data for services. The obligation to provide data on hours worked and gross wages and salaries for these two areas entered into force only in 2013. Backdata for these indicators only reach back for a few years. As for industry and construction, the employment levels and the levels for hours worked are rather similar in trade and service production. In both sectors there is also a strong increase in nominal wages and salaries during the recent periods.
Source: Eurostat (sts_trlb_q)
Source: Eurostat (sts_selb_q)
It is worth noting that the declines in the labour indicators were not as marked in trade and services during the financial crisis 2008/2009 as for industry and construction. This was different, however, during the first half of 2020. The reduction in employment levels in trade and services was quite pronounced as large parts of these industries (e.g. hotels, restaurants, air traffic) were completely, or almost completely, shut down for a considerable amount of time. Employment plummeted by 5 index points in the first three quarters of 2020. The falls in gross wages and salaries and in hours worked were even bigger. Most regained their pre-crisis levels around the end of 2021. The index for hours worked in trade shows a dramatic decline of 18 points during the first two quarters of 2020 since during the lockdown in many countries only essential stores (supermarkets, pharmacies, banks) remained open. With the roll-back of the Covid-19 measures in the summer of 2020, work levels recovered in the third quarter of 2020, however without reaching the level before the peak of the crisis. During recent quarters, the level of hours worked declined again. Gross wages and salaries also declined strongly during the pandemic but increased quite dynamically afterwards.
Annual development by country, 2020 - 2023
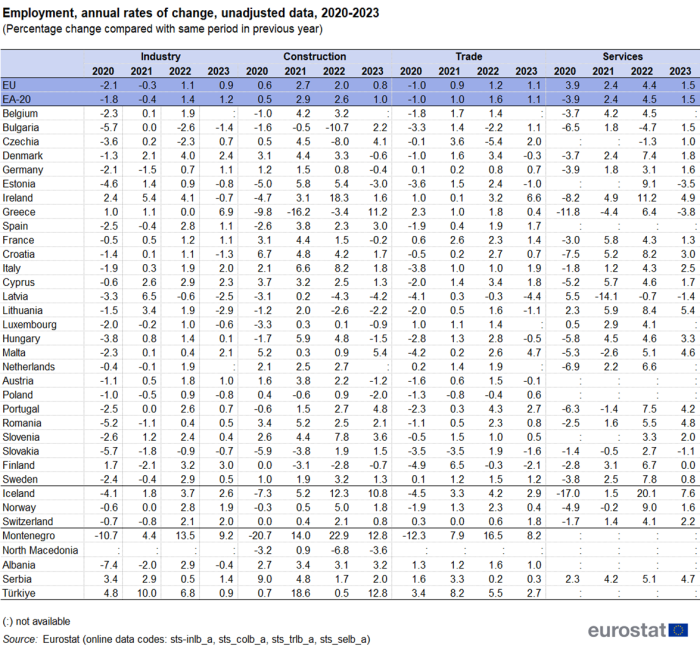
Table 1 provides an overview of annual rates of change for the years 2020 - 2023. Mainly as a result of the Covid-19 crisis, the 2020 annual growth rates for industrial employment were negative in almost all EU countries. The strongest decreases were recorded in Bulgaria (-5.7 %), Slovakia (-5.7 %), and Romania (-5.2 %). Exceptions from the general trend were Ireland (2.4 %), Finland (1.7 %), and Greece (1.0 %). In 2021, the majority of countries experienced positive rates of change, yet the EU as a whole still saw a further decline in employment in industry (-0.3 %). In 2022, the positive trend increased further with an employment growth in the EU of 1.1. %. In 2023, the overall development was still positive (0.9 % in the EU) but not as strong as before.
Despite the pandemic, about half of the EU countries experienced an employment increase in the construction sector in 2020 (Czechia, Denmark, Germany, France, Croatia, Italy, Cyprus, Malta, the Netherlands, Austria, Poland, Romania, Slovenia, and Sweden). In general, however, the employment growth in 2020 was much more modest than in the years before (0.6 % in the EU). In 2021 and in 2022, employment levels in construction developed relatively dynamically (2.7 % in 2021 and 2.0 % in 2022). In 2023, the employment increase slowed down significantly (0.8 % in the EU). Several countries still experienced a solid growth (11.2 % in Greece, 5.4 % in Malta, 4.8 % in Portugal) but some larger economies already displayed a decline (-0.4 % in Germany, -0.2 % in France).
For employment in trade, a loss in employment of 1.0 % was recorded in 2020 for the EU and the large majority of countries (20 out of 27) recorded a reduction in employment levels. The countries that showed a positive (although often small) growth were Germany, Ireland, Greece, France, Luxembourg, the Netherlands and Sweden. In general, the differences between countries in the trade sector are less pronounced than in other sectors. In 2021, 2022, and 2023, employment levels recovered.
In 2020, several service sectors, notably air transport, hotels and restaurants, were severely hit by the pandemic. Consequently, the fall in employment levels was rather strong (-3.9 % in the EU). The strongest declines were recorded in Greece (-11.8 %), Ireland (-8.2 %), and in Croatia (-7.5 %). Only three countries displayed an increase in service employment: Latvia (5.5 %), Lithuania (2.3 %), and Luxembourg (0.5 %). Note that data are not yet available for all EU countries. 2021 brought a recovery and a moderate increase in service employment (2.4 % in the EU) which was, however, not sufficient to balance the losses of the previous year. In 2022, however, employment growth was rather strong (4.4 % in the EU) and the pandemic losses were balanced out. In this year almost all countries for which data are available showed an increase in employment, with the highest growth rates recorded in Ireland (11.2 %), Estonia (9.1 %), and Lithuania (8.4 %). 2023 saw a further yet moderate increase in employment in the service sector (1.5 % in the EU).
(Percentage change compared with same period in previous year)
Source: Eurostat (sts_inlb_a), (sts_colb_a), (sts_trlb_a) and (sts_selb_a)
Source data for tables and graphs
Data sources
Data sources, aggregation and availability
Short-term statistics present data on the number of persons employed. This statistical concepts differs from other statistical employment concepts which are for example used by the labour force survey or national accounts. In short-term statistics the number of persons employed is collected by aggregating the number of persons employed in the statistical units, i.e. the businesses. The number of persons employed is thus in effect a number of jobs. If a person holds two jobs (e.g. regular daytime job and occasional week-end job) both jobs will be considered in the statistics. Persons employed are not identical with employees (i.e. persons who have a work contract with an employer and receive a remuneration in return for their work) but include for example unpaid family workers. Persons employed also include home workers, apprentices, persons on leave, part time workers, temporary workers and seasonal workers. Not included are persons supplied to the business by other enterprises or persons carrying out repair and maintanance work in the observation unit on behalf of other businesses.
The measure of hours worked is rather comprehensive, it not only includes the normal hours but also overtime, hours worked on holidays and time which is spent on the preparation of actual work, hours spent at the working place during which no actual work is done and even short periods of rest at the work place. Thus, in broad terms, hours worked represent hours paid. However, they do not include hours paid but not worked (e.g. paid holidays or sick leave). They do also not include time spent for meal breaks or time for commuting between home and work place. With the Regulation (EU) No 2019/2152 of 27 November 2019 (European Business Statistics Regulation) and the Commission Implementing Regulation (EU) No 2020/1197 of 30 July 2020 the hours worked encompass only the hours worked by employees but not the hours worked by self-employed.
The indicators of wages and salaries include all remuneration in cash or in kind in exchange for work including bonuses, allowances and similar payments. Social contributions payable by the employee are also included even if they are withheld and transferred to the authorities by the employer. Not included are social contributions payable by the employer, payroll taxes or expenses related to services provided by agency workers. The statistical sources used to establish STS labour input data vary. In some cases special surveys are used, in others data are collected from administrative sources.
The European Business Statistics Regulation requires that Member States collect labour input data and transmit them to Eurostat at least quarterly. However for several Member States data are also available on a monthly basis ( (sts_inlb_m), (sts_colb_m), (sts_trlb_m), (sts_selb_m) ).
Context
Employment is a variable that is important in both economic and social statistics. Labour input is one of the main costs of production. Employment, in its own right, is an important short-term indicator in monitoring the economy. The proportion of the working population in employment, the type of job they do and their working patterns are social variables of interest. The collection of short-term information on employment has a number of important uses:
- to evaluate the economic situation to help monitor the economic cycle;
- to calculate measures of productivity;
- to help calculate income from employment in national accounts.
The collection of information on labour indicators according to the European Business Statistics Regulation give a broad economic picture and shows the balance between services and industry. Note however that to a large extent, services in STS are business services, i.e. services consumed by business like market research, business consultancy, employment activities and also transport and communication but not public services or financial services.
Direct access to
- Industry (NACE Rev.2) (t_sts_ind)
- Industry labour input index (NACE Rev.2) (t_sts_ind_labo)
- Construction, building and civil engineering (NACE F) (t_sts_cons)
- Construction labour input (teiis520)
- Trade and services (t_sts_ts)
- Wholesale and retail trade (NACE G, NACE Rev.2) (t_sts_wrt)
- Labour input index (NACE Rev.2) (t_sts_wrt_li)
- Wholesale and retail trade (NACE G, NACE Rev.2) (t_sts_wrt)
- Industry (NACE Rev.2) (sts_ind)
- Industry labour input index (NACE Rev.2) (sts_ind_labo)
- Construction, building and civil engineering (NACE F) (sts_cons)
- Construction labour input index (sts_cons_lab)
- Trade and services (t_sts_ts)
- Wholesale and retail trade (NACE G, NACE Rev.2) (sts_wrt)
- Labour input index (NACE Rev.2) (sts_wrt_li)
- Wholesale and retail trade (NACE G, NACE Rev.2) (sts_wrt)
- Short-term labour input indicators 2011 - Statistics in focus 1/2012
- Economic downturn in the EU: the impact on employment in the business economy - Statistics in focus 60/2009
- Short-term business statistics – focus on employment - Statistics in focus 70/2008