Build resilient infrastructure, promote inclusive and sustainable industrialisation and foster innovation (statistical annex)
Data extracted in May 2020.
Planned article update: June 2021.
Highlights

This article provides an overview of statistical data on SDG 9 ‘Industry, innovation and infrastructure’ in the European Union (EU). It is based on the set of EU SDG indicators for monitoring of progress towards the UN Sustainable Development Goals (SDGs) in an EU context.
This article is part of a set of statistical articles, which are based on the Eurostat publication ’Sustainable development in the European Union — Monitoring report - 2020 edition’. This report is the fourth edition of Eurostat’s series of monitoring reports on sustainable development, which provide a quantitative assessment of progress of the EU towards the SDGs in an EU context.
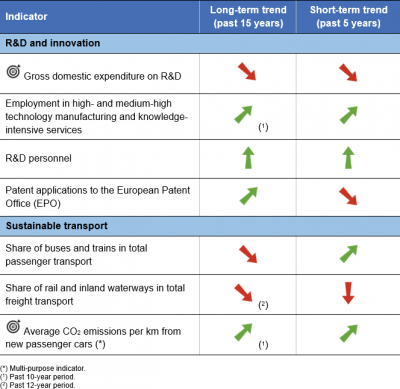
Table 1: Indicators measuring progress towards SDG 9, EU-28

Table 2: Explanation of symbols for indicating progress towards SD objectives and targets


Gross domestic expenditure on R&D

This indicator measures gross domestic expenditure on R&D (GERD) as a percentage of the gross domestic product (GDP) — the R&D intensity. The Frascati Manual defines research and development (R&D) as creative and systematic work undertaken in order to increase the stock of knowledge — including knowledge of humankind, culture and society — and to devise new applications of available knowledge.
.png)
Source: Eurostat (sdg_09_10)
_of_the_gross_domestic_expenditure_on_R%26D_as_a_share_of_GDP,_EU,_2020.png)
Source: Eurostat (sdg_09_10)
.png)
Source: Eurostat (sdg_09_10)
Science & technology personnel

This indicator measures human resources in science and technology (HRST) as a share of the active population in the age group 25 to 64. HRST encompasses people who have successfully completed tertiary education or who are employed in science and technology occupations where such education level is normally required. HRST are measured mainly using the concepts and definitions laid down in the Canberra Manual.
.png)
Source: Eurostat (sdg_09_21)
_of_the_share_of_human_resources_in_science_and_technology_EU,_2020.png)
Source: Eurostat (sdg_09_21)
.png)
Source: Eurostat (sdg_09_21)
R&D personnel

This indicator measures the share of R&D personnel broken down by the following institutional sectors: business enterprise, government, higher education and private non-profit. Data are presented in full-time equivalents as a share of the economically active population (the labour force). R&D personnel consists of those persons engaged directly in R&D — that is the creative and systematic work undertaken in order to increase the stock of knowledge and to devise new applications of available knowledge. It is therefore a much narrower concept as ‘Human resources in science and technology’ above.
.png)
_of_the_share_of_R%26D_personnel,_EU,_2020.png)
Source: Eurostat (sdg_09_30)
.png)
Source: Eurostat (sdg_09_30)
Patent applications to the European Patent Office

This indicator measures the requests for protection of an invention filed with the European Patent Office (EPO) regardless of whether they are granted or not. The number of applications include direct European applications (Direct) and international applications (PCT) that were designated to the EPO during the reporting period (PCT regional). Applications are allocated according to the country of residence of the first applicant listed on the application form (first-named applicant principle). In cases where several applicants are mentioned on the application form, the country of residence of the first applicant listed applies. The country of residence of the applicant is not necessarily the same as the county of residence of the inventor.
.png)
Source: Eurostat (sdg_09_40)
_of_the_patent_applications_to_the_European_Patent_Office_(EPO),_EU,_2020.png)
Source: Eurostat (sdg_09_40)
.png)
Source: Eurostat (sdg_09_40)

This indicator measures the share of buses, including coaches and trolley-buses, and trains in total passenger transport,expressed in passenger-kilometres (pkm). Total passenger transport here includes transport by passenger cars, buses and coaches, and trains, but excludes air and sea transport. All data should be based on movements within national territories, regardless of the nationality of the vehicle. The data collection is voluntary and not fully harmonised at the EU level. Other collective transport modes, such as tram and metro systems, are not included due to the lack of harmonised data.
.png)
Source: Eurostat (sdg_09_50)
_of_the_share_of_buses_and_trains_in_total_passenger_transport,_EU,_2020.png)
Source: Eurostat (sdg_09_50)
.png)
Source: Eurostat (sdg_09_50)

This indicator measures the share of rail and inland waterways in total inland freight transport, expressed in tonne-kilometres (tkm). Inland freight transport modes include road, rail and inland waterways. All data are based on movements on national territory; rail and inland waterways transport are collected based on movements on national territory, regardless of the nationality of the train or vessel. Road transport is redistributed to the national territory on the basis of reported data on the activity of the vehicles registered in each country and modelling the likely journey itinerary by projecting it on the European road network. Neither sea nor air freight transport are currently represented in the indicator.
.png)
Source: Eurostat (sdg_09_60)
_of_the_share_of_rail_and_inland_waterways_in_total_freight_transport,_EU,_2020.png)
Source: Eurostat (sdg_09_60)
.png)
Source: Eurostat (sdg_09_60)
Explore further
Other articles
Database
Thematic section
Methodology
More detailed information on EU SDG indicators for monitoring of progress towards the UN Sustainable Development Goals (SDGs), such as indicator relevance, definitions, methodological notes, background and potential linkages, can be found in the introduction of the publication ’Sustainable development in the European Union — Monitoring report - 2020 edition’.