Archive:ESA 2010 - Distributive transactions
4.01
Definition: distributive transactions are transactions whereby the value added generated by production is distributed to labour, capital and government, and transactions redistributing income and wealth.
A distinction is drawn between current and capital transfers, with capital transfers redistributing saving or wealth, rather than income.
Full article
Compensation of employees (D.1)
4.02
Definition: : compensation of employees (D.1) is defined as the total remuneration, in cash or in kind, payable by an employer to an employee in return for work done by the latter during an accounting period.
Compensation of employees is made up of the following
components:
(a) wages and salaries (D.11):
- wages and salaries in cash,
- wages and salaries in kind;
(b) employers’ social contributions (D.12):
- employers’ actual social contributions (D.121):
- :Indented lineemployers’ actual pension contributions (D.1211),
- :Indented line* employers’ actual non-pension contributions (D.1212),
- employers’ imputed social contributions (D.122):
- :Indented line* employers’ imputed pension contributions (D.1221),
- :Indented line* employers’ imputed non-pension contributions (D.1222).
Urban population
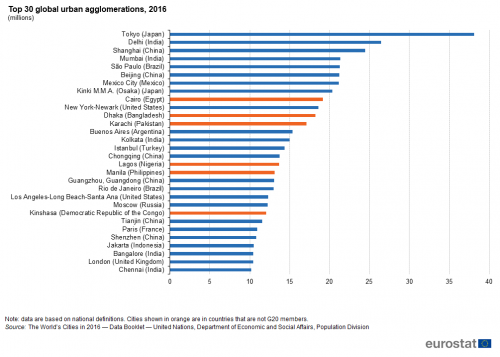
The growth of urban areas reflects the transition from rural to urban areas resulting from a move away from agriculture-based economies to industrial and post-industrial economies. Urban areas are often characterised by their high concentrations of population, economic activity, employment and wealth. The daily flow of commuters into many cities suggests that numerous opportunities exist in these hubs of innovation, distribution and consumption, many of which act as focal points within their regional and national economies and in some cases even worldwide. Although cities are motors for economic growth, they are also confronted by a wide range of problems, like crime, traffic congestion, pollution and various social inequalities. Furthermore, within many cities it is possible to find people who enjoy a comfortable lifestyle living in close proximity to others who may face considerable challenges, for example, in relation to affordable/adequate housing or poverty — herein lies the ‘urban paradox’.
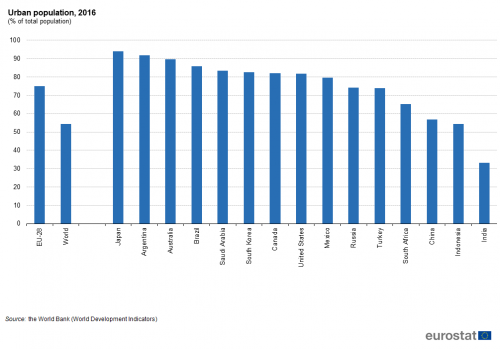
Three quarters (75.0 %) of the EU-28 population lived in an urban area in 2016, considerably above the world average of 54.3 % (see Figure 2). Nevertheless, the share of inhabitants living in urban areas was higher than in the EU-28 in nine of the non-EU G20 members, exceeding 90 % in Japan (93.9 %) and Argentina (91.9 %) and approaching 90 % in Australia. In Russia and Turkey the urban share was just below three-quarters , while in South Africa it was close to two thirds and in China and Indonesia it was just over a half. Among the G20 members, India had by far the lowest share, with around one third (33.1 %) of its population living in urban areas.Population age structure
Ageing society represents a major demographic challenge for many economies and may be linked to a range of issues, including, persistently low levels of fertility rates and significant increases in life expectancy during recent decades.
Figure 4 clearly shows how different the age structure of the EU-28’s population is from the average for the whole world. Most notably the largest shares of the world’s population are among the youngest age classes, whereas for the EU-28 the share of the age groups below those aged 45-49 years generally gets progressively smaller approaching the youngest age groups. The structure in the EU-28 reflects falling fertility rates over several decades and a modest increase about 5-10 years ago, combined with the impact of the baby-boomer age groups on the population structure (resulting from high fertility rates in several European countries up to the mid-1960s). This overall pattern of a progressively smaller share of the population in the younger age groups in the EU-28 stops at the age group 10-14, below which the share increases in the age group 5-9 and decreases again in the age group 0-4. Another notable difference is the greater gender imbalance within the EU-28 among older age groups than is typical for the world as a whole. Some of the factors influencing age structure are presented in the rest of this article and the article on health, for example, fertility, migration and life expectancy.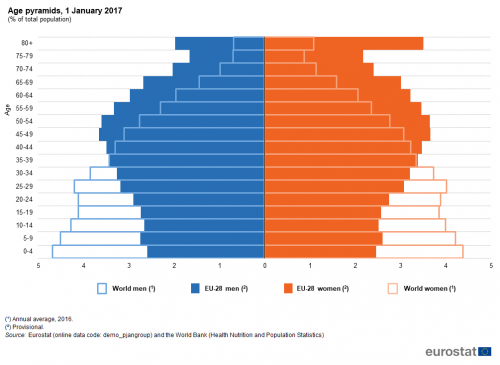
(% of total population)
Source: Eurostat (demo_pjangroup) and the World Bank (Health Nutrition and Population Statistics)
Japan had by far the highest old-age dependency ratio in 2015
The young and old age dependency ratios shown in Figures 5 and 6 summarise the level of support for younger persons (aged less than 15 years) and older persons (aged 65 years and over) provided by the working-age population (those aged 15-64 years). In 2015, the young-age dependency ratio ranged from 19.0 % in South Korea to more than double this ratio in South Africa (44.8 %), with the latest value (23.8 %) for the EU-28 lower than in most G20 members. By far the highest old-age dependency ratio in 2015 was the 42.7 % observed in Japan, indicating that there were more than two people aged 65 and over for every five people aged 15 to 64 years; the next highest old-age dependency ratio was 28.8 % in the EU-28. Saudi Arabia had by far the lowest old-age dependency ratio (4.3 %) in 2015 among G20 members.
In percentage point terms, the fall in the young-age dependency ratio for the EU-28 between 1965 and 2015 more than cancelled out an increase in the old-age dependency ratio. Most of the G20 members displayed a similar pattern, with two exceptions: in Japan the increase in the old-age dependency ratio exceeded the fall in the young-age dependency ratio; in Saudi Arabia both young and old-age dependency ratios were lower in 2015 than in 1965, reflecting a large increase in the size of its working-age population.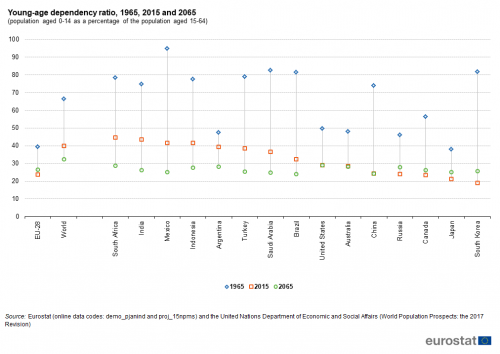
(population aged 0-14 as a percentage of the population aged 15-64)
Source: Eurostat (demo_pjanind) and (proj_15npms) and the United Nations Department of Economic and Social Affairs (World Population Prospects: the 2017 Revision)
With relatively low fertility rates the young-age dependency ratio is projected to be lower in 2065 than it was in 2015 in several G20 members, dropping by more than 10 points in India, Mexico, South Africa, Indonesia, Turkey, Saudi Arabia and Argentina. Projected increases for this ratio are relatively small among G20 members, peaking at 6.6 points in South Korea. In the EU-28, the young-age dependency ratio is projected to increase from 23.8 % in 2015 to 26.7 % by 2065, but will remain well below the world average of 32.4 %, as it will in all G20 members.
Old-age dependency ratios are projected to continue to rise in all G20 members, suggesting that there will be an increasing need to provide for social expenditure related to population ageing (for example, for pensions, healthcare and long-term care). The EU-28’s old-age dependency ratio is projected to increase from 28.8 % in 2015 to 51.4 % by 2065, when it is projected to be 21.8 points above the world average, but considerably lower than in South Korea (76.0 %) or Japan (71.1 %).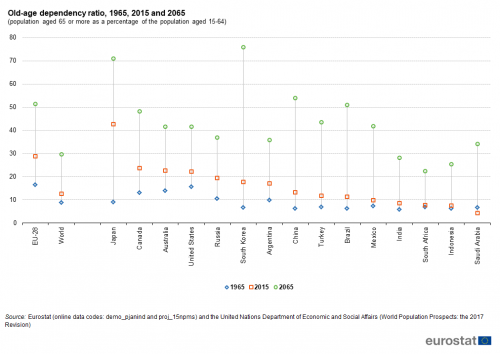
(population aged 65 or more as a percentage of the population aged 15-64)
Source: Eurostat (demo_pjanind) and (proj_15npms) and the United Nations Department of Economic and Social Affairs (World Population Prospects: the 2017 Revision)
Population change
There are two distinct components of population change: the natural change that results from the difference between the number of live births and the number of deaths; and the net effect of migration, in other words, the balance between people coming into and people leaving a territory. Since many countries do not have accurate figures on immigration and emigration, net migration may be estimated as the difference between the total population change and the natural population change.
The crude birth rate in the EU-28 in 2015 was among the lowest across the G20 members
In 2015, the crude birth rate (the ratio of the number of live births to the population) for the EU-28 was slightly lower than in 2005; this rate remained among the lowest recorded across the G20 members, with only South Korea and Japan recording lower birth rates. By contrast, crude birth rates in South Africa and Saudi Arabia were around double the average rate for the EU-28.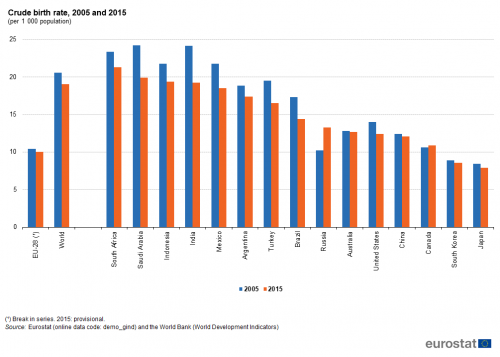
(per 1 000 population)
Source: Eurostat (demo_gind) and the World Bank (World Development Indicators)
The highest crude death rates (the ratio of the number of deaths to the population) in 2015 were recorded in Russia, the EU-28, South Africa and Japan; in the case of South Africa this reflected in part an HIV/AIDS epidemic which has resulted in a large number of deaths among relatively young persons, such that that the difference between crude birth and death rates in South Africa was slightly below the world average despite the above average birth rate.
When the death rate exceeds the birth rate there is negative natural population change; this situation was experienced in Japan in 2015. The reverse situation, natural population growth — due to a higher birth rate — was observed for all of the remaining G20 members (see Figure 8) with the largest differences recorded in Saudi Arabia, Mexico, Indonesia, India, South Africa and Turkey.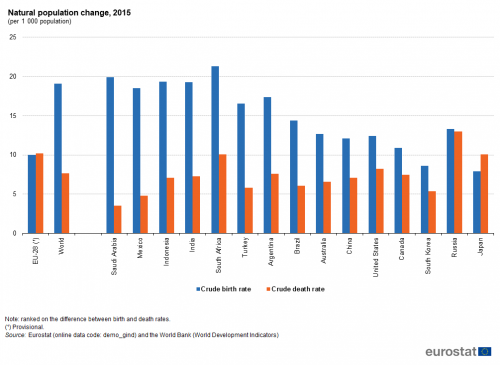
(per 1 000 population)
Source: Eurostat (demo_gind) and the World Bank (World Development Indicators)
The level of net migration is the difference between the number of immigrants and the number of emigrants during a period of time; a positive value represents more people entering the country than leaving it.
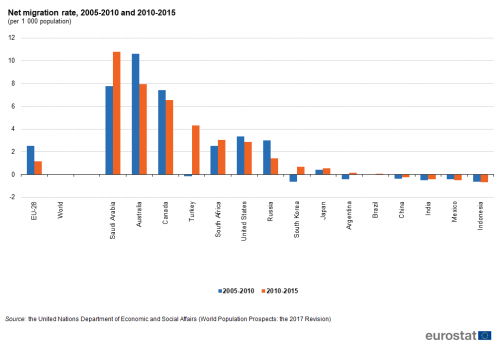
The net migration rate compares the level of net migration with the overall size of the population. Between 2010 and 2015, four G20 members — Indonesia, Mexico, India and China — recorded negative net migration rates (see Figure 9), while Brazil recorded a balanced situation, as immigration and emigration were broadly equal. On the other hand, all other G20 members including the EU-28 experienced positive net migration, with particularly high net migration rates in Turkey, Canada, Australia and Saudi Arabia. This situation was somewhat different to that observed five years earlier, between 2005 and 2010, as during that period seven G20 members had experienced negative net migration, including Turkey which in the most recent five year period had one of the highest rates of positive net migration (in part, fuelled by the crisis in Syria).Asylum
In 2016, the United Nations High Commissioner for Refugees (UNHCR) reported that there were at least 19.9 million asylum seekers across the world. Asylum is a form of protection given by a state on its territory. It is granted to a person who is unable to seek protection in their country of citizenship and/or residence in particular for fear of being persecuted for various reasons (such as race, religion or opinion). An asylum seeker is someone who is seeking international protection but whose claim for refugee status has not yet been determined. In 2016, according to the UNHCR there were at least 1.1 million asylum seekers in the EU-28: the highest numbers were from Afghanistan (224 thousand), Syria (145 thousand) and Iraq (111 thousand), followed by Nigeria, Pakistan and Iran (each accounting for around 50 thousand asylum seekers). The biggest numbers of asylum seekers in the EU-28 from other G20 members came from Russia (28 thousand), Turkey (12 thousand), India (6 thousand) and China (6 thousand).
Refugees include individuals recognised under the 1951 Convention relating to the Status of Refugees as well as under a number of other protocols and conventions, including people enjoying temporary protection or living in a refugee-like situation. Figure 10 shows that, among the G20 members in 2016, Turkey had by far the highest number of refugees (relative to its population size); the ratio in Turkey was around 10 times as high as in the EU-28 and reflected its location close to the countries of origin of many of the refugees. Aside from Turkey and the EU-28, there were relatively high numbers of refugees relative to the population size in Canada, Australia, South Africa (many of whom originated from Somalia, the Democratic Republic of Congo or Ethiopia), Russia (nearly all of whom were from Ukraine) and the United States.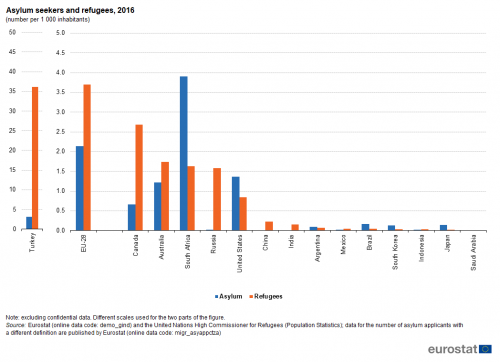
(number per 1 000 inhabitants)
Source: Eurostat (demo_gind) and the United Nations High Commissioner for Refugees (Population Statistics); data for the number of asylum applicants with a different definition are published by Eurostat (online data code: migr_asyappctza)
Source data for tables and graphs
Data sources
The statistical data in this article were extracted during March 2018.
The indicators are often compiled according to international — sometimes worldwide — standards. Although most data are based on international concepts and definitions there may be certain discrepancies in the methods used to compile the data.
EU data
Most of the indicators presented for the EU have been drawn from Eurobase, Eurostat’s online database. Eurobase is updated regularly, so there may be differences between data appearing in this article and data that is subsequently downloaded. In exceptional cases some indicators for the EU have been extracted from international sources.
G20 members from the rest of the world
For the 15 non-EU G20 members, the data presented have been compiled by a number of international organisations, namely the Food and Agriculture Organisation, the United Nations Department of Economic and Social Affairs, the United Nations High Commissioner for Refugees, and the World Bank. For some of the indicators shown a range of international statistical sources are available, each with their own policies and practices concerning data management (for example, concerning data validation, correction of errors, estimation of missing data, and frequency of updating). In general, attempts have been made to use only one source for each indicator in order to provide a comparable dataset for the members.
Context
As a population grows or contracts, its structure changes. In many developed economies the population’s age structure has become older as post-war baby-boom generations reach retirement age. Furthermore, many countries have experienced a general increase in life expectancy combined with a fall in fertility, in some cases to a level below that necessary to keep the size of the population constant in the absence of migration. If sustained over a lengthy period, these changes can pose considerable challenges associated with an ageing society which impact on a range of policy areas, including labour markets, pensions and the provision of healthcare, long-term care, housing and social services.
Direct access to
- The EU in the world 2018
- The European Union and the African Union — A statistical portrait — 2018 edition;
- Sustainable Development in the European Union — Monitoring report on progress towards the SDGs in an EU context
- Migrant integration statistics
- Globalisation patterns in EU trade and investment
- 40 years of EU-ASEAN cooperation — 2017 edition
- Key figures on the enlargement countries — 2017 edition
- Asia-Europe Meeting (ASEM) — A statistical portrait — 2016 edition
- Euro-Mediterranean statistics — 2015 edition
- The European Union and the BRIC countries
- The European Union and the Republic of Korea — 2012
- Population (t_demo_pop), see:
- Population density (tps00003)
- Population (demo_pop), see:
- Population on 1 January by age group and sex (demo_pjangroup)
- Population: Structure indicators (demo_pjanind)
- Population projections at national level (2015-2080) (proj_15n)
- Population on 1st January by age, sex and type of projection (proj_15npms)
- Asylum and Dublin statistics (migr_asy)
- Applications (migr_asyapp)
- Food and Agriculture Organisation of the United Nations (FAO)
- United Nations Department of Economic and Social Affairs
- United Nations High Commissioner for Refugees UNHCR
- The World Bank
