Archive:Energy, transport and environment - statistics on three closely related domains
- Data extracted in Month YYYY. Most recent data: Further Eurostat information, Main tables and Database. Planned article update: (dd) Month YYYY(, hh:00).
Energy supply and use is of fundamental importance to society. However, energy production and consumption in all sectors of the economy has environmental impacts with transport, being recognised as one of the major sectors affecting the environment. Transportation is accounting for a big share of the energy spent for carrying out and maintaining the range and scope of human activities. The use of the internal combustion engine has facilitated the efficient movement of freight and passengers and prompted the development of a world trade network. Nevertheless, there are environmental aspects linked to transportation and these include atmospheric and noise pollution, land take, resource use and the effects of waste disposal. The largest impacts come from fuel use by transport, but the effects from development and construction of infrastructure and vehicles, as well as the waste from their disposal, add to the environmental costs of transport.
This article provides one of many examples of how transport, energy and the environment are interlinked in everyday human activities. It discusses our societal needs for transport and how they relate to the economy; the demand in energy in order to cover these needs; some impacts of transport and energy demand on the environment; and the policies that the European Union has put in place in order to develop clean energy technologies and a resource-efficient transport system that will benefit the environment and our well-being.
Source: Eurostat (trans_hv_pstra)
Source: Eurostat (trans_hv_psmod)
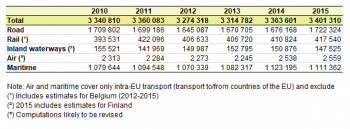
Source: Eurostat (rail_go_typeall) (rail), (iww_go_atygo) (inland waterways), (road_go_ta_tot) (national road transport) (road_go_ca_c) (road cabotage transport) and Eurostat computations (international road transport, air and maritime transport)
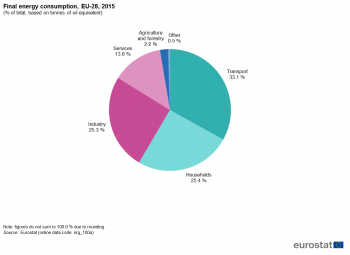
Source: Eurostat (nrg_100a)
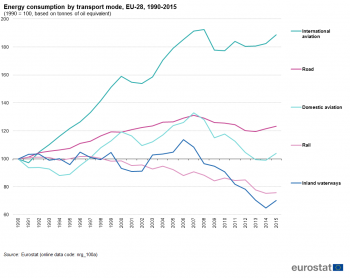
Source: Eurostat (nrg_100a)
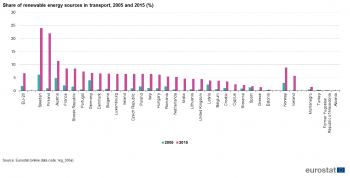
Source: Eurostat (nrg_ind_335a)
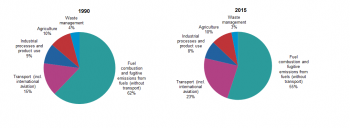
Source: Eurostat (env_air_gge), European Environment Agency
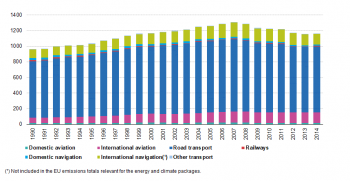
Source: EEA, republished by Eurostat (env_air_gge)
Main statistical findings
Eurostat's energy statistics present energy consumption by economic activity and by energy source, and shows that transportation consumes one third of the total final energy consumption in EU-28. All modes of transport need energy, however the energy efficiency of each mode of passenger and freight transport and their resulting environmental impact differ significantly.
Transport statistics allow for an in depth analysis of the volume and the share of passenger transport, be it by individual cars, trains, buses, ships and airplanes, as well as for transport of freight by roads, trains or by ships on the sea and inland waterways.
Environmental statistics and accounts present the impact on the environment caused by economic activities and households, e.g. emission of greenhouse gas (GHG) from energy generation in power plants, or emission of air pollutants from vehicles with internal combustion engines.
Improved efficiency in energy generation and in energy use for transportation as well as a shift to more environment-friendly transport modes can lead to a reduction of the current pressures on the environment. Energy, transport and environment statistics combined and analysed, together with socio-economic indicators, are important elements for enabling policy makers to take decisions for sustainable, forward-looking policies. Such decisions may result in significant financial investments with long lasting impacts for the current and future generations.
Transport and the economy
The driving force for transport activities is our economy; transport is fundamental for a functioning and growing economy and its demand is high in urban, industrial and other densely populated areas.
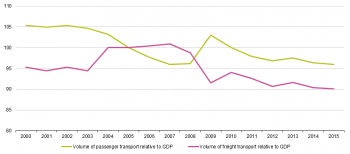
Figure 1 shows the indexed volumes of passenger transport (in passenger-kilometres) and freight transport (in tonne-kilometres) in relation to GDP (in chain-linked volumes, at 2005 exchange rates). The charts present the link between economic development and transport needs and can answer the question if economic growth is possible without an increase in transport demands.
The extent to which transport demand for passengers and goods is coupled with GDP decreased between 2000 and 2015. The economic crisis in 2008 – 2009 had a strong negative impact on freight transport, however, passenger transport did not decline but continued to increase steadily during that period and the years after. The charts suggest that passenger transport seems to be less sensitive to economic changes than freight transport.
From 2010 – 2015 both, passenger and freight transport, showed a decreasing development in transport demand per unit of GDP: The index for passenger transport fell from 100 % to 96 % and for freight transport from 94 % to 90.1 %. This recent development can be interpreted as an absolute decoupling of transport demand from economic growth.
However, transport activities have environmental and societal impacts. Local greenhouse gas (GHG) emissions from transportation contribute to global climate change. Air pollution from vehicles with internal combustion engines harm human health and biota in cities and urban areas, and affect building surfaces. Traffic noise has negative impacts on people living close to busy streets, motorways, rail tracks and airports, and growing transport volumes cause congestion, and as result of traffic accidents, fatalities or injuries.
Passenger and freight transport
Transport modes for both passengers and goods include transport by road, rail, inland waterways, aviation and maritime. The preference given to different modes of transport varies across the EU Member States, depending highly on the availability of infrastructure. However, road transport remains a predominant mode and consequently a main source of emissions. Nevertheless, the demand for air passenger transport, as well as for air and railway freight transport has increased in the last years.
Inland passenger transport
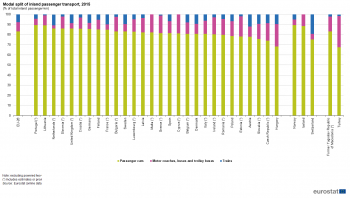
The split of transport demand between the different modes (modal split) can be used to measure whether a shift towards more environmental friendly types of transport is observed. The modal split of inland passenger transport (percentage share of each mode of transport, expressed in passenger-kilometres) considers transportation by: passenger car; motor coach, bus and trolley bus; and train (see Figure 2).
The principal mode of inland passenger transport is the passenger car. Passenger cars accounted for 83.1 % of inland passenger transport in the EU-28 in 2015, with motor coaches, buses and trolley buses for 9.2 % and trains only for 7.7 %. The automobile is the most common road vehicle. Most of the EU Member States have reported an increase in the motorisation rate over the last ten years. In 2015, the number of passenger cars per 1 000 inhabitants in the EU-28 was 497. In absolute terms, passenger cars account for most of the overall increase in passenger transport volumes seen since 2000, followed by aviation and railways.
Passenger cars offer high flexibility; however they have a low transport capacity per vehicle, contribute to the noise level and air pollution in the cities, and generate an economic burden, e.g. by lost working hours caused by congestion or increased health costs. The environmental and resulting economic burden could be reduced by promoting the use of public transport or bicycles.
Freight transport
The growing economy is the driving force for an increased demand for goods and services. Goods production, spread over various locations, requires the transportation of raw materials and semi-finished goods between various actors in the supply chain, and of the final product to the end-user. The ability to move goods safely, quickly and cost-efficiently to markets explains the relatively fast growth of the freight transport volume across the EU. Online shopping has also increased transport to deliver the items purchased via the Internet to the consumer. In comparison with the passenger transport, the freight transport is more sensitive to economic changes.
In 2015, 1 764 billion tonne-kilometres were accounted to the road freight transport in the EU-28, which represents an increase of 2.2 % compared with 2014. In 2015, 21.1 % of the journeys were performed by empty vehicles (24.3 % for national and 12.6 % for international transport).
In 2015, road freight vehicles 5 years old or less accounted for 57.6 % of the total tonne-kilometres with those over 10 years old performing only 15.0 % of tonne-kilometres. Road freight vehicles less than 2 years old have dominated the European market in 2015 with around 280 billion tonne-kilometres (15.9 % of the total tonne-kilometres).
The modal split for five transport modes - road, rail, inland waterways, maritime and air transport - shows the relative importance of the different modes. The total EU-28 freight transport performance (expressed in million tonne-kilometres) increased by 1.8 % during the period 2010-2015 (see Table 1). Road transport increased by less than 1 %, while air and rail transport performance increased significantly by 10.7 % and 6.1 % respectively for the same period. The performance of maritime transport increased by 2.9 %.
In 2015, road accounted for 50.6 % of all tonne-kilometres performed in the EU-28. Maritime transport came next, with 32.7 % of the total transport performance, followed by rail (12.3%) and inland waterways (4.3%). Air transport plays only a marginal role at EU level, with a share of 0.1%.
Use of new vehicles, minimising empty journeys and more freight transport by rail and inland waterways would cause a significantly lower pressure to the environment. Transport by rail and inland waterways have substantially lower CO2 emissions per tonne-kilometre than road transport. Emissions of other air pollutants per tonne-kilometre are lowest for rail transport.
Energy consumption of the transport sector
In 2015, the energy demand for transport activities was 352.9 Mtoe, meaning that the transport sector accounted for one third, 33 %, of the final energy consumed in the EU (see Figure 3).
When it comes to the energy consumption by transport mode, Figure 4 shows that international aviation had the highest growth in energy consumption between 1990 and 2015, rising by 88.8 % overall. Road transport (the largest transport mode) and domestic aviation are the only other transport modes that have increased over this period, as their energy consumption rose by 23.3 % and 4.0 % respectively. By contrast, rail transport consumed 24.2 % and transport via inland waterways 29.9 % less energy in 2015 than in 1990.
In 2015, the transport sector was by far the main consumer of petroleum products. The dependency on oil is still above 93 %, and all other fuels (gas: liquefied natural gas - LNG and liquefied petroleum gas - LPG, renewables (biofuels) and electricity) so far play a minor role in transport (see Figure 5).
Passenger cars, as they are mainly powered by internal combustion engines, still use mostly petrol or diesel. In 2015, more than 50 % of the cars were petrol-driven. The share of diesel-powered cars in the car fleet is varying across the EU Members States. Their share in each country correlates with the level of subsidies granted by the Member State, e.g. a lower taxation of diesel than of petrol.
In 2014, 274 Mtoe of fossil fuels were used as petrol and diesel in combustion engines in the EU whereas the same year the consumption of biofuels reached the 14 Mtoe. Consumption of liquid biofuels in transport has been growing steadily but slowly. Biofuels are liquid or biogas transport fuels (e.g. biodiesel and bioethanol) which are made from biomass as a renewable alternative to fossil fuels.
The use of renewable energy sources is seen as a key element in energy policy, reducing the dependence on fuel imported from non-EU countries, reducing emissions from fossil fuel sources, and decoupling energy costs from oil price. Directive 2009/28/EC on the promotion of the use of energy from renewable sources sets an overall goal across the EU for a 20 % share of energy consumption to be derived from renewable sources by 2020, while renewables should also account for a 10 % share of the fuel used in the transport sector by 2020.
The average share of renewable energy sources in transport fuel consumption was 6.7 % in 2015, almost 4 times as high as in 2005 (1.8 %) (see Figure 6). However there are significant differences in the Member States: the highest values were in Sweden (24 %) and Finland (22 %) and the lowest shares in Greece (1.4 %) and Estonia (0.4 %).
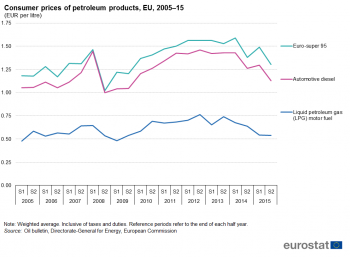
At the end of 2015, the average price of Euro-super 95 in the EU was EUR 1.30 per litre and the average price of automotive diesel was EUR 1.13 per litre. These are the lowest levels since the end of 2009 (see Figure 7). Taxes and duties make up more than 50 % of the final price of Euro-super 95 and automotive diesel in each of the EU Member States.
Environmental impact of mobility
The growth of passenger and freight mobility have made transport a significant contributor to environmental pressures, such as biodiversity fragmentation, emissions of greenhouse gases and other air pollutants, and noise.
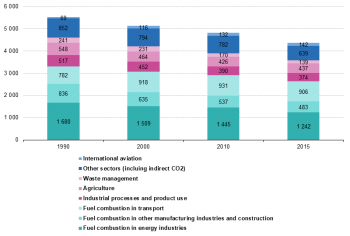
In 1990, the share of transport-related GHG emissions (incl. international aviation) was 15 % and in 2015 it had increased to 23 % (see Figure 8). When almost all other sectors managed to reduce their GHG emissions, the transport sector increased its contribution by 8 %.
Road transport is the largest contributor with almost three quarters of the transport-related GHG emissions. International navigation constitutes over 10 % of the total GHG emissions of transport. International aviation has the largest growth over the years by doubling its GHG emissions (see figure 9).
Fuel combustion in transport accounted for 20.4 % of total EU emissions in 2015, making it the second largest source after the energy industries. Emissions from international aviation more than doubled between 1990 and 2015, increasing from 69 to 142 million tonnes of CO2 equivalent (see figure 10).
Story box: ‘Air transport – a constantly increasing mode’
| The growth of low-cost airlines connected to the expansion of tourism and low prices for air tickets are some of the factors that have contributed to the longer-term increase in demand for energy for domestic and international aviation. Aviation is expected to significantly increase its modal contribution by 2050. 918 million passengers travelled by air in the European Union in 2015, an increase of 4.7 % compared to 2014.
Flying is becoming easier and cheaper, with new airlines, more routes and hundreds of services connecting large numbers of airports across Europe. The EU's Single European Sky will help that trend continue. "Open skies" agreements allow any EU airline to fly from any EU airport to a city in another country. Although the airplanes manufactured today are more environment friendly than those manufactured in the 1960s, aviation remains one of the most polluting forms of transportation as compared to other modes. As emissions occur at a high altitude the emissions are four times as damaging as those that occur at ground level. To reduce their environmental footprint airline companies rely on gradual engine improvements leading to better fuel efficiency. Managing air traffic effectively can also help in reducing the amount of CO2 emissions, e.g. by reducing the amount of time an airplane will have to queue for take-off and landing. In order to make air travel more environmentally friendly a number of airports have adopted alternative sources of energy for the ground operations. |
Data sources and availability
<description of data sources, survey and data availability (completeness, recency) and limitations>
Context
<context of data collection and statistical results: policy background, uses of data, …>
See also
- Name of related Statistics Explained article
- Name of related online publication in Statistics Explained (online publication)
- Name of related Statistics in focus article in Statistics Explained
- Subtitle of Statistics in focus article=PDF main title - Statistics in focus x/YYYY
Further Eurostat information
Data visualisation
- Regional Statistics Illustrated - select statistical domain 'xxx' (= Agriculture, Economy, Education, Health, Information society, Labour market, Population, Science and technology, Tourism or Transport) (top right)
Publications
Publications in Statistics Explained (either online publications or Statistics in focus) should be in 'See also' above
Main tables
- Title(s) of second level folder (if any)
- Title(s) of third level folder (if any)
Database
- Title(s) of second level folder (if any)
- Title(s) of third level folder (if any)
Dedicated section
Methodology / Metadata
<link to ESMS file, methodological publications, survey manuals, etc.>
- Crime and criminal justice (ESMS metadata file — crim_esms)
- Title of the publication
Source data for tables, figures and maps (MS Excel)
Other information
<Regulations and other legal texts, communications from the Commission, administrative notes, Policy documents, …>
- Regulation (EC) No 1737/2005 (generating url [http://eur-lex.europa.eu/LexUriServ/LexUriServ.do?uri=CELEX:32005R1737:EN:NOT Regulation (EC) No 1737/2005]) of DD Month YYYY on ...
- Directive 2003/86/EC (generating url [http://eur-lex.europa.eu/LexUriServ/LexUriServ.do?uri=CELEX:32003L0086:EN:NOT Directive 2003/86/EC]) of DD Month YYYY on ...
- Commission Decision 2003/86/EC (generating url [http://eur-lex.europa.eu/LexUriServ/LexUriServ.do?uri=CELEX:32003D0086:EN:NOT Commission Decision 2003/86/EC]) of DD Month YYYY on ...
<For other documents such as Commission Proposals or Reports, see EUR-Lex search by natural number>
<For linking to database table, otherwise remove: {{{title}}} ({{{code}}})>
External links
Notes
[[Category:<Subtheme category name(s)>|Name of the statistical article]] [[Category:<Statistical article>|Name of the statistical article]]
Delete [[Category:Model|]] below (and this line as well) before saving!

