Archive:Social participation and integration statistics
- Data extracted in May 2017. Most recent data: Further Eurostat information, Main tables and Database. Planned article update: June ????.
This article presents statistics on the involvement of people in social participation in the European Union (EU) in 2015. They are based on data currently available in Eurostat from the EU SILC ad-hoc 2015 Module on Social and cultural participation and Material deprivation which contains, among others, variables measuring social engagement and participation of people aged 16 and over.
For this article, we use the dimensions on formal and informal volunteering, active citizenship, having contact with family and friends, having someone for help or discuss personal matters and communication via social media (for detailed definitions, see the section on Data sources and availability). Active participation in cultural and social life is closely linked with the outlook on the living conditions by households and individuals. This also relates to the concepts of cultural- and social capital which, in addition to economic capital, has significance for the quality of life. Both concepts remind us that social networks and culture have value.
The analyses used for the article cover all EU Member States and several non-EU Member States.
Source: Eurostat (ilc_scp19)

Source: Eurostat (ilc_scp19)

Source: Eurostat (ilc_scp19)
Source: Eurostat (ilc_scp19)
Source: Eurostat (ilc_scp19)
Source: Eurostat (ilc_scp15)
Source: Eurostat (ilc_scp15))
Source: Eurostat (ilc_scp17)
Source: Eurostat (ilc_scp18)

Source: Eurostat (ilc_scp09)
Source: Eurostat (ilc_scp13)
Main statistical findings
Formal and informal voluntary activities
In the 2015 ad-hoc module, two questions have been asked about volunteering, i.e. whether people were involved in formal and/or informal voluntary activities during the past twelve month preceding the survey.
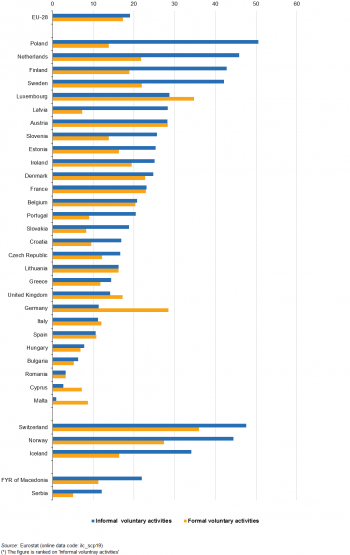
In 2015, the involvement in informal voluntary activities in the EU-28 was slightly higher than in formal (organised) voluntary activities (19% versus 17.3%). This pattern was repeated across most of the EU Member States, with a notable exception of Germany which reported more than twice as high rates for the formal voluntary activities (17.1 percentage points more), as shown in Figure 1.
Some Member States have high levels for formal and informal volunteering, such as the Poland (50.6% for informal volunteering and 13.8% for formal one), the Netherlands (45.9% for informal volunteering and 21.8% for formal one), Finland (42.8% and 18.9%). At the other end of the spectrum, we find Romania (3.2% for both) Cyprus (2.6% and 7.2%) and Malta (0.9 % and 8.6%), see Table 1.
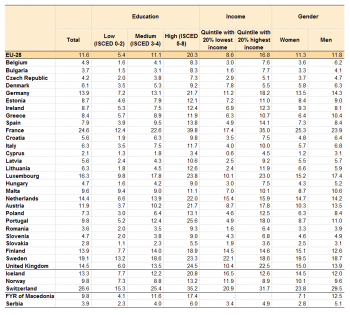
While these large differences between countries may be attributed to different cultural or social structures (i.e. societies which favour more non-organised voluntary activities than others), we can see that in all the European countries, educational attainment strongly influences the voluntary-participation patterns. At EU-28 level, in 2015, the participation rate for formal voluntary activities was 25.3% for people with tertiary education (ISCED 2011 levels 5-8) and 10.1% for people with less than primary, primary and lower secondary education (ISCED 2011 levels 0-2). The corresponding rates for the informal voluntary participation were 25.2 % and 12.2% respectively. This trend is similar across the vast majority of the EU-28 countries, although these differences are less visible in countries with high participation rates in voluntary work (e.g. Norway and the Netherlands) (please see Table 1).
There are no significant differences between women and men as well as across the different age groups. At EU-28 level, the involvement of men was slightly higher in the case of formal voluntary activities whereas women were more involved in informal voluntary work. The most active age group was 65 to 74 years old who tend to participate the most in both types of voluntary activities (19.7% for formal and 21.3% for informal), followed by people between the age of 25-64 years (17.3% and 20%) and young people between the years of 16-24 (16.6% and 17.3%), as shown in Table 2.
Active citizenship
Active citizenship in the 2015 ad-hoc module is understood as a participation in activities related to political groups, associations or parties, including attending any of their meetings or signing a petition. In 2015, at EU-28 level, 11.6 % of all the people replied that they were active citizens according to the definition above. Among the EU-28, we find the highest rate in France (24.6%), followed by Sweden (19.1%) and Luxembourg (16.3%). The least active citizens are in Cyprus (2.1%), Slovakia (2.8%) and Romania (3.6%).
Persons with high educational attainment are more politically active compared with the total population. In 2015, at EU-28 level, 20.3 % of all Europeans with tertiary education stated that they participated in activities related to active citizenship, while the corresponding rates for persons with medium education (upper secondary, ISCED 3-4) and low education (less than primary education, ISCED 0-2) were 11.1 and 5.4 percent respectively. The most striking difference in levels of participation between the highest and the lowest educated persons is to be seen in France (27.3 pp); Portugal (20.4 pp) and UK (18.5 pp), see table Table 3.
There are no significant differences when it comes to active citizenship by gender neither at EU-28 level (the rates are 11.3 % for women and 11.7% for men) nor across the countries with the exception of Greece (10.4% for men and 6.4% for women) and the non-EU country being FYI of Macedonia (12.5% for women and 7.1% for men). The reversed pattern is found in Iceland (12.0 and 14.5%) and Finland (12.6% and 15.1%) where more women are politically active (Table 3).
People with higher income tend be more politically active compared with the total population. This is true regardless of the household types and/or the degree of urbanisation – it is the level of the income that influences the variations across the countries, the participation rate at EU-28 level, for the persons in the highest income quintile was 16.8 %, while it was 8.6 % for the persons in the lowest income quintile; as shown in Table 3.
Reasons for non-participation
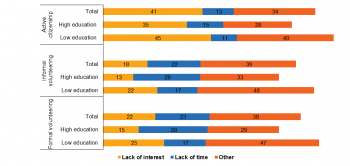
In 2015, 41% of all Europeans stated that they were not interested in participating in active citizenship activities. While the most frequent answer for not volunteering was ‘other reason’ (37.5% for formal and 39.4% for informal). For all three questions on informal/formal voluntary activities and active citizenship, at EU-28 level, people with low education answered more frequently that they are not interested in such activities, while people with tertiary education stated that they cannot participate due lack of time or other reasons, as shown in Figure 2.
Having someone for help or discuss personal matters
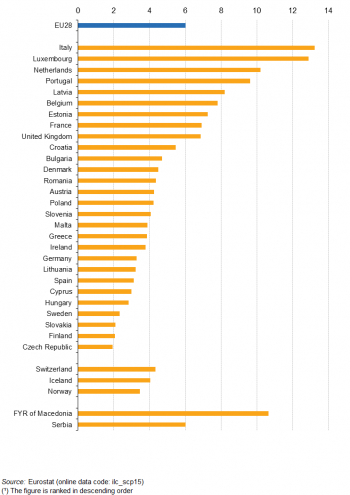
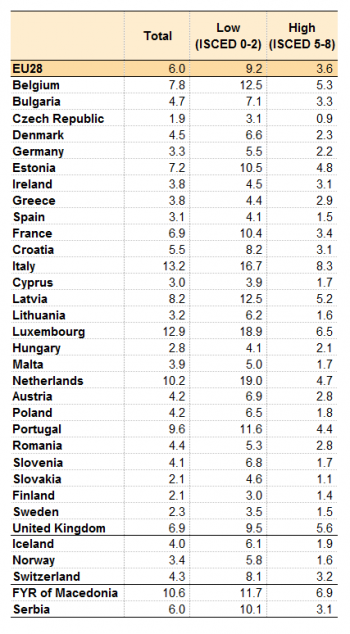
In 2015, 6 % of the EU-28 population could not ask any relative, friend or neighbour for help. In two Member States, the rates for people in the same situation were twice the EU average: Italy (13.2%) and Luxembourg (12.9%). While, only 1.9% to 2.1% of the population in Czechia and Finland responded that they didn’t have anyone for help. In the majority of the Member States the proportion of persons who have nobody to ask for help was well below the EU-28 average, as shown in Figure 3.
In all the Member States, more people with low education had a limited possibility to ask a relative, friend or neighbour for help than the general population (see Table 4). In 2015, in the EU-28, single person households had the most limited ability to ask for help compared to the total population, with the highest rates in Italy (14.1%), Luxembourg (13.4%) and the Netherlands (12.6%).
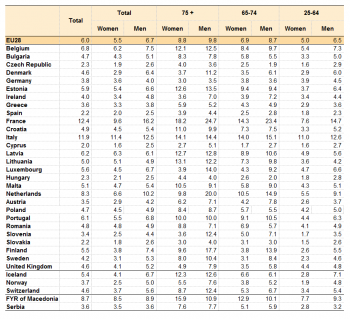
In 2015, 6% of the EU-28 population didn’t have anyone to discuss personal matters with, as shown in Table 5. The Majority of the Member States were below the EU-28 average, with the exceptions of France and Italy in which 12.4% and 11.9% of persons were in this situation. Looking at gender differences, more European men (6.7%) than women (5.5%) didn’t have anyone to discuss personal matters with. Among the Member States, we find the largest gender gap in France, together with the Netherlands and Finland (6.6 pp for France and 3.6 pp for the Netherlands and Finland).
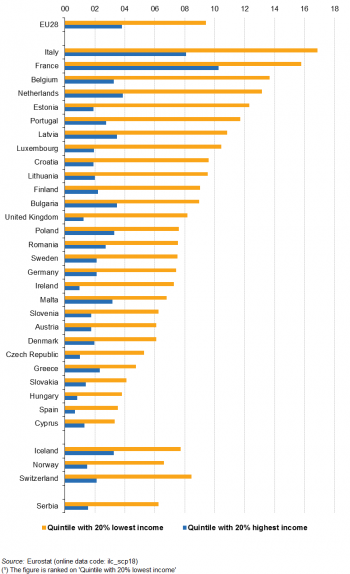
Income inequality seems to influence social isolation, as more than twice as many poor Europeans as the rich ones stated that they didn’t have anyone to discuss personal matters with (see Figure 4). The largest difference between the poorest and the richest persons were reported in Estonia (10.4 pp) and the Netherlands (9.3 pp); the lowest were observed in Cyprus (2 pp) and Greece (2.4 pp).
Integration with friends and relatives
In most EU-28 Member States more than one third of people reported getting together with relatives every week (35%, see Table 6). Exceptions were Cyprus, Slovakia and Greece where most people said they were in contact with relatives on a daily basis (respectively 45.4%, 36.3% and 35.7%). On average, 15.2% of people in the EU-28 reported getting together with relatives less often than once a month or not at all in 2015. At 24.9%, Latvia recorded the highest share of people who never got together with relatives, or only did so less than once a month, followed by Estonia (23%), Lithuania (22.2%)
Similarly, most people in the EU-28 reported getting together with friends every week (38.3%), while about 10 percent (10.8%) of the EU-28 population got together with friends less often than once a month, or even not at all in 2015. Greece, Cyprus and Croatia had the highest proportions (more than 70%) of people who saw friends most frequently (on daily basis or weekly); whereas in Malta, Poland and Lithuania we find the highest share of population which got together with friends less often than once a month, or even not at all in 2015 ( respectively 21.6%, 21.5% and 19.7%), please see Table 6.
Communication via social media
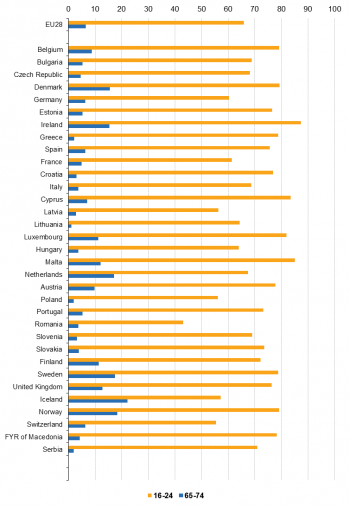
Within the framework of the 2015 ad-hoc module, the respondents were also asked about the frequency with which they participate in social networking sites, such as community-based web sites, online discussions forums, chat rooms and other social spaces online. In 2015, in the EU-28, more than half of the Europeans (51%) reported that they never communicated via social media. However, the second most common answer was the frequency ‘daily’ (25.7%). The variation between the ‘never’ and ‘daily’ is explained by age: the majority of young people between 16 to 24 years old used social media on a daily basis (65.9%); while not even one tenth (6.5%) of the elder people between 65 to 74 years old did; as shown in Figure 5. This pattern was repeated across all the reporting countries.
Data sources and availability
The ad-hoc module 2015 on Social and cultural participation and Material deprivation define the items on social engagement and participation in the following way:
Formal volunteering refers to activities organised through an organisation, a formal group or a club. It also includes unpaid work for charitable or religious organisations.
Informal volunteering, refers helping other people, including family members not living in the same household (e.g. cooking for others; taking care of people in hospitals/at home; taking people for a walk, shopping, etc) - helping animals (e.g. taking care of homeless, wild animals) - other informal voluntary activities such as cleaning a beach, a forest etc.
Getting together with friends or family asks about the frequency with which the respondent usually gets together with family or friends during a usual year. Only relatives or friends who don't live in the respondent’s household should be considered.
The contact with friends or family ask about the frequency with which the respondent is usually in contact with family or friends during a usual year. Contact can be made by telephone, sms, letter, fax, Internet (e-mail, Skype, Facebook, FaceTime or other social networks and other Internet communication tools), etc. Only relatives or friends who don't live in the respondent’s household should be considered. It should be real contact, e.g. a letter or a conversation. Sharing or viewing photos is not a real contact and is excluded.
Ability to ask for help measures the respondent’s possibility to ask any kind of help: moral, material or financial from any relatives, friends or neighbours. Both relatives and friends should be understood in their widest meaning. The question is about the possibility for the respondent to ask for help whether the respondent needs it or not.
To discuss personal matters is defined as the presence of at least one person the respondent can discuss personal matters with. The potential is of having somebody to discuss personal matters with, whether the respondent needs it or not. It can be anybody, including household members and not necessarily family or friends.
Communication via social media is defined as the frequency with which the respondent participates actively in social networking sites, such as community-based web sites, online discussions forums, chat rooms and other social spaces online. Active participation means not only joining social networks but also contributing actively to the discussion. Posting messages, photos, “likes”, etc. is also included. A social media should be understood as any website that enables users to create public profiles within that website and form relationships with other users (not necessarily friends or people really close to him/her) of the same website who access their profile. The examples of such social media can be: Facebook, My Space, LinkedIn, Twitter etc.
All the variables above are collected at personal level via personal interview with all current household members aged 16 and over or, if applicable, with each selected respondent. The age refers to the age at the end of the income reference period.
The reference period for formal and informal social participation is the last twelve months, for the rest of the variables used in the article, the reference period is usual. For more about the methods, please see the Methodology section below.
Context
At the Laeken European Council in December 2001, European heads of state and government endorsed a first set of common statistical indicators for social exclusion and poverty that are subject to a continuing process of refinement by the indicators sub-group (ISG) of the social protection committee (SPC). These indicators are an essential element in the open method of coordination (OMC) to monitor the progress made by the EU’s Member States in alleviating poverty and social exclusion.
EU-SILC is the reference source for EU statistics on income and living conditions and, in particular, for indicators concerning social inclusion. In the context of the Europe 2020 strategy, the European Council adopted in June 2010 a headline target for social inclusion — namely, that by 2020 there should be at least 20 million fewer people in the EU at risk of poverty or social exclusion than there were in 2008. EU-SILC is the source used to monitor progress towards this headline target, which is measured through an indicator that combines the at-risk-of-poverty rate, the severe material deprivation rate, and the proportion of people living in households with very low work intensity — see the article on social inclusion statistics for more information.
Ad-hoc modules are developed each year in order to complement the variables permanently collected in EU-SILC with supplementary variables highlighting unexplored aspects of social inclusion.
The 2015 ad-hoc module include variables on social and cultural participation (15 variables) as well as variables on material deprivation (7 variables). These two topics had been also the themes for previous ad-hoc modules in 2006 (on social participation) and in 2014 and 2009 (on material deprivation).
See also
- Culture statistics - cultural participation
- Quality of life indicators - governance and basic rights (online publication)
- Quality of life indicators - leisure and social interactions
Further Eurostat information
Publications
- Monitoring social inclusion in Europe — 2017 edition
- Quality of life - Facts and views — 2015 edition
- Living conditions in Europe — 2014 Edition
Database
- EU-SILC ad-hoc modules (ilc_ahm)
- Frequency of practicing of artistic activities in the last 12 months by income quintile, household type and degree pf urbanisation
Dedicated section
Methodology / Metadata
- Income and living conditions (ESMS metadata file — ilc_esms)
- Ad-hoc modules (see 2015 – Social/cultural participation and material deprivation)
- Income and living conditions methodology
- EU statistics on income and living conditions (EU-SILC) methodology (online EU SILC methodology)
Source data for tables, figures and maps (MS Excel)
Other information
- Regulation 1177/2003 of 16 June 2003 concerning Community statistics on income and living conditions (EU-SILC)
- Regulation 1553/2005 of 7 September 2005 amending Regulation 1177/2003 concerning Community statistics on income and living conditions (EU-SILC)
- Commission Regulation (EU) No 67/2014 of 27 January 2014 implementing Regulation (EC) No 1177/2003 of the European Parliament and of the Council concerning Community statistics on income and living conditions (EU-SILC) as regards the 2015 list of target secondary variables on social and cultural participation and material deprivation
External links
Notes
[[Category:<Living conditions>|Social participation and integration statistics]] [[Category:<Social participation>|Social participation and integration statistics]] [[Category:<Population and social conditions>|Social participation and integration statistics]] [[Category:<Statistical article>|Social participation and integration statistics]]